

Abstract
Context:
The conventional view that obesity is beneficial for bone strength has recently been challenged by studies that link obesity, particularly visceral obesity, to low bone mass and fractures. It is controversial whether effects of obesity on bone are mediated by increased bone resorption or decreased bone formation.
Objective:
The objective of the study was to evaluate bone microarchitecture and remodeling in healthy premenopausal women of varying weights.
Design:
We measured bone density and trunk fat by dual-energy x-ray absorptiometry in 40 women and by computed tomography in a subset. Bone microarchitecture, stiffness, remodeling, and marrow fat were assessed in labeled transiliac bone biopsies.
Results:
Body mass index (BMI) ranged from 20.1 to 39.2 kg/m2. Dual-energy x-ray absorptiometry-trunk fat was directly associated with BMI (r = 0.78, P < .001) and visceral fat by computed tomography (r = 0.79, P < .001). Compared with women in the lowest tertile of trunk fat, those in the highest tertile had inferior bone quality: lower trabecular bone volume (20.4 ± 5.8 vs 29.1 ± 6.1%; P = .001) and stiffness (433 ± 264 vs 782 ± 349 MPa; P = .01) and higher cortical porosity (8.8 ± 3.5 vs 6.3 ± 2.4%; P = .049). Bone formation rate (0.004 ± 0.002 vs 0.011 ± 0.008 mm2/mm · year; P = .006) was 64% lower in the highest tertile. Trunk fat was inversely associated with trabecular bone volume (r = −0.50; P < .01) and bone formation rate (r = −0.50; P < .001). The relationship between trunk fat and bone volume remained significant after controlling for age and BMI.
Conclusions:
At the tissue level, premenopausal women with more central adiposity had inferior bone quality and stiffness and markedly lower bone formation. Given the rising levels of obesity, these observations require further investigation.
Obesity is a major public health problem in the United States, affecting approximately 36% of adults (1). Although strongly associated with cardiovascular disease, hypertension, and type 2 diabetes (2), obesity is generally thought to be associated with high bone mineral density (BMD) (3–6) and to protect against osteoporosis and fractures (7, 8). However, newer studies have challenged this view by showing that obesity, particularly abdominal obesity, is inversely related to BMD (9–15). Imaging techniques such as quantitative computed tomography (CT), which can differentiate between visceral adipose tissue (VAT) and sc adipose tissue (SAT), suggest that VAT is the fat depot most strongly associated with lower BMD and compromised bone structure (9, 11, 16, 17). Also of concern is the fact that epidemiological data suggest that fracture risk may be increased in obese individuals (18–20).
Because mechanical loading is usually associated with increased bone mass (21), potential mechanisms for the recently described paradoxical effects of obesity on the skeleton are under active investigation. Some investigators have proposed that adverse skeletal effects of obesity are mediated via secretion of inflammatory cytokines from VAT, which causes increased bone resorption and decreased BMD (22, 23). In contrast, others have found that increased VAT is associated with excess bone marrow fat (10) and lower serum bone formation markers, possibly mediated by lower IGF-I, a hormone that is anabolic for the osteoblast (9).
Previous human studies of relationships between obesity and bone have used noninvasive imaging to measure marrow fat and bone quality and serum bone turnover markers to assess bone remodeling. In this study, we used tetracycline-labeled transiliac bone biopsies to investigate relationships between body fat and bone microstructure and remodeling at the tissue level in healthy premenopausal women with normal BMD. We hypothesized that women with higher abdominal fat would have lower bone formation and inferior bone quality as assessed by bone volume fraction.
Materials and Methods
Subjects
Forty premenopausal women, aged 18–48 years, were recruited at Columbia University Medical Center (New York, New York) and Creighton University (Omaha, Nebraska) as a reference population for studies of bone quality in premenopausal women. Subjects were required to have normal areal BMD by dual-energy x-ray absorptiometry (DXA; T score ≥ −1.0 or Z score ≥ −1.0 at all sites) and no history of adult low-trauma fractures. All had regular menses and early follicular phase FSH levels below 20 mIU/mL; none were on hormonal contraception. A detailed history, physical examination, and biochemical evaluation were performed to exclude disorders and medications that could affect skeletal integrity, including diabetes (24). Physical activity was assessed using the modified Baecke questionnaire (25, 26). All subjects provided written informed consent. The institutional review boards of both institutions approved these studies.
Laboratory assessments
A fasting morning blood sample and a 24-hour urine sample collected during the early follicular phase of the menstrual cycle on the participant's usual diet and supplements were stored at −80°C for batch analyses in the research laboratories at Columbia University and the MECORE Laboratory at St Josephs Hospital (Bangor, Maine) as described (24, 27): estradiol (E2), SHBG, intact PTH, 25-hydroxyvitamin D (25-OHD), 1,25 dihydroxyvitamin D, N-terminal propeptides of procollagen type 1 (P1NP), osteocalcin, undercarboxylated osteocalcin, C-telopeptide (CTx), tartrate-resistant acid phosphatase isoform 5b (TRAP5b), IGF-I, leptin, adiponectin, insulin, and glucose. Free E2 and homeostatic model assessment for insulin resistance (HOMA-IR) were calculated as previously described (28, 29).
BMD and body composition
Areal BMD was measured by DXA (QDR-4500; Hologic Inc, Walton, Massachusetts) at the spine, right hip, and forearm in all subjects. Volumetric BMD of the hip and spine was measured in an unselected subset (n = 34) by helical quantitative CT (QCT) scanning on General Electric CT scanners (GE Medical Systems, Milwaukee, Wisconsin) (30, 31). Images were analyzed for total, cortical, and trabecular volumetric BMD at both proximal femurs and femoral necks and total and trabecular volumetric BMD at the spine (mean of L1 and L2) (30, 31) and subjected to finite element analysis to determine unidirectional stiffness (strength) at the spine (L1) and hip (32, 33), as previously described (30, 31).
Whole-body (excluding head) fat and lean mass and trunk (rib and pelvic compartments) fat and lean mass were measured by DXA. VAT and SAT were measured by CT on a single slice at the middle of L3 in 31 women for whom data were available at this site. Cross-sectional areas (square centimeters) of VAT and SAT were calculated by the method of Zhao et al. (34).
Transiliac bone biopsy
Transiliac biopsy (diameter 7.5 mm) was performed after double-labeling with tetracycline (36). Intact biopsies were scanned by microcomputed tomography (μCT; μCT 40; Scanco Medical AG, Brüttisellen, Switzerland), nominal resolution 8 μm, as described in detail (37, 38). Trabecular indices were determined using a direct 3-dimensional approach (39): bone volume fraction (BV/TV), trabecular number, trabecular thickness, and trabecular separation. Apparent stiffness (Young's modulus), a measure of strength, was calculated by finite element analysis of μCT trabecular images (38). Biopsies were embedded in polymethylmethacrylate, sectioned, and stained, and histomorphometry was performed with a digitizing image-analysis system (OsteoMeasure, version 4.00C; OsteoMetrics, Inc, Atlanta, Georgia) by established procedures (38). All variables were calculated according to American Society for Bone and Mineral Research recommendations (40). The primary dynamic histomorphometry variable was cancellous bone formation rate/bone surface (BFR/BS). Adipocytes were measured by the method of Syed et al (27, 41): adipocyte number/square millimeter in the analyzed fields including marrow tissue area and bone area and percent adipocyte volume/marrow volume (Ad.V/Ma.V). Osteoblasts and osteoclasts were identified, counted, and expressed as number per millimeter of bone surface (#/mm) (40).
Statistical analysis
Statistical analyses were performed using SAS (SAS Institute, Cary, North Carolina). ANOVA models were used to examine differences among tertiles based on trunk fat mass by DXA. Student's t tests were used to compare the highest and lowest tertiles. Bonferroni correction was used to adjust for multiple comparisons. Analysis of covariance was used to adjust for age. Correlation analyses were used to describe relationships between variables. Because many variables were not normally distributed (Kolmogorov-Smirnov test), Spearman correlations were used. Multivariate linear regression analyses were used to control for covariates. All data are expressed as mean ± SD. Differences were considered significant with P < .05.
Results
Subject characteristics
Forty healthy Caucasian premenopausal women, aged 37.3 ± 8.2 years, with normal BMD by DXA, no adult low-trauma fractures and no cause of osteoporosis or bone loss, underwent transiliac bone biopsy. Body mass index (BMI) averaged 25.8 ± 4.7 kg/m2 (range 20.1–39.2 kg/m2). Twenty-one women (53%) had a normal BMI (18.5–24.9 kg/m2), whereas 19 (47%) were overweight (25.0–29.9 kg/m2; n = 10) or obese (>30 kg/m2; n = 9).
Mean BMD Z scores were 0.74 ± 0.88 at the spine, 0.48 ± 0.65 at the total hip, and 0.39 ± 0.74 at the femoral neck. By DXA, total body fat averaged 35.5 ± 7.2% and trunk fat, a surrogate for VAT (42, 43), averaged 32.5 ± 8.9%. SAT and VAT measured by CT were available in a subset (n = 31), who did not differ by age, weight, BMI, or spine or femoral neck BMD by DXA. VAT by CT correlated strongly with trunk fat by DXA (Figure 1; r = 0.79, P < .001), total body fat measured by DXA (0.71; P < .001), and BMI (r = 0.78, P < .001).
Figure 1.
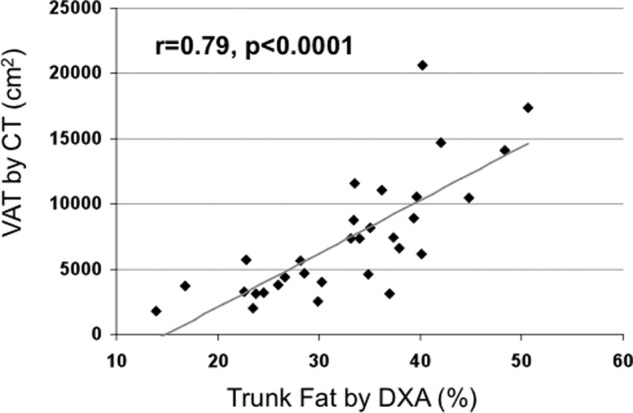
Regression analysis of VAT by CT on trunk fat by DXA. There is a direct relationship between VAT and trunk fat.
Subjects were divided into tertiles by DXA trunk fat (Table 1), available in all. Mean BMI was normal in the lowest tertile (21.6 kg/m2) and in the overweight range in the middle (26.0 kg/m2) and highest tertiles (29.8 kg/m2). Women in tertile 1 were 6 years younger than tertile 3 (P = .041). As expected, weight, BMI, total body fat, SAT, and VAT increased with increasing tertiles of trunk fat, and current exercise was lowest in tertile 3. Areal BMD by DXA and volumetric BMD by QCT did not differ among the tertiles, except at the right femoral neck, in which total volumetric BMD was lower in tertile 3.
Table 1.
Characteristics of the Subjects Grouped by Tertiles of Trunk Fat by DXA
| Tertile 1 (n = 13) | Tertile 2 (n = 14) | Tertile 3 (n = 13) | P Value (ANOVA) | P Value (Tertile 1 vs 3) | P Value (Tertile 1 vs Tertile 3, Adjusted for Age) | |
|---|---|---|---|---|---|---|
| Age, y | 33.3 ± 7.6 | 38.9 ± 8.8 | 39.5 ± 7.1 | .1 | .04 | NA |
| Height, cm | 168.1 ± 6.9 | 164.0 ± 7.6 | 164.2 ± 7.2 | .3 | .2 | .3 |
| Weight, kg | 61.1 ± 6.8 | 70.2 ± 13.0 | 80.7 ± 16.0 | .001 | .009 | .0005 |
| BMI, kg/m2 | 21.6 ± 1.3 | 26.0 ± 3.1 | 29.8 ± 4.6 | <.0001 | <.0001 | <.0001 |
| Exercise, current, min/wk | 150 ± 46 | 171 ± 46 | 98 ± 46 | .001 | .01 | .04 |
| Exercise, past, min/wk | 174 ± 57 | 180 ± 73 | 137 ± 80 | .3 | .2 | .2 |
| Body composition by DXA | ||||||
| WB fat mass | 27.7 ± 4.3 | 35.7 ± 2.1 | 43.0 ± 4.0 | <.0001 | <.0001 | <.0001 |
| WB lean mass | 72.3 ± 4.3 | 64.3 ± 2.1 | 57.0 ± 4.0 | <.0001 | <.0001 | <.0001 |
| Trunk fat massa | 22.3 ± 3.5 | 32.9 ± 3.2 | 42.4 ± 3.7 | <.0001 | <.0001 | <.0001 |
| Trunk lean mass | 77.7 ± 3.5 | 67.1 ± 3.2 | 57.6 ± 3.7 | <.0001 | <.0001 | <.0001 |
| Abdominal fat by CT, cm2 | ||||||
| SAT | 8115 ± 2722 | 18392 ± 4821 | 26064 ± 10908 | <.0001 | .001 | <.0001 |
| VAT | 3430 ± 1192 | 6626 ± 2855 | 12161 ± 4893 | <.0001 | .0006 | .0005 |
| Areal BMD by DXA, g/cm2 | ||||||
| Lumbar spine | 1.11 ± 0.12 | 1.09 ± 0.06 | 1.09 ± 0.10 | .8 | .7 | .2 |
| Total hip | 1.01 ± 0.09 | 0.96 ± 0.06 | 0.98 ± 0.08 | .3 | .5 | .3 |
| Femoral neck | 0.88 ± 0.08 | 0.86 ± 0.07 | 0.87 ± 0.08 | .8 | .7 | .5 |
| Spine volumetric BMD by cQCT, g/cm3, and stiffness by FEA, N/mm | ||||||
| Total vBMD | 0.274 ± 0.016 | 0.268 ± 0.031 | 0.282 ± 0.023 | .4 | .4 | .3 |
| Trabecular vBMD | 0.267 ± 0.016 | 0.259 ± 0.030 | 0.274 ± 0.017 | .3 | .3 | .2 |
| Stiffness | 8261 ± 1381 | 7881 ± 862 | 7716 ± 1076 | .6 | .4 | .3 |
| Left femoral neck volumetric BMD by cQCT, g/cm3, and stiffness by FEA, N/mm | ||||||
| Total vBMD | 0.340 ± 0.031 | 0.318 ± 0.046 | 0.316 ± 0.028 | .3 | .1 | .2 |
| Tb vBMD | 0.188 ± 0.030 | 0.166 ± 0.036 | 0.170 ± 0.027 | .3 | .2 | .5 |
| Cortical vBMD | 0.505 ± 0.041 | 0.501 ± 0.071 | 0.494 ± 0.041 | .9 | .5 | .5 |
| Stiffness | 18395 ± 2326 | 18350 ± 3531 | 18797 ± 3946 | .9 | .8 | .9 |
| Right femoral neck volumetric BMD by cQCT, g/cm3, and stiffness by FEA, N/mm | ||||||
| Total vBMD | 0.343 ± 0.029 | 0.323 ± 0.033 | 0.313 ± 0.024 | .09 | .02 | .03 |
| Tb vBMD | 0.189 ± 0.029 | 0.174 ± 0.040 | 0.164 ± 0.030 | .3 | .08 | .3 |
| Cortical vBMD | 0.515 ± 0.044 | 0.504 ± 0.065 | 0.496 ± 0.039 | .7 | .3 | .2 |
| Stiffness | NA | NA | NA |
Abbreviations: cQCT, central QCT; FEA, finite element analysis; NA, not available; Tb trabecular; vBMD volumetric BMD; WB, whole body. Significant P values (<.05) are shown in bold.
Tertiles are defined based on this variable.
Transiliac crest bone biopsies
μCT of biopsies revealed that, despite having normal BMD by DXA, women in tertile 3 had inferior bone microarchitecture (Table 2 and Figure 4). Trabecular bone volume, number, thickness, and stiffness were lower in tertile 3 than tertile 1. In addition, trabecular bone volume was inversely associated with DXA trunk fat (r = −0.50, P = .001; Figure 2A), even after adjustment for age (P = .003) or current exercise (P = .0002). In contrast, exercise was not significantly associated with bone volume in analyses with (P = .8) or without (P = .4) adjustment for DXA trunk fat. By 2-dimensional histomorphometry, cortical porosity was significantly higher in tertile 3 than tertile 1, although cortical width did not differ. Differences in trabecular bone volume and thickness among trunk fat tertiles remained significant after controlling for age.
Table 2.
Bone Microstructure and Remodeling and Serum Concentrations of Hormones and Indices of Mineral Metabolism and Bone Turnover Markers by Tertiles of Trunk Fat by DXA
| Tertile 1 (n = 13) | Tertile 2 (n = 14) | Tertile 3 (n = 13) | P value (ANOVA) | P Value (Tertile 1 vs Tertile 3) | P Value (Tertile 1 vs Tertile 3, Adjusted for Age) | |
|---|---|---|---|---|---|---|
| Trabecular microarchitecture by μCT and stiffness by FEA | ||||||
| BV/TV, % | 29.1 ± 6.1 | 21.6 ± 8.1 | 20.4 ± 5.8 | .005 | .001 | .01 |
| Trabecular number, #/mm | 2.0 ± 0.3 | 1.8 ± 0.4 | 1.7 ± 0.2 | .09 | .02 | .09 |
| Trabecular thickness, mm | 0.187 ± 0.029 | 0.151 ± 0.036 | 0.145 ± 0.035 | .005 | .003 | .009 |
| Trabecular separation, mm | 0.607 ± 0.060 | 0.638 ± 0.068 | 0.628 ± 0.053 | .4 | .4 | .6 |
| Trabecular stiffness, Mpa | 782.1 ± 349.2 | 429.9 ± 331.0 | 433.0 ± 263.7 | .01 | .01 | .1 |
| Cortical parameters by 2-dimensional histomorphometry | ||||||
| Cortical width, mm | 0.895 ± 0.197 | 0.813 ± 0.217 | 0.889 ± 0.228 | .6 | .9 | .8 |
| Cortical porosity, % | 6.3 ± 2.4 | 7.2 ± 3.0 | 8.8 ± 3.5 | .1 | .049 | .05 |
| Cancellous bone remodeling by histomorphometry | ||||||
| Wall width, μm | 37.8 ± 2.2 | 32.8 ± 3.07 | 34.5 ± 3.7 | .0007 | .01 | .02 |
| BFR/BS, mm2/mm · y | 0.011 ± 0.008 | 0.009 ± 0.007 | 0.004 ± 0.002 | .02 | .006 | .03 |
| Mineral apposition rate, μm/d | 0.66 ± 0.11 | 0.64 ± 0.08 | 0.62 ± 0.08 | .6 | .3 | .5 |
| Mineralizing surface/bone surface, % | 4.5 ± 2.8 | 3.6 ± 2.8 | 1.7 ± 0.9 | .02 | .004 | .02 |
| Activation frequency, cycles per year | 0.393 ± 0.267 | 0.333 ± 0.263 | 0.152 ± 0.063 | .03 | .009 | .05 |
| Bone resorption rate, mm2/mm · y | 0.004 ± 0.005 | 0.002 ± 0.002 | 0.002 ± 0.002 | .3 | .2 | .9 |
| Bone cells and adipocytes | ||||||
| Osteoblast number, #/mm | 1.00 ± 0.61 | 1.16 ± 0.58 | 0.91 ± 0.55 | .5 | .7 | .7 |
| Osteoclast number, #/mm | 0.03 ± 0.02 | 0.04 ± 0.03 | 0.02 ± 0.01 | .03 | .09 | .1 |
| Adipocyte number, #/mm2 | 164.6 ± 35.9 | 179.5 ± 52.9 | 165.9 ± 39.8 | .6 | .9 | .3 |
| Adipocyte volume/marrow volume, % | 22.6 ± 5.5 | 28.9 ± 9.4 | 27.9 ± 8.1 | .1 | .07 | .4 |
| Serum hormones and bone turnover markers | ||||||
| Leptin, ng/mL | 7.6 ± 3.60 | 16.4 ± 7.6 | 27.5 ± 12.3 | <.0001 | <.0001 | <.0001 |
| Adiponectin, μg/L | 16272 ± 5506 | 8782 ± 3156 | 7085 ± 4048 | <.0001 | .0001 | <.0001 |
| HOMA-IR | 0.53 ± 0.16 | 0.92 ± 1.11 | 1.54 ± 1.08 | .03 | .006 | .008 |
| IGF-I, ng/mL | 203 ± 74 | 187 ± 46 | 163 ± 34 | .2 | .1 | .9 |
| Free E2, pmol/L | 1.4 ± 0.9 | 2.3 ± 1.9 | 1.4 ± 0.9 | .1 | 1.0 | .6 |
| FSH, mIU/mL | 6.6 ± 4.0 | 7.6 ± 3.9 | 7.4 ± 2.3 | .7 | .6 | .5 |
| SHBG, nmol/L | 84.8 ± 31.1 | 75.3 ± 24.7 | 50.5 ± 31.3 | .01 | .01 | .002 |
| Calcium, mg/dL | 9.0 ± 0.3 | 9.0 ± 0.3 | 8.9 ± 0.3 | .7 | .5 | .8 |
| PTH, pg/mL | 23.0 ± 8.8 | 20.6 ± 9.7 | 23.7 ± 9.2 | .7 | 1.0 | .6 |
| 25-OHD, ng/mL | 35.5 ± 17.5 | 26.4 ± 10.9 | 29.2 ± 9.8 | .2 | .1 | .3 |
| CTx, ng/mL | 0.412 ± 0.275 | 0.231 ± 0.091 | 0.224 ± 0.057 | .01 | .03 | .2 |
| TRAP5b, U/L | 2.15 ± 1.15 | 1.61 ± 0.69 | 0.93 ± 0.054 | .002 | .003 | .02 |
| P1NP, μg/L | 58.9 ± 22.7 | 43.0 ± 14.1 | 38.0 ± 7.7 | .005 | .007 | .04 |
| Osteocalcin, ng/mL | 21.1 ± 10.4 | 13.2 ± 5.1 | 12.1 ± 3.7 | .003 | .009 | .08 |
| Undercarboxylated osteocalcin, ng/mL | 5.4 ± 5.0 | 2.7 ± 2.1 | 3.9 ± 4.6 | .2 | .4 | .7 |
Significant P values (<.05) are shown in bold.
Figure 4.
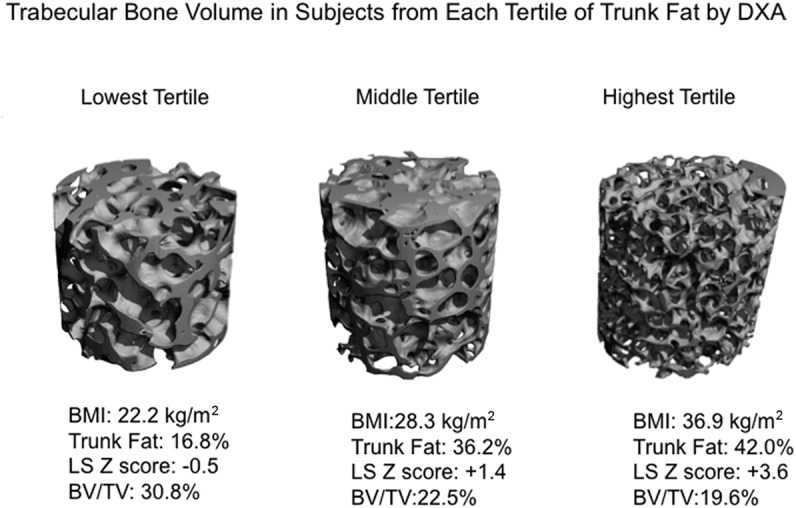
Trabecular bone structure assessed by μCT of transiliac crest bone biopsy samples obtained from representative subjects within each DXA trunk fat tertile. Subjects are chosen to represent the mean BV/TV seen in each tertile.
Figure 2.
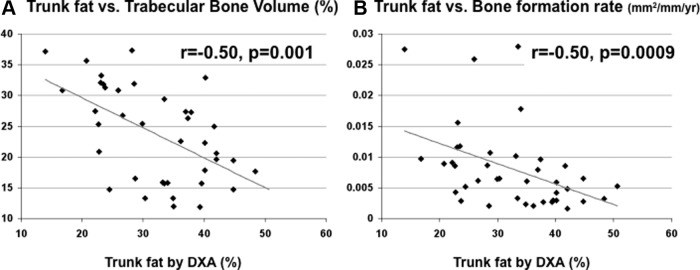
A, Regression analysis of BV/TV (percentage) on trunk fat by DXA. B, Regression analysis of trabecular surface BFR/BS (square millimeters per millimeter per year) on trunk fat by DXA. There are inverse relationships between trunk fat and both trabecular bone volume fraction and cancellous surface bone formation rate. Because some of the parameters were not normally distributed, the relationships are visually represented in the figure with regression lines, whereas the r and P values presented in the figure are derived from Spearman correlation analyses.
Static and dynamic indices of bone formation were markedly and consistently lower in heavier women. Wall width, which reflects the thickness of completed bone packets, was 9% lower, and bone formation rate and mineralizing surface were 64% and 62% lower in tertile 3 than tertile 1. These differences remained significant after controlling for age. Cancellous bone formation rate was inversely associated both with DXA trunk fat (−0.50, P < .001; Figure 2B) and VAT by QCT (r = −0.37; P = .040). The relationship with DXA trunk fat remained significant after adjustment for age (P = .02) or current exercise (P = .02). In contrast, although bone formation rate was related to exercise (r = 0.43, P = .008), the relationship with exercise was no longer significant (P = .2) in analyses controlling for DXA trunk fat. The bone resorption rate did not differ. Despite large differences in bone formation, osteoblast number did not differ between tertiles 1 and 3. Ad.V/Ma.V tended to be lower in tertile 1 than tertile 3 (P = .067) and was significantly lower when tertile 1 was compared with tertiles 2 and 3 combined (P = .038). The relationship between trunk fat tertile and Ad.V/Ma.V was not significant after controlling for age.
Relationships between VAT and both bone volume (r = −0.33; P = .07) and bone formation rate (r = −0.37, P = .04) were similar to those seen with DXA trunk fat.
Serum biochemistries
As expected, HOMA-IR rose with increasing levels of trunk fat (Table 2). Because fasting glucose ranged from 73 to 115 mg/dL, no subject met fasting glucose criteria for diabetes. Three subjects had impaired fasting glucose (100–115 mg/dL); 2 were in tertile 3, whereas 1 was in tertile 1.
As expected, serum leptin was significantly higher and adiponectin significantly lower in tertile 3 than tertile 1. SHBG was lower in tertile 3, but serum FSH, free E2, calcium, PTH, and 25-OHD did not differ among the groups.
Consistent with the biopsy remodeling data, serum bone formation markers (osteocalcin and P1NP) were lower in tertile 3 before and after controlling for age. The bone resorption markers, serum CTx and TRAP5b, were also lower, suggesting a global decrease in remodeling rate rather than uncoupling of formation and resorption. Resorption and formation markers were inversely associated with all measures of body fat. Serum CTx was inversely associated with trunk fat (−0.40; P = .011) and VAT (−0.45; P = .012) and with BMI (r = −0.41, P = .008), total fat (−0.37; P = .020), and SAT (−0.36; P = .044). Serum P1NP was inversely associated with trunk fat (−0.52; P < .001) and VAT (−0.55; P = .001) and with BMI (r = −0.46, P = .003), total fat (−0.47; P = .002), and SAT (−0.55; P = .001). Osteocalcin was inversely associated with trunk fat and VAT (both r = −0.42, P < .01), whereas undercarboxylated osteocalcin was not significantly associated with these measures. Serum IGF-I tended to be lower in tertile 3 than tertile 1 (P = .099) but not after adjustment for age (P = .9). After Bonferroni correction, for the variables listed in Table 2, tertile 3 subjects remained significantly different from tertile 1 subjects in terms of BV/TV, leptin, and adiponectin.
Regression analyses
We used regression analysis to investigate mechanisms by which increased abdominal fat could lead to decreased bone formation and inferior bone microarchitecture and stiffness. We hypothesized that higher trunk fat would be associated with higher marrow fat and lower serum IGF-I and that lower serum IGF-I would in turn be associated with lower bone formation. Supporting this hypothesis, marrow adipocyte volume was directly associated with trunk fat (Figures 3A; r = 0.37, P = .019) and also with total body fat (r = 0.40, P = .011) by DXA and with SAT by QCT (r = 0.40, P = .025). Serum IGF-I was inversely associated with VAT (Figure 3B; r = −0.45, P = .010) but not related to trunk fat (r = −0.16, P = .3) or other fat measures. Serum IGF-I was directly associated with the bone formation rate (Figure 3C; r = 0.38, P = .017), although not with bone volume fraction or marrow adiposity. Finally, bone formation rate correlated directly with bone volume fraction (r = 0.42, P = .008) and stiffness (r = 0.41, P = .012).
Figure 3.

A, Regression analysis of adipocyte volume/marrow volume on trunk fat by DXA shows a direct relationship. B, Regression analysis of serum IGF-I on VAT by CT shows an inverse relationship. C, Regression analysis of cancellous surface BFR/BS (square millimeters per millimeter per year) on serum IGF-I shows a direct relationship.
Because marrow fat increases and serum IGF-1 decreases with age, we adjusted for age. Relationships between trunk fat and both bone volume fraction and bone formation rate remained significant (P = .003 and P = .02, respectively), whereas the relationships between trunk fat and marrow adiposity (P = .2) and VAT or trunk fat and IGF-I (P = .4 and P = .8, respectively) were no longer significant. To assess whether the effects of trunk fat were specific to this fat depot and distinct from generalized obesity, we controlled for BMI. The relationship between trunk fat and bone volume fraction remained significant (P = .002), whereas the relationships between trunk fat and bone formation (P = .097) and marrow adiposity (P = .058) were no longer significant.
Discussion
Transiliac crest biopsy, obtained after double tetracycline labeling of active bone forming surfaces, is the gold standard for measuring bone microstructure and remodeling at the tissue level. To our knowledge, this is the first study to characterize relationships between body fat distribution and trabecular bone microarchitecture, stiffness, and remodeling in bone biopsies in healthy premenopausal women. Higher trunk fat mass was associated with inferior bone quality, as evidenced by markedly lower trabecular bone volume fraction, fewer and thinner trabeculae, lower trabecular stiffness, and higher cortical porosity. Women with higher trunk fat mass also had markedly lower static and dynamic indices of bone formation, lower serum bone formation markers, and also lower resorption markers. Thus, this study provides tissue-level evidence that higher trunk fat mass is associated with decreased bone formation and goes against the hypothesis that production of adipokines and inflammatory cytokines by adipose tissue leads to lower bone volume by increasing bone resorption (22).
Inverse associations between fat and bone mass have been reported in children, men, and pre- and postmenopausal women (9–15, 18, 19, 23). Studies in which DXA was used to measure body composition and bone mass reported that lean body mass was positively and fat mass negatively associated with BMD (13, 14, 19). Trunk fat by DXA, which includes fat in the rib and pelvic compartments and is considered a surrogate for VAT (42, 43), was also inversely associated with BMD (44). CT studies, which differentiate between VAT and SAT, have shown that VAT is most strongly associated with lower BMD and/or compromised bone structure (9, 11, 16, 17), particularly after controlling for weight or BMI (9, 17, 45).
In 68 obese premenopausal women, Bredella et al (9) measured lumbar spine trabecular BMD and abdominal fat by CT, finding an inverse association between BMD and VAT, independent of age and BMI (P = .003). Although we found that neither areal BMD by DXA nor volumetric BMD by QCT was consistently lower in women in the highest tertile of trunk fat, our biopsy data revealed tissue level evidence for low trabecular bone volume, a measure of trabecular bone mass, and disrupted trabecular microarchitecture, even though all subjects had normal BMD by DXA. The lack of relationships between trunk fat and BMD in our study may be because normal BMD was required for participation, which resulted in a narrow distribution of measurements. Additionally, it is possible that the known contribution of bone size to BMD by DXA (46) may have obscured expected relationships that were seen for the other 3-dimensional, volumetric techniques. Additionally, the fat distribution in soft tissue around the bone and within the marrow may affect DXA BMD measurements (47), and the variable effects of these fat depots on the 2-dimensional DXA assessment may have interfered with our ability to detect relationships.
Two lines of evidence support an inverse relationship between trunk fat and bone formation in our subjects. First, iliac crest biopsy parameters reflecting all phases of bone formation were significantly lower in women in the highest tertile of trunk fat. These include wall width (the average thickness of completed bone packets), mineralizing surface (the percent of bone surface undergoing active mineralization), and mineral apposition rate (a measure of how quickly osteoblasts synthesize and mineralize osteoid). In addition, activation frequency (number of bone remodeling units initiated at a site annually) was lower. Second, serum concentrations of bone formation markers, osteocalcin, and P1NP, which reflect remodeling in the entire skeleton rather than the small volume at the iliac crest, were consistently lower in subjects with higher trunk fat. Resorption markers were also lower, suggesting a global decrease in remodeling rather than uncoupling of formation and resorption.
Several other studies have evaluated the relationships between obesity and serum bone formation markers. Some (9, 48, 49), but not all (50), found that the formation marker, osteocalcin, was lower in obese vs normal-weight children and young adults. Moreover, in 1 such study, lower bone formation was associated with fracture history (49), suggestive of poorer bone quality. In addition to inverse associations between BMD and VAT in premenopausal women, Bredella et al (9) also found that the formation marker P1NP was directly associated with SAT and tended to be inversely associated with VAT (r = −0.21, P = .09). Bone turnover markers were also lower in postmenopausal women with obesity or more visceral fat than normal-weight postmenopausal women (51–53), and lower osteocalcin has been associated with less favorable glucose and/or lipid metabolism in older adults (8, 54). However, postmenopausal women are estrogen deficient and generally have elevated bone remodeling that leads to excessive bone loss. Thus, it is unclear whether lower remodeling associated with obesity would have harmful or beneficial effects on bone after menopause.
Studies in animal models suggest that the skeleton may be the primary mediator of a fat-bone relationship, via osteocalcin, an osteoblast-specific peptide. Osteocalcin knockout mice have increased fat mass and decreased insulin sensitivity (55), whereas treatment of wild-type mice with undercarboxylated osteocalcin leads to decreased fat mass and improved glucose handling (56). Although the primacy of skeletal vs adipose tissue in these relationships cannot be determined by this study, we detected no significant relationships between undercarboxylated osteocalcin, which is thought to be the metabolically active form of the molecule, and either fat or bone parameters. Additionally, we saw a global decrease in both resorption and formation in those with more abdominal fat, rather than solely an osteoblastic effect.
Another potential mechanism by which higher abdominal fat could lead to decreased bone formation and inferior bone microarchitecture and stiffness is via its association with increased marrow fat (10). Excess marrow fat may adversely affect bone formation because osteoblasts and adipocytes derive from a common marrow mesenchymal precursor (57). Whether that precursor differentiates into an adipocyte or an osteoblast is under the control of the GH/IGF-I axis as well as other hormones and factors, such as peroxisomal proliferator-activated receptor-γ. Excess marrow fat has been implicated in osteoporosis related to aging, postmenopausal estrogen deficiency, anorexia nervosa, glucocorticoids, and thiazolidinediones (41, 58–66) and may contribute to vertebral fragility independent of BMD (65, 66). Because the GH/IGF-I axis regulates both bone and adipose tissue, it may play a central role in mechanisms linking obesity to decreased bone quality. Obesity is associated with decreased GH secretion (9, 48), but it is unclear which of these is primary. Pituitary GH/IGF-I deficiency is associated with increased VAT, decreased BMD, and increased fracture risk (67). Moreover, both body composition changes (68) and low BMD can be reversed by GH replacement in these patients.
Using proton magnetic resonance spectroscopy to measure vertebral bone marrow fat and QCT to measure body composition and vertebral trabecular BMD, Bredella et al (10) reported that premenopausal women with high VAT had higher vertebral bone marrow fat than those with low VAT, independent of BMD. The investigators also found inverse correlations between vertebral bone marrow fat and both vertebral BMD and serum IGF-I, the latter relationship being independent of VAT (10). Serum IGF-I correlated inversely with VAT and was the strongest predictor of BMD and P1NP (9). The findings of these authors support the hypothesis that VAT exerts detrimental effects on BMD in premenopausal obese women via increased marrow fat and that IGF-I mediates the deleterious effects of VAT and marrow fat on bone health through decreased bone formation (9, 10).
Consistent with Bredella et al (9, 10), we found that, compared with women in the lowest tertile of trunk fat, iliac crest marrow fat (adipocyte volume/marrow volume) tended to be higher in the highest tertile, was significantly higher when the 2 upper tertiles were combined, and correlated directly with trunk fat. We also found that serum IGF-I correlated inversely with VAT, although there was no association with BMD. Finally, we found that serum IGF-I correlated positively with the bone formation rate. Thus, our results confirm and extend their findings by providing evidence of increased marrow fat, decreased bone formation, and inferior bone microarchitecture at the tissue level and also support a potential role for IGF-I as a mediator of the relationship between fat and bone.
This study has several limitations. Trunk fat by DXA was our primary measure of abdominal obesity because it was available in all participants, is a good surrogate for VAT (42, 43), and correlated strongly with VAT in participants with both measurements. However, VAT is most strongly related to insulin resistance, cardiovascular risk (69–73), and BMD and marrow adiposity (9, 11, 16, 17), and DXA trunk fat is an imperfect surrogate for VAT because it includes both abdominal SAT and VAT. This may explain the inconsistent relationships with IGF-I, which were present with VAT but absent with DXA trunk fat. We measured VAT and SAT at the middle of the third lumbar vertebra, the lowest level consistently available. Although this level correlates well with volumetric VAT and SAT (35), it is more common to measure at the fourth and fifth lumbar vertebrae. Women in the highest tertile of trunk fat were 6 years older than those in the lowest tertile, which could account for their lower bone volume and bone formation (74). However, differences remained significant after controlling for their older age. Similarly, women in the lowest tertile of trunk fat reported more current exercise, which may account for their higher bone volume fraction.
Our findings may not be generalizable to postmenopausal women, men, other races, or severely obese women (BMI > 40 kg/m2), excluded because of difficulty performing transiliac bone biopsies. Normal BMD was required for participation, which resulted in a narrow range of BMD measurements and may have limited our ability to detect relationships with BMD. Transiliac bone biopsies, although the gold standard for measuring bone microstructure and remodeling, encompass a small core of bone and may not be representative of other sites. The cross-sectional study design limits our ability to prove causality and to assess relationships between changes in abdominal fat, low bone remodeling, inferior bone microarchitecture, and fractures. Finally, this study was undertaken to explore mechanistic hypotheses, and multiple comparisons performed in the same subjects may increase the chance of a type 1 error.
In summary, in healthy premenopausal women, we found that trunk fat mass by DXA, which correlated with VAT by CT, was associated with higher bone marrow fat, lower trabecular bone volume fraction and stiffness, and lower bone formation by quantitative histomorphometry of transiliac bone biopsies, independent of age and BMI. Bone formation was directly related to serum IGF-I concentrations. Given the rising prevalence of obesity in our population, the association between higher trunk fat and inferior bone quality raises concerns about future fracture risk and requires further investigation.
Acknowledgments
This work was supported by National Institutes of Health Grants R01 AR049896 (to E.S.), K24 AR 05266 (to E.S.), and K23 AR054127 (to A.C.).
Disclosure Summary: The authors have nothing to disclose.
Footnotes
- Ad.V/Ma.V
- adipocyte volume/marrow volume
- BFR/BS
- bone formation rate/bone surface
- BMD
- bone mineral density
- BMI
- body mass index
- BV/TV
- bone volume fraction
- cQCT
- central QCT
- CT
- computed tomography
- μCT
- microcomputed tomography
- CTx
- C-telopeptide
- DXA
- dual-energy x-ray absorptiometry
- E2
- estradiol
- HOMA-IR
- homeostatic model assessment for insulin resistance
- #/mm
- number per millimeter of bone surface
- 25-OHD
- 25-hydroxyvitamin D
- P1NP
- procollagen type 1
- QCT
- quantitative CT
- SAT
- sc adipose tissue
- TRAP5b
- tartrate-resistant acid phosphatase isoform 5b
- VAT
- visceral adipose tissue.
References
- 1. Flegal KM, Carroll MD, Kit BK, Ogden CL. Prevalence of obesity and trends in the distribution of body mass index among US adults, 1999–2010. JAMA. 2012;307:491–497 [DOI] [PubMed] [Google Scholar]
- 2. Nejat EJ, Polotsky AJ, Pal L. Predictors of chronic disease at midlife and beyond—the health risks of obesity. Maturitas. 65:106–111 [DOI] [PubMed] [Google Scholar]
- 3. Klein KO, Larmore KA, de Lancey E, Brown JM, Considine RV, Hassink SG. Effect of obesity on estradiol level, and its relationship to leptin, bone maturation, and bone mineral density in children. J Clin Endocrinol Metab. 1998;83:3469–3475 [DOI] [PubMed] [Google Scholar]
- 4. Reid IR, Plank LD, Evans MC. Fat mass is an important determinant of whole body bone density in premenopausal women but not in men. J Clin Endocrinol Metab. 1992;75:779–782 [DOI] [PubMed] [Google Scholar]
- 5. Albala C, Yanez M, Devoto E, Sostin C, Zeballos L, Santos JL. Obesity as a protective factor for postmenopausal osteoporosis. Int J Obes Relat Metab Disord. 1996;20:1027–1032 [PubMed] [Google Scholar]
- 6. Yamauchi M, Sugimoto T, Yamaguchi T, et al. Plasma leptin concentrations are associated with bone mineral density and the presence of vertebral fractures in postmenopausal women. Clin Endocrinol (Oxf). 2001;55:341–347 [DOI] [PubMed] [Google Scholar]
- 7. De Laet C, Kanis JA, Oden A, et al. Body mass index as a predictor of fracture risk: a meta-analysis. Osteoporos Int. 2005;16:1330–1338 [DOI] [PubMed] [Google Scholar]
- 8. Pittas A, Harris SS, Eliades M, Stark P, Dawson-Hughes B. Association between serum osteocalcin and markers of metabolic phenotype. J Clin Endocrinol Metab. 2009;94:827–832 [DOI] [PMC free article] [PubMed] [Google Scholar]
- 9. Bredella MA, Torriani M, Ghomi RH, et al. Determinants of bone mineral density in obese premenopausal women. Bone. 2011;48:748–754 [DOI] [PMC free article] [PubMed] [Google Scholar]
- 10. Bredella MA, Torriani M, Ghomi RH, et al. Vertebral bone marrow fat is positively associated with visceral fat and inversely associated with IGF-1 in obese women. Obesity (Silver Spring). 2011;19:49–53 [DOI] [PMC free article] [PubMed] [Google Scholar]
- 11. Gilsanz V, Chalfant J, Mo AO, Lee DC, Dorey FJ, Mittelman SD. Reciprocal relations of subcutaneous and visceral fat to bone structure and strength. J Clin Endocrinol Metab. 2009;94:3387–3393 [DOI] [PMC free article] [PubMed] [Google Scholar]
- 12. Pollock NK, Laing EM, Hamrick MW, Baile CA, Hall DB, Lewis RD. Bone and fat relationships in postadolescent black females: a pQCT study. Osteoporos Int. 2011;22:655–665 [DOI] [PubMed] [Google Scholar]
- 13. Janicka A, Wren TA, Sanchez MM, et al. Fat mass is not beneficial to bone in adolescents and young adults. J Clin Endocrinol Metab. 2007;92:143–147 [DOI] [PubMed] [Google Scholar]
- 14. Zhao LJ, Liu YJ, Liu PY, Hamilton J, Recker RR, Deng HW. Relationship of obesity with osteoporosis. J Clin Endocrinol Metab. 2007;92:1640–1646 [DOI] [PMC free article] [PubMed] [Google Scholar]
- 15. Sheu Y, Cauley JA. The role of bone marrow and visceral fat on bone metabolism. Curr Osteoporos Rep. 2011;9:67–75 [DOI] [PMC free article] [PubMed] [Google Scholar]
- 16. Russell M, Mendes N, Miller KK, et al. Visceral fat is a negative predictor of bone density measures in obese adolescent girls. J Clin Endocrinol Metab. 2010;95:1247–1255 [DOI] [PMC free article] [PubMed] [Google Scholar]
- 17. Choi HS, Kim KJ, Kim KM, et al. Relationship between visceral adiposity and bone mineral density in Korean adults. Calcif Tissue Int. 2010;87:218–225 [DOI] [PubMed] [Google Scholar]
- 18. Nielson CM, Marshall LM, Adams AL, et al. BMI and fracture risk in older men: the osteoporotic fractures in men study (MrOS). J Bone Miner Res. 2011;26:496–502 [DOI] [PMC free article] [PubMed] [Google Scholar]
- 19. Hsu YH, Venners SA, Terwedow HA, et al. Relation of body composition, fat mass, and serum lipids to osteoporotic fractures and bone mineral density in Chinese men and women. Am J Clin Nutr. 2006;83:146–154 [DOI] [PubMed] [Google Scholar]
- 20. Compston JE, Watts NB, Chapurlat R, et al. Obesity is not protective against fracture in postmenopausal women: GLOW. Am J Med. 2011;124:1043–1050 [DOI] [PMC free article] [PubMed] [Google Scholar]
- 21. Skerry TM. The response of bone to mechanical loading and disuse: fundamental principles and influences on osteoblast/osteocyte homeostasis. Arch Biochem Biophys. 2008;473:117–123 [DOI] [PubMed] [Google Scholar]
- 22. Cao JJ. Effects of obesity on bone metabolism. J Orthop Surg Res. 2011;6:30. [DOI] [PMC free article] [PubMed] [Google Scholar]
- 23. Ibrahim SE, El Shishtawky HF, Helmy A, Galal ZA, Salam MHA. Serum leptin concentration, bone mineral density and bone biochemical markers in a sample of Egyptian women: a possible relationship. Egyptian Rheumatologist. 2011;33:171–177 [Google Scholar]
- 24. Cohen A, Recker RR, Lappe J, et al. Premenopausal women with idiopathic low-trauma fractures and/or low bone mineral density. Osteoporos Int. 2012;23:171–182 [DOI] [PMC free article] [PubMed] [Google Scholar]
- 25. Albanes D, Conway JM, Taylor PR, Moe PW, Judd J. Validation and comparison of eight physical activity questionnaires. Epidemiology. 1990;1:65–71 [DOI] [PubMed] [Google Scholar]
- 26. Pols MA, Peeters PH, Bueno-De-Mesquita HB, et al. Validity and repeatability of a modified Baecke questionnaire on physical activity. Int J Epidemiol. 1995;24:381–388 [DOI] [PubMed] [Google Scholar]
- 27. Cohen A, Dempster D, Stein E, et al. Increased marrow adiposity in premenopausal women with idiopathic osteoporosis. J Clin Endocrinol Metab. 2012;97:2782–2791 [DOI] [PMC free article] [PubMed] [Google Scholar]
- 28. Sodergard R, Backstrom T, Shanbhag V, Carstensen H. Calculation of free and bound fractions of testosterone and estradiol-17β to human plasma proteins at body temperature. J Steroid Biochem. 1982;16:801–810 [DOI] [PubMed] [Google Scholar]
- 29. Wallace TM, Levy JC, Matthews DR. Use and abuse of HOMA modeling. Diabetes Care. 2004;27:1487–1495 [DOI] [PubMed] [Google Scholar]
- 30. Liu XS, Cohen A, Shane E, et al. Bone density, geometry, microstructure, and stiffness: relationships between peripheral and central skeletal sites assessed by DXA, HR-pQCT, and cQCT in premenopausal women. J Bone Miner Res. 2010;25:2229–2238 [DOI] [PMC free article] [PubMed] [Google Scholar]
- 31. Cohen A, Lang T, McMahon DJ, et al. Central QCT reveals cortical and trabecular structural defects in premenopausal women with idiopathic osteoporosis, regardless of fracture history. J Clin Endocrinol Metab. 2012;97(11):4244–4252 [DOI] [PMC free article] [PubMed] [Google Scholar]
- 32. Crawford RP, Cann CE, Keaveny TM. Finite element models predict in vitro vertebral body compressive strength better than quantitative computed tomography. Bone. 2003;33:744–750 [DOI] [PubMed] [Google Scholar]
- 33. Keyak JH, Kaneko TS, Tehranzadeh J, Skinner HB. Predicting proximal femoral strength using structural engineering models. Clin Orthop Relat Res. 2005;219–228 [DOI] [PubMed] [Google Scholar]
- 34. Zhao B, Colville J, Kalaigian J, et al. Automated quantification of body fat distribution on volumetric computed tomography. J Comput Assist Tomogr. 2006;30:777–783 [DOI] [PubMed] [Google Scholar]
- 35. Irlbeck T, Massaro JM, Bamberg F, O'Donnell CJ, Hoffmann U, Fox CS. Association between single-slice measurements of visceral and abdominal subcutaneous adipose tissue with volumetric measurements: the Framingham Heart Study. Int J Obes (Lond). 2010;34:781–787 [DOI] [PMC free article] [PubMed] [Google Scholar]
- 36. Dempster DW, Shane E. Bone quantification and dynamics of bone turnover. In: Becker KL, ed. Principles and Practice of Endocrinology and Metabolism. Philadelphia: J. B. Lippincott Co; 2002:475–479 [Google Scholar]
- 37. Ruegsegger P, Koller B, Muller R. A microtomographic system for the nondestructive evaluation of bone architecture. Calcif Tissue Int. 1996;58:24–29 [DOI] [PubMed] [Google Scholar]
- 38. Cohen A, Dempster DW, Muller R, et al. Assessment of trabecular and cortical architecture and mechanical competence of bone by high-resolution peripheral computed tomography: comparison with transiliac bone biopsy. Osteoporos Int. 2010;21:263–273 [DOI] [PMC free article] [PubMed] [Google Scholar]
- 39. Hildebrand T, Laib A, Muller R, Dequeker J, Ruegsegger P. Direct three-dimensional morphometric analysis of human cancellous bone: microstructural data from spine, femur, iliac crest, and calcaneus. J Bone Miner Res. 1999;14:1167–1174 [DOI] [PubMed] [Google Scholar]
- 40. Parfitt AM, Drezner MK, Glorieux FH, et al. Bone histomorphometry: standardization of nomenclature, symbols, and units. Report of the ASBMR Histomorphometry Nomenclature Committee. J Bone Miner Res. 1987;2:595–610 [DOI] [PubMed] [Google Scholar]
- 41. Syed FA, Oursler MJ, Hefferanm TE, Peterson JM, Riggs BL, Khosla S. Effects of estrogen therapy on bone marrow adipocytes in postmenopausal osteoporotic women. Osteoporos Int. 2008;19:1323–1330 [DOI] [PMC free article] [PubMed] [Google Scholar]
- 42. Bredella MA, Ghomi RH, Thomas BJ, et al. Comparison of DXA and CT in the assessment of body composition in premenopausal women with obesity and anorexia nervosa. Obesity (Silver Spring). 2010;18:2227–2233 [DOI] [PMC free article] [PubMed] [Google Scholar]
- 43. Snijder MB, Visser M, Dekker JM, et al. The prediction of visceral fat by dual-energy X-ray absorptiometry in the elderly: a comparison with computed tomography and anthropometry. Int J Obes Relat Metab Disord. 2002;26:984–993 [DOI] [PubMed] [Google Scholar]
- 44. Ackerman KE, Davis B, Jacoby L, Misra M. DXA surrogates for visceral fat are inversely associated with bone density measures in adolescent athletes with menstrual dysfunction. J Pediatr Endocrinol Metab. 2011;24:497–504 [DOI] [PMC free article] [PubMed] [Google Scholar]
- 45. Yamaguchi T, Kanazawa I, Yamamoto M, et al. Associations between components of the metabolic syndrome versus bone mineral density and vertebral fractures in patients with type 2 diabetes. Bone. 2009;45:174–179 [DOI] [PubMed] [Google Scholar]
- 46. Adams J, Bishop N. DXA in adults and children. In: Rosen CJ, ed. Primer on the Metabolic Bone Diseases and Disorders of Mineral Metabolism. Washington, DC: American Society for Bone and Mineral Research; 2008:152–158 [Google Scholar]
- 47. Hangartner TN, Johnston CC. Influence of fat on bone measurements with dual-energy absorptiometry. Bone Miner. 1990;9:71–81 [DOI] [PubMed] [Google Scholar]
- 48. Bini V, Igli Baroncelli G, Papi F, Celi F, Saggese G, Falorni A. Relationships of serum leptin levels with biochemical markers of bone turnover and with growth factors in normal weight and overweight children. Horm Res. 2004;61:170–175 [DOI] [PubMed] [Google Scholar]
- 49. Dimitri P, Wales JK, Bishop N. Adipokines, bone-derived factors and bone turnover in obese children; evidence for altered fat-bone signalling resulting in reduced bone mass. Bone. 2011;48:189–196 [DOI] [PubMed] [Google Scholar]
- 50. Grethen E, Hill KM, Jones R, et al. Serum leptin, parathyroid hormone, 1,25-dihydroxyvitamin D, fibroblast growth factor 23, bone alkaline phosphatase, and sclerostin relationships in obesity. J Clin Endocrinol Metab. 2012;97:1655–1662 [DOI] [PMC free article] [PubMed] [Google Scholar]
- 51. Lee SW, Jo HH, Kim MR, You YO, Kim JH. Association between obesity, metabolic risks and serum osteocalcin level in postmenopausal women. Gynecol Endocrinol. 2012;28:472–477 [DOI] [PubMed] [Google Scholar]
- 52. Garcia-Martin A, Cortes-Berdonces M, Luque-Fernandez I, Rozas-Moreno P, Quesada-Charneco M, Munoz-Torres M. Osteocalcin as a marker of metabolic risk in healthy postmenopausal women. Menopause. 2011;18:537–541 [DOI] [PubMed] [Google Scholar]
- 53. Papakitsou EF, Margioris AN, Dretakis KE, et al. Body mass index (BMI) and parameters of bone formation and resorption in postmenopausal women. Maturitas. 2004;47:185–193 [DOI] [PubMed] [Google Scholar]
- 54. Kindblom JM, Ohlsson C, Ljunggren O, Karlsson MK, Tivesten A, Smith U, Mellstrom D. Plasma osteocalcin is inversely related to fat mass and plasma glucose in elderly Swedish men. J Bone Miner Res. 2009;24:785–791 [DOI] [PubMed] [Google Scholar]
- 55. Lee NK, Karsenty G. Reciprocal regulation of bone and energy metabolism. Trends Endocrinol Metab. 2008;19:161–166 [DOI] [PubMed] [Google Scholar]
- 56. Ferron M, Hinoi E, Karsenty G, Ducy P. Osteocalcin differentially regulates β cell and adipocyte gene expression and affects the development of metabolic diseases in wild-type mice. PNAS. 2008;105:5266–5270 [DOI] [PMC free article] [PubMed] [Google Scholar]
- 57. Rosen CJ, Bouxsein ML. Mechanisms of disease: is osteoporosis the obesity of bone? Nat Clin Pract Rheumatol. 2006;2:35–43 [DOI] [PubMed] [Google Scholar]
- 58. Lecka-Czernik B, Moerman EJ, Grant DF, Lehmann JM, Manolagas SC, Jilka RL. Divergent effects of selective peroxisome proliferator-activated receptor-γ2 ligands on adipocyte versus osteoblast differentiation. Endocrinology. 2002;143:2376–2384 [DOI] [PubMed] [Google Scholar]
- 59. Grey A. Thiazolidinedione-induced skeletal fragility—mechanisms and implications. Diabetes Obes Metab. 2009;11:275–284 [DOI] [PubMed] [Google Scholar]
- 60. Canalis E, Mazziotti G, Giustina A, Bilezikian JP. Glucocorticoid-induced osteoporosis: pathophysiology and therapy. Osteoporos Int. 2007;18:1319–1328 [DOI] [PubMed] [Google Scholar]
- 61. Meunier P, Aaron J, Edouard C, Vignon G. Osteoporosis and the replacement of cell populations of the marrow by adipose tissue. A quantitative study of 84 iliac bone biopsies. Clin Orthop Relat Res. 1971;80:147–154 [DOI] [PubMed] [Google Scholar]
- 62. Justesen J, Stenderup K, Ebbesen EN, Mosekilde L, Steiniche T, Kassem M. Adipocyte tissue volume in bone marrow is increased with aging and in patients with osteoporosis. Biogerontology. 2001;2:165–171 [DOI] [PubMed] [Google Scholar]
- 63. Verma S, Rajaratnam JH, Denton J, Hoyland JA, Byers RJ. Adipocytic proportion of bone marrow is inversely related to bone formation in osteoporosis. J Clin Pathol. 2002;55:693–698 [DOI] [PMC free article] [PubMed] [Google Scholar]
- 64. Bredella MA, Fazeli PK, Miller KK, et al. Increased bone marrow fat in anorexia nervosa. J Clin Endocrinol Metab. 2009;94:2129–2136 [DOI] [PMC free article] [PubMed] [Google Scholar]
- 65. Schellinger D, Lin CS, Hatipoglu HG, Fertikh D. Potential value of vertebral proton MR spectroscopy in determining bone weakness. AJNR Am J Neuroradiol. 2001;22:1620–1627 [PMC free article] [PubMed] [Google Scholar]
- 66. Schellinger D, Lin CS, Lim J, Hatipoglu HG, Pezzullo JC, Singer AJ. Bone marrow fat and bone mineral density on proton MR spectroscopy and dual-energy X-ray absorptiometry: their ratio as a new indicator of bone weakening. AJR Am J Roentgenol. 2004;183:1761–1765 [DOI] [PubMed] [Google Scholar]
- 67. Thomas JD, Monson JP. Adult GH deficiency throughout lifetime. Eur J Endocrinol. 2009;161(suppl 1):S97–S106 [DOI] [PubMed] [Google Scholar]
- 68. Weaver JU, Monson JP, Noonan K, et al. The effect of low dose recombinant human growth hormone replacement on regional fat distribution, insulin sensitivity, and cardiovascular risk factors in hypopituitary adults. J Clin Endocrinol Metab. 1995;80:153–159 [DOI] [PubMed] [Google Scholar]
- 69. Goodpaster BH, Krishnaswami S, Resnick H, et al. Association between regional adipose tissue distribution and both type 2 diabetes and impaired glucose tolerance in elderly men and women. Diabetes Care. 2003;26:372–379 [DOI] [PubMed] [Google Scholar]
- 70. Miyawaki T, Abe M, Yahata K, Kajiyama N, Katsuma H, Saito N. Contribution of visceral fat accumulation to the risk factors for atherosclerosis in non-obese Japanese. Intern Med. 2004;43:1138–1144 [DOI] [PubMed] [Google Scholar]
- 71. Sironi AM, Gastaldelli A, Mari A, et al. Visceral fat in hypertension: influence on insulin resistance and β-cell function. Hypertension. 2004;44:127–133 [DOI] [PubMed] [Google Scholar]
- 72. Fox CS, Massaro JM, et al. Abdominal visceral and subcutaneous adipose tissue compartments: association with metabolic risk factors in the Framingham Heart Study. Circulation. 2007;116:39–48 [DOI] [PubMed] [Google Scholar]
- 73. Liu J, Fox CS, Hickson DA, et al. Impact of abdominal visceral and subcutaneous adipose tissue on cardiometabolic risk factors: the Jackson Heart Study. J Clin Endocrinol Metab. 2010;95:5419–5426 [DOI] [PMC free article] [PubMed] [Google Scholar]
- 74. Khosla S, Riggs BL, Atkinson EJ, et al. Effects of sex and age on bone microstructure at the ultradistal radius: a population-based noninvasive in vivo assessment. J Bone Miner Res. 2006;21:124–131 [DOI] [PMC free article] [PubMed] [Google Scholar]