Abstract
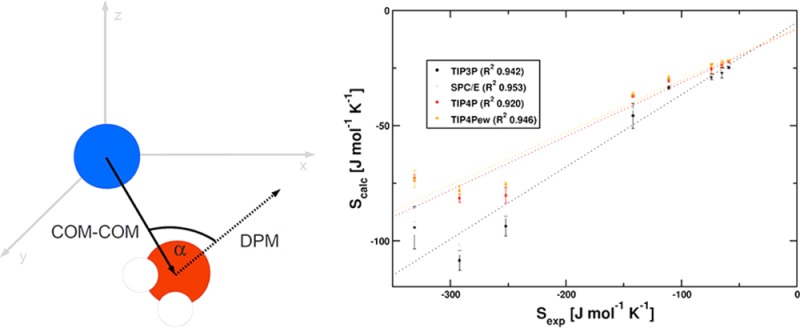
Entropy is an important energetic quantity determining the progression of chemical processes. We propose a new approach to obtain hydration entropy directly from probability density functions in state space. We demonstrate the validity of our approach for a series of cations in aqueous solution. Extensive validation of simulation results was performed. Our approach does not make prior assumptions about the shape of the potential energy landscape and is capable of calculating accurate hydration entropy values. Sampling times in the low nanosecond range are sufficient for the investigated ionic systems. Although the presented strategy is at the moment limited to systems for which a scalar order parameter can be derived, this is not a principal limitation of the method. The strategy presented is applicable to any chemical system where sufficient sampling of conformational space is accessible, for example, by computer simulations.
Introduction
Entropy calculation is a crucial topic in computational chemistry.1−3 The Gibbs free energy governing reactivity in chemical processes comprises enthalpic and entropic terms. Thus, an accurate estimation of changes in entropy facilitates the computational investigation of chemical processes significantly. Hydration entropy is of special interest in drug design applications.4−6 The association of a hydrated biomolecule and hydrated small molecules leads to displacement of surface-bound water molecules into the bulk.7,8 Therefore, calculating accurate reaction free energies for these displacement processes is based on understanding the individual hydration entropy contributions in the nonassociated state. The calculation of entropic changes is complicated by the fact that entropy contributions arise from the number of accessible states at a certain temperature and are therefore an ensemble property. Molecular dynamics (MD) simulations traverse these ensembles in a manner proportional to the energetically determined probability of the individual states. Hence, analyzing the distribution of states from a MD trajectory provides access to state probabilities.
Edholm et al.9 outlined how to split the system into discernible states and subsequently perform an integration procedure using histograms. Assuming converged sampling, one can calculate entropy S by assessing the probabilities for the states and integrating according to
| 1 |
The key problem with using histograms derived directly from simulation data is selecting the bin width of the histogram. Bin width determines the resolution of features, which can be detected. Hence, choosing a certain bin width will strongly influence the integral in eq 1. Therefore we propose in this work to employ a data-based automatic selection of a smoothing criterion via Kernel Density Estimation (KDE).
Several other methods exist to estimate entropy for samples from MD simulations. The most widely used approach is quasi-harmonic analysis. It is based on the assumption, that the system is in a temperature-dependent excited state around a local minimum.10−12 Quasi-harmonic entropy calculations are performed by diagonalizing the mass-weighted covariance matrix of the system’s degrees of freedom. Two main problems have been identified for this approach: Usually the harmonic approximation is not satisfied for low-frequency modes. This is addressed to some degree by including anharmonic correction terms.13 Furthermore, quasi-harmonic analysis is not suited to describe the influence of the solvent. Using permutation reduction in conjunction with quasi-harmonic calculations allows for the inclusion of solvent degrees of freedom from a certain number of solvent positions. This takes into account that the solvent molecules are interchangeable between themselves.14
Further approaches to calculate hydration entropy are to a large part based on decomposing the solvation process, which comprises cavity formation and subsequent solvent reorganization due to the electrostatic charge of the solute.15 An alternative approach includes the inhomogeneous solvation theory developed by Lazaridis et al.16,17 This approach provides an analytical value for simplified fluids. It is extensively applied using restrained biomolecular simulations within the “Watermap” package.6 Furthermore, entropy in the liquid state is described by weighted contributions from solid-like and gas-like states in a 2-phase thermodynamic model as proposed by Lin et al.18 Moreover, direct evaluation of the partition function from simulation trajectories has been proposed by Henchman et al.19,20 This overview is not comprehensive, but illustrates the complexity as well as the importance of the topic via the broadness of approaches followed.
In this study we investigate a series of cations as test systems to illustrate a novel approach to calculate hydration entropy from MD simulation trajectories. Monoatomic ions were chosen as a test set, because they exhibit several desirable properties. Their spherical symmetry enables us to choose a simple order parameter for the surrounding solvent molecules.21 We calculated the distributions of relative angular orientations of the dipole moment with respect to the gradient of the electrostatic potential of the central ion within concentric shells around the ion. This allowed us to represent the ordering influence of the ion within a scalar parameter. We chose to use the series of alkali ions and included Mg2+, Ca2+, and Mn2+ in the test set due to the availability of consistent force field parameters. Other bivalent cations were omitted, because no consistent parameters were available within the sets of Aqvist et al.22 and Bradbrook et al.23 for the AMBER simulation package.24 This allowed us to include a number of systems that differ in charge and have a different radius to hydration entropy ratio than the progressive series of monovalent cations.
Overall, we present a novel method for calculating hydration entropy from a discrete ensemble of states obtained by MD simulations on the nanosecond scale. Our approach is based on deriving a probability density function for a scalar parameter representing the system’s order by kernel density estimation. The density estimation procedure is nonparametric and based on iterative refinement through cross-validation.25 Therefore, it avoids prior assumptions about the system’s potential energy surface. This method allows us to calculate hydration entropy with a high degree of accuracy for a set of cations. Because of the modularity of our approach, it is readily extensible to more complex systems.
Methods
Simulations
MD simulations of Li+, Na+, K+, Rb+, Cs+, Mg2+, Mn2+ and Ca2+ were performed using the MPI implementation of “sander” from the AMBER 11 simulation package.24 Parameters for the ions were obtained by free energy perturbation calculations of Aqvist et al.22 and from a study of Bradbrook et al.23 (Mn2+, Ca2+). Several water models were used to perform the simulations in order to assess the influence of different water parameters. These models included the TIP3P26 and SPC/E27 3-point models as well as the TIP4P26 and TIP4Pew28 4-point models. A single ion was set up in the center of a cubic box and solvated with approximately 1000 water molecules using “leap” from the AMBER Tools package. This resulted in box dimensions of approximately 35 Å edge length. The system’s charge was neutralized by uniform plasma.
Initially, 1000 steps of steepest descent followed by 1000 steps of conjugate gradient minimization were performed. The nonbonded force cutoff was set to 8.0 Å. Long-range electrostatics were calculated using the Particle Mesh Ewald procedure.29 After minimization, an equilibration for 1 ns in the NPT ensemble was performed. Pressure was kept at 1.0 atm pressure by isotropic scaling using the weak coupling algorithm with a coupling frequency of 2.0 ps–1. Temperature was controlled at 300.0 K using Langevin dynamics30 with a collision frequency of 2.0 ps–1. The time step was set to 1 fs. Shake constraints were enabled for all bonds involving hydrogen. After initial equilibration, 5 ns of production simulations were obtained with the same simulation parameters; 50 000 frames at a time resolution of 0.1 ps were stored for analysis.
Analyses included calculation of density and radial distribution functions (RDF) for comparison with available literature data of QM/MM simulations.31−37 The measurements were performed using the “ptraj” program from the AMBER tools package. These metrics are used to demonstrate convergence and validity of the simulations.
Entropy Calculation
The entropy calculation procedure consists of three steps: An order parameter representing the change in structure is chosen. Subsequently, the system is split into volume elements for which the parameter is assumed to be constant. Finally, entropy for each volume element is evaluated by calculating the probability distribution of the order parameter within each volume element and subsequent summation over all elements normalized by occupancy.
First, dipole moment vectors for all waters were calculated by determining the vector from the center of mass of both hydrogen atoms to the oxygen position. The vector from the ionic center to the solvent molecule’s center of mass and the dipole moment of the water molecule enclose an angle α. The order parameter is depicted in Figure 1. It is expected that water molecules close to the ion exhibit a strong preferential orientation, whereas distant waters will not. A similar procedure was established by Lazaridis as a reference system for the treatment of hydrophobic hydration.21
Figure 1.
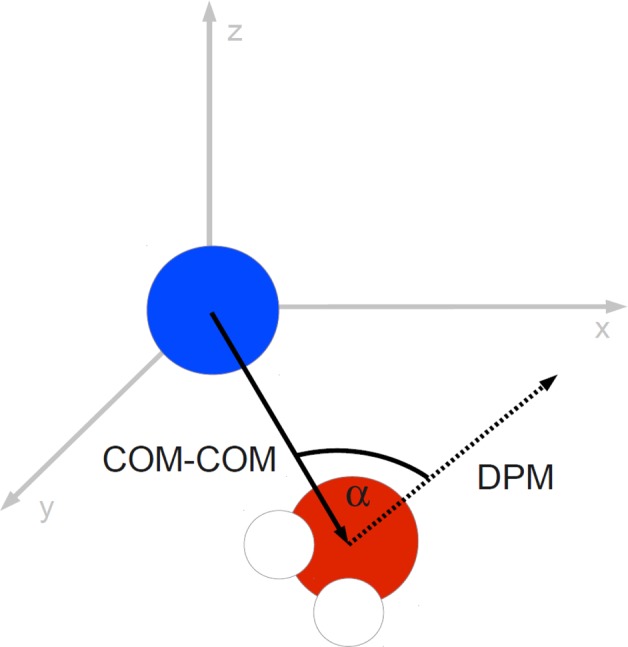
The chosen order parameter is used to describe the rotational alignment with the local electric field of the ion. The angle α between the dipole moment vector (DPM) of each water molecule within a shell volume and the corresponding vector of the ion’s center of mass (COM) to the water molecule’s center of mass is used to derive a distribution within each shell volume.
Second, the systems were split into concentric shell volumes of 0.1 Å thickness centered at the respective ion. As the subsequent density estimation procedure is based on cross-validation, a sufficient data basis has to be present to obtain reliable results. However, the inclusion of slices that are sparsely populated is not a problem, as their contributions to the total system entropy is almost negligible due to normalization by the occupancy of the slices (see Discussion).
Finally, based on the lists of relative orientation for each shell volume, nonparametric kernel density estimation was performed to obtain a continuous probability density distribution for the relative dipole orientations within each shell volume. Kernel density estimation is based on expansion of discrete data points by kernel functions of a specific broadness, the so-called bandwidth.38 The Gaussian kernel function K with the bandwidth parameter h around a data point χi is defined in eq 2.
| 2 |
Subsequent summation over all kernel-expanded points yields a continuous probability density function. It has been demonstrated, that the choice of kernel function is not relevant for the quality of the resulting probability density function.39 This quality solely depends on the choice of bandwidth parameter. Botev et al. developed the employed kernel density estimation procedure as a nonparametric density estimator based on Gaussian kernel functions designed to preserve rare events.40 It iteratively improves the bandwidth parameter of the kernel function by cross-validation. Computing eq 3 calculates the kernel density estimate P(x) of a set of observations χ.
| 3 |
The resulting probability distributions were normalized by 1/sin(x) to account for Haar’s measure,41 to correct for a geometric preference of π/2 angles for the chosen measure of order. Integration of this probability density function according to eq 1 yields an entropy contribution for each shell volume. To obtain hydration entropy for the whole system, each shell volume was multiplied by the occupancy calculated from the RDF times the respective shell volume. This normalization ensures that the contributions are weighted by the respective number of particles. Summation over the occupancy-normalized entropy contributions yields the hydration entropy of the total system.
Results
For each of the eight systems (Li+, Na+, K+, Rb+, Cs+, Mg2+, Ca2+, and Mn2+) 5 ns of simulation trajectories with 50 000 frames each at 0.1 ps intervals were stored for analysis. These trajectories were centered on the ion and imaged to the (0,0,0) simulation box. Each trajectory was split into five sequential parts of 1 ns each for all subsequent analyses. Splitting was performed to demonstrate convergence and to calculate a statistical error estimate.
Reference data for this study consist in experimentally obtained values for the hydration entropies of the above-mentioned ions. These measurements have been carried out by a variety of methods, for example, by Peschke et al.42 or Noyes.43 Reference parameters of Marcus44 were used as they were consistently available for all systems.
Validation
All simulations were validated in respect to densities and solute–solvent RDFs. Densities are converged at approximately 1.0 g/mL with a root-mean-square fluctuation below 0.0060 g/mL indicating that temperature and pressure were properly equilibrated within 1 ns. RDF plots depicting the metal (M)–solvent oxygen (O) distribution function g(M–O) of all simulations are given in the Supporting Information.
Probability Distributions
For all systems derived distribution functions of angular orientations show distinct maxima at an angle of 0 for the inner shells. For the outer shells, the distributions are almost uniform and without discernible maxima. Increases at the edges are normalization artifacts due to dividing by sin(x). The general shape of these distributions can be seen in Figure 2. A sharp maximum around 0 is present within the inner hydration shell at 2.4 Å of the Na+ system. At 15.0 Å no preferential orientation is discernible. The nonzero entropy contributions in the outer shells depicted in Figure 3 result from small deviations from the equal distribution for bulk water. All per-water contributions are available in the Supporting Information.
Figure 2.
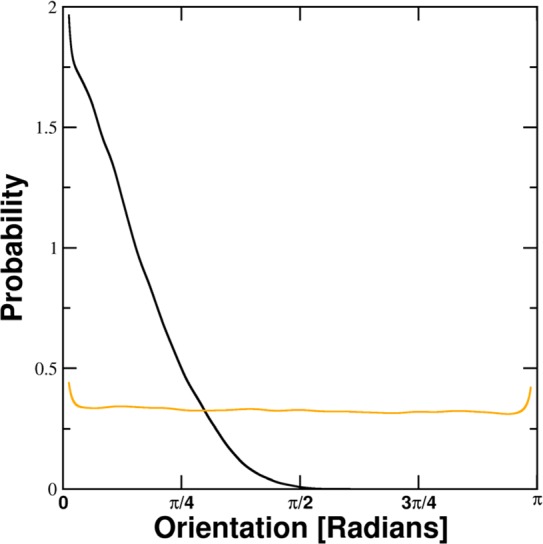
Shape of obtained probability distributions after 1/sin(x) normalization. The black line is the calculated probability distribution of the dipole moment angle relative to the electrostatic potential gradient of the ion within the 2.4–2.5 Å shell around Na+. It exhibits a sharp maximum at 0. The orange line depicts the distribution of dipole orientations of the same system within the 15.0–15.1 Å shell. Except for small normalization artifacts at the edges, the distribution is almost uniform.
Figure 3.
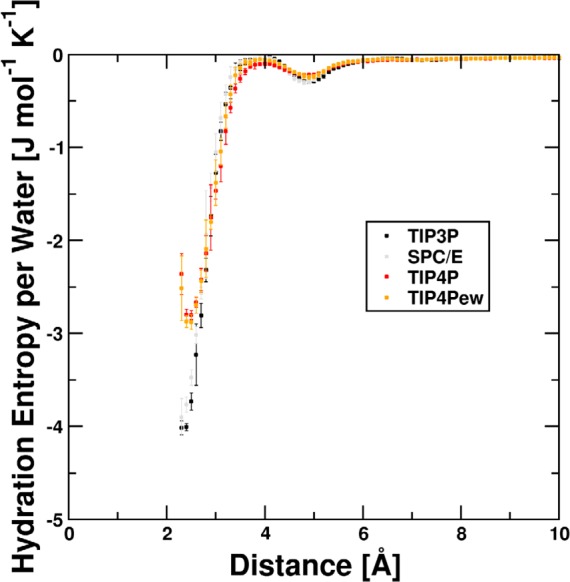
Per-water contributions to hydration entropy for Na+ for different water models. Ordered regions coincide with the hydration shells at 2.4 Å and 4.8 Å, respectively. The transition region between these shells shows almost bulk-like ordering. The statistical uncertainty in the innermost shells is significantly larger than in the outer regions as the occupancy is smaller. Subsequently, volume-normalized integration is performed.
Entropy
Integration of probability distributions according to eq 1 yields the entropy contribution per water molecule for each shell volume. Exemplary, the per-water entropy for each shell versus the distance for Na+ is depicted in Figure 3. Corresponding plots for all other systems can be found in the Supporting Information.
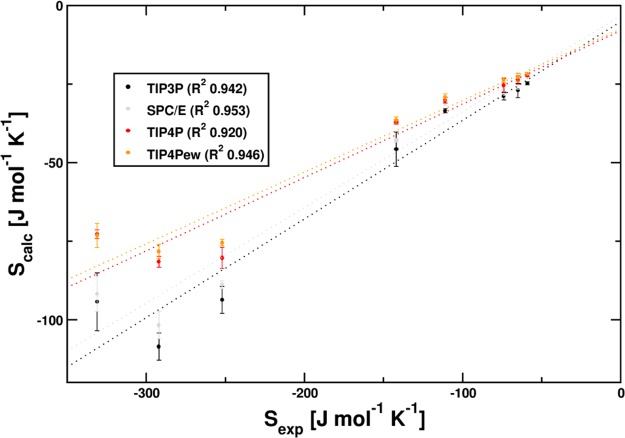
Integration of the normalized probability density functions yields per-shell hydration entropy for each system in J mol–1 K–1. These parts were used as a basis for determining the statistical error. Reference values from Marcus44 and computational results of this study are depicted in Table 1. Graphs of calculated versus experimental hydration entropy for the different water models are given in Figure 4. Linear fit parameters are given in Table 2. Predictions of hydration entropy resulting from these regression models are given in Table 3.
Table 1. Experimental versus Calculated Hydration Entropy. Experimental Values Are Taken from Marcus.44 All values Are Given in J mol–1 K–1.
| Li+ | Na+ | K+ | Rb+ | Cs+ | Mg2+ | Mn2+ | Ca2+ | |
|---|---|---|---|---|---|---|---|---|
| exp | –142 | –111 | –74 | –65 | –59 | –331 | –292 | –252 |
| TIP3P | –45.7 | –33.5 | –28.9 | –27.0 | –24.8 | –94.3 | –108 | –93.7 |
| SPC/E | –42.9 | –31.0 | –27.0 | –24.1 | –22.5 | –91.8 | –102 | –88.9 |
| TIP4P | –37.2 | –30.2 | –25.4 | –23.7 | –22.2 | –72.8 | –81.5 | –80.3 |
| TIP4Pew | –36.5 | –29.2 | –23.8 | –22.9 | –21.8 | –73.2 | –78.3 | –75.5 |
Figure 4.
Comparison of calculated vs experimental hydration entropy for different water models. Calculated results amount to one-third of experimentally determined values. Although the water model affects the slope, relative distances are well preserved. (left to right: Mg2+, Mn2+, Ca2+, Li+, Na+, K+, Rb+, Cs+) The squared correlation coefficients R2 of linear fits to experimental hydration entropy values of Marcus are calculated to be between 0.92 and 0.95 for all water models. Correlation of experimentally obtained values and calculated results is depicted in Figure 4.
Table 2. Regression Parameters. Linear Regression Parameters and Correlation Coefficients for the Fit of Experimental versus Calculated Hydration Entropy for the Individual Water Modelsa.
| water model | intercept | slope | R2 |
|---|---|---|---|
| TIP3P | –5.0 (6.1) | 0.31 (0.03) | 0.942 |
| SPC/E | –3.3 (5.0) | 0.30 (0.03) | 0.953 |
| TIP4P | –8.0 (5.5) | 0.23 (0.03) | 0.920 |
| TIP4Pew | –7.3 (4.3) | 0.23 (0.02) | 0.946 |
Intercepts are given in J mol–1 K–1. Standard errors of the fit parameters where obtained by error propagation of the data point errors and are given in parentheses.
Table 3. Predictions of Hydration Entropy for all Solutesa.
| model | Li+ | Na+ | K+ | Rb+ | Cs+ | Mg2+ | Mn2+ | Ca2+ |
|---|---|---|---|---|---|---|---|---|
| exp | –142 | –111 | –74 | –65 | –59 | –331 | –292 | –252 |
| TIP3P | –142 | –103 | –88 | –82 | –75 | –299 | –343 | –297 |
| SPC/E | –140 | –100 | –87 | –77 | –72 | –303 | –337 | –293 |
| TIP4P | –154 | –123 | –102 | –95 | –89 | –309 | –346 | –341 |
| TIP4Pew | –151 | –120 | –96 | –92 | –87 | –311 | –333 | –321 |
Based on the regression models derived for all water models, predictions of hydration entropy for the individual ionic solutes are given. All values are given in J mol–1 K–1.
Discussion
Within this study we introduced a new method to calculate hydration entropy from state space probability distributions. This method does not rely on any prior assumptions about the shape of the free energy landscape and can be applied to solvent degrees of freedom as well as to internal molecular coordinates. Though using a one-dimensional parameter to reflect the change in ordering in the system cannot capture the entirety of the change in entropy, it has been demonstrated that the resulting change in entropy is directly proportional to experimentally observed values for hydration entropy. The slopes for the regression calculations to experimental values indicate that the dipole ordering accounts for around 0.23 to 0.3 of the total change in entropy of the systems. One needs to consider at this point, that the chosen parameter of order completely neglects any translational restrictions and all many-body effects created by the formation of structured hydration shells. Furthermore, the mapping of system ordering onto a one-dimensional parameter from three rotational degrees of freedom is consistent with calculated entropy being approximately 1/3 of experimental values. The intercepts of all calculated linear fits lie within 1.5σ of 0, which indicates that the bulk value (apart from numerical noise related to the 1/sin(x) normalization) is captured correctly.
Water Models
The observed solvent structure within MD simulations crucially depends on the choice of solvent model. We investigated the effect of different water models by performing identical calculations on trajectories obtained with TIP3P, SPC/E, TIP4P, and TIP4Pew models. No marked differences within the simulation behavior (e.g., density, solute–solvent RDF) could be identified. However, the 3-point water models TIP3P and SPC/E are susceptible to a more pronounced charge-induced ordering than their 4-point counterparts TIP4P and TIP4Pew. This phenomenon is documented in literature, for example, by Henchman.19 However, the relative position of resulting calculated hydration entropy data is almost identical. Hence, squared correlation coefficients are almost identical between the sets (0.942, 0.953, 0.920, and 0.946). Although this changes the total values obtained for the hydration entropy, it does not affect the quality of the overall correlation. This suggests, that even if absolute hydration entropy remains difficult to obtain, the quantitative differences between the investigated systems are correctly reflected in the results.
Density Estimation
To demonstrate the validity of the parameter-free density estimation procedure, several data sets from this work were selected. Subsequently, entropy calculations were performed on subsets of an initial sample by randomly selecting approximately 0.5, 1, 5, 10, and 50% of data points. Several examples of this variability are shown in Figure 5. We postulate that above a lower limit of approximately 500 data points, our density estimation procedure yields a reliable estimate of the underlying probability density functions. We further show that the procedure is indeed parameter-free, as the probability density functions converge against a common target distribution even if parts of the data are omitted for validation purposes. This indicates the numerical robustness of our approach.
Figure 5.
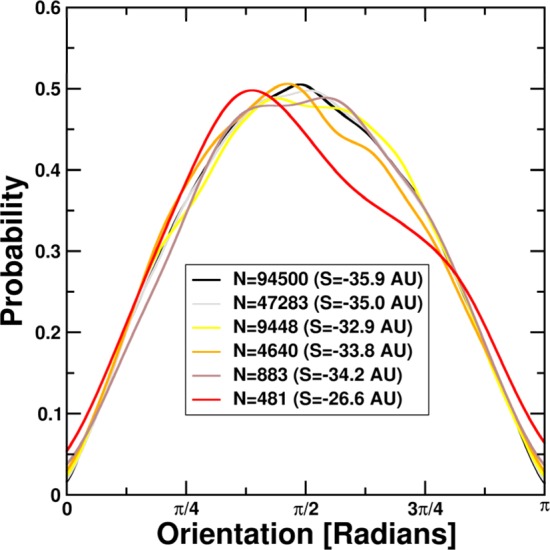
Dependence of calculated entropy on the number of data points. All entropy values are given in arbitrary units (AU). Starting from a representative test set from our simulations, we select random points, retaining approximately 0.5, 1, 5, 10 and 50% of the original 94500 data points. We observe a significant deviation from the expected sine-like distribution only at the 0.5% level.
General Applicability
With the presented methodology we provide an approach to entropy calculation, which does not require an assumption of harmonic potential energy surfaces. Furthermore, the density estimation procedure allows generation of a nonparametric estimate of state space probability density functions from a limited amount of state space samples. It should be noted that the proposed procedure in its presented form is applicable only to systems wherein the ordering can be expressed within a one-dimensional parameter, which is the case for the spherically symmetric potential of the ions within this study. This limitation originates from the density estimation procedure used in this study. Using multidimensional density estimation, one can extend the approach to more complex systems. However, the density estimation procedure is the computationally most demanding part of these calculations besides the MD simulations. The computational complexity of the parameter derivation scales with the square of the dimensions. This scaling results from the extensive cross-validation calculations involved in fitting the kernel parameters.
Conclusions
In this paper we presented a novel approach to calculate changes in entropy from MD simulation trajectories. Derived entropy values show an excellent correlation with experimentally determined values. However, calculated absolute hydration entropy values deviate from the experimentally obtained values, which can be attributed to the mapping of all change in ordering to a single one-dimensional parameter. Extending the density estimation procedure to higher dimensions will allow for the inclusion of many-body effects relevant to entropy of the entire system.
From the presented data we conclude that the chosen simulation parameters represent the systems well. The radial distribution functions and the localization of ordering effects of the ions behave as expected. The presented density estimation procedure reliably calculates probability density functions even with limited data sets. This convergence property has been demonstrated analytically by Botev et al.45
Differences in hydration entropy can be reproduced quantitatively with high fidelity. Generally, the approach allows quantifying entropy differences for systems, where the state change can be mapped to a limited set of relevant dimensions. Possible extensions for this method are the study of biomolecular hydration and entropy contributions from internal degrees of freedom.
Acknowledgments
This work was supported by the Austrian Ministry of Science (BMWF) as part of the University Infrastructure Program for the research platform Scientific Computing at LFU Innsbruck. This work was funded in part by the Austrian Science Fund (FWF Grant P23051). This work was supported by a Young Scientist grant of LFU Innsbruck to R.G.H. R.G.H. is a recipient of the DOC Fellowship of the Austrian Academy of Sciences at the Institute of General, Inorganic and Theoretical Chemistry.
Glossary
Abbreviations
- MD
molecular dynamics
- RDF
radial distribution function
- QM/MM
quantum mechanics/molecular mechanics
- AU
arbitrary unit
Supporting Information Available
Radial distribution functions for all simulations; distance-dependent entropy contributions for all systems. This material is available free of charge via the Internet at http://pubs.acs.org.
Author Present Address
§ Laboratory of Physical Chemistry, ETH Hoenggerberg, Wolfgang-Pauli-Strasse 10, CH-8093 Zurich, Switzerland.
The authors declare no competing financial interest.
Supplementary Material
References
- Gilson M. K.; Given J. A.; Bush B. L.; McCammon J. A. The Statistical-Thermodynamic Basis for Computation of Binding Affinities: A Critical Review. Biophys. J. 1997, 72, 1047–1069. [DOI] [PMC free article] [PubMed] [Google Scholar]
- Gilson M. K.; Zhou H.-X. Calculation of Protein-Ligand Binding Affinities. Annu. Rev. Biophys. Biomol. Struct. 2007, 36, 21–42. [DOI] [PubMed] [Google Scholar]
- Li Z.; Lazaridis T. Water at Biomolecular Binding Interfaces. Phys. Chem. Chem. Phys. 2007, 9, 573–581. [DOI] [PubMed] [Google Scholar]
- Freire E. A Thermodynamic Approach to the Affinity Optimization of Drug Candidates. Chem. Biol. Drug Des. 2009, 74, 468–472. [DOI] [PMC free article] [PubMed] [Google Scholar]
- Schoen A.; Lam S. Y.; Freire E. Thermodynamics-Based Drug Design: Strategies for Inhibiting Protein–Protein Interactions. Future Med. Chem. 2011, 3, 1129–1137. [DOI] [PMC free article] [PubMed] [Google Scholar]
- Abel R.; Young T.; Farid R.; Berne B. J.; Friesner R. A. Role of the Active-Site Solvent in the Thermodynamics of Factor Xa Ligand Binding. J. Am. Chem. Soc. 2008, 130, 2817–2831. [DOI] [PMC free article] [PubMed] [Google Scholar]
- Wang L.; Berne B. J.; Friesner R. A. Ligand Binding to Protein-Binding Pockets with Wet and Dry Regions. Proc. Natl. Acad. Sci. U. S. A. 2011, 108, 1326–1330. [DOI] [PMC free article] [PubMed] [Google Scholar]
- Irudayam S. J.; Henchman R. H. Entropic Cost of Protein-Ligand Binding and Its Dependence on the Entropy in Solution. J. Phys. Chem. B 2009, 113, 5871–5884. [DOI] [PubMed] [Google Scholar]
- Dinola A.; Berendsen H.; Edholm O. Free-Energy Determination of Polypeptide Conformations Generated by Molecular Dynamics. Macromolecules 1984, 17, 2044–2050. [Google Scholar]
- Karplus M.; Kushick J. Method for Estimating the Configurational Entropy of Macromolecules. Macromolecules 1981, 14, 325–332. [Google Scholar]
- Ichiye T.; Karplus M. Collective Motions in Proteins—A Covariance Analysis of Atomic Fluctuations in Molecular Dynamics and Normal Mode Simulations. Proteins 1991, 11, 205–217. [DOI] [PubMed] [Google Scholar]
- Brooks B.; Janezic D.; Karplus M. Harmonic Analysis of Large Systems—1. Methodology. J. Comput. Chem. 1995, 16, 1522–1542. [Google Scholar]
- Janezic D.; Venable R. M.; Brooks B. R. Harmonic Analysis of Large Systems—3. Comparison with Molecular Dynamics. J. Comput. Chem. 1995, 16, 1554–1566. [Google Scholar]
- Reinhard F.; Grubmueller H.. Estimation of Absolute Solvent and Solvation Shell Entropies via Permutation Reduction. J. Chem. Phys. 2007, 126. [DOI] [PubMed] [Google Scholar]
- Graziano G. Hydration Entropy of Polar, Nonpolar and Charged Species. Chem. Phys. Lett. 2009, 479, 56–59. [Google Scholar]
- Lazaridis T. Inhomogeneous Fluid Approach to Solvation Thermodynamics. 1. Theory. J. Phys. Chem. B 1998, 102, 3531–3541. [Google Scholar]
- Lazaridis T. Inhomogeneous Fluid Approach to Solvation Thermodynamics. 2. Application to Simple Fluids. J. Phys. Chem. B 1998, 102, 3542–3550. [Google Scholar]
- Lin S.-T.; Maiti P. K.; Goddard W. A. Two-Phase Therodynamic Model for Efficient and Accurate Absolute Entropy of Water from Molecular Dynamics Simulations. J. Phys. Chem. B 2010, 114, 8191–8198. [DOI] [PubMed] [Google Scholar]
- Henchman R. H. Free Energy of Liquid Water from a Computer Simulation via Cell Theory. J. Chem. Phys. 2007, 126, 064504. [DOI] [PubMed] [Google Scholar]
- Klefas-Stennett M.; Henchman R. H. Classical and Quantum Gibbs Free Energies and Phase Behavior of Water Using Simulation and Cell Theory. J. Phys. Chem. B 2008, 112, 9769–9776. [DOI] [PubMed] [Google Scholar]
- Lazaridis T. Solvent Reorganization Energy and Entropy in Hydrophobic Hydration. J. Phys. Chem. B 2000, 104, 4964–4979. [Google Scholar]
- Aqvist J. Ion Water Interaction Potentials Derived from Free Energy Perturbation Simulations. J. Phys. Chem. 1990, 94, 8021–8024. [Google Scholar]
- Bradbrook G. M.; Gleichmann T.; Harrop S. J.; Habash J.; Raftery J.; Kalb J.; Yariv J.; Hillier J. H.; Helliwell J. R. X-ray and Molecular Dynamics Studies of Concanavalin—A Glucoside and Mannoside Complexes—Relating Structure to Thermodynamics of Binding. J. Chem. Soc., Faraday Trans. 1998, 94, 1603–1611. [Google Scholar]
- Case D. A.; Cheatham T. E.; Darden T.; Gohlke H.; Luo R.; Merz K. M.; Onufriev A.; Simmerling C.; Wang B.; Woods R. J. The Amber Biomolecular Simulation Programs. J. Comput. Chem. 2005, 26, 1668–1688. [DOI] [PMC free article] [PubMed] [Google Scholar]
- Botev Z. I.; Kroese D. P. An Efficient Algorithm for Rare-Event Probability Estimation, Combinatorial Optimization and Counting. Methodol. Comput. Appl. Probab. 2008, 10, 471–505. [Google Scholar]
- Mahoney M. W.; Jorgensen W. L. A Five-Site Model for Liquid Water and the Reproduction of the Density Anomaly by Rigid Nonpolarizable Potential Functions. J. Chem. Phys. 2000, 112, 8910–8922. [Google Scholar]
- Kusalik P. G.; Svishchev I. M. The Spatial Structure in Liquid Water. Science 1994, 265, 1219–1221. [DOI] [PubMed] [Google Scholar]
- Horn H. W.; Swope W. C.; Pitera J. W.; Madura J. D.; Dick T. J.; Hura G. L.; Head-Gordon T. Development of an Improved Four-Site Water Model for Biomolecular Simulations: TIP4P-Ew. J. Chem. Phys. 2004, 120, 9665–9678. [DOI] [PubMed] [Google Scholar]
- Darden T.; York D.; Pedersen L. Particle Mesh Ewald—An n log(n) Method for Ewald Sums in Large Systems. J. Chem. Phys. 1993, 98, 10089–10092. [Google Scholar]
- Feller S.; Zhang Y.; Pastor R.; Brooks B. Constant-Pressure Molecular Dynamics Simulation—The Langevin Piston Method. J. Chem. Phys. 1995, 103, 4613–4621. [Google Scholar]
- Loeffler H. H.; Rode B. M. The Hydration Structure of the Lithium Ion. J. Chem. Phys. 2002, 117, 110–117. [Google Scholar]
- Tongraar A.; Liedl K. R.; Rode B. M. The Hydration Shell Structure of Li+ Investigated by Born-Oppenheimer Ab Initio QM/MM Dynamics. Chem. Phys. Lett. 1998, 286, 56–64. [Google Scholar]
- Azam S. S.; Hofer T. S.; Randolf B. R.; Rode B. M. Hydration of Sodium(I) and Potassium(I) Revisited: A Comparative QM/MM and QMCF MD Simulation Study of Weakly Hydrated Ions. J. Phys. Chem. A 2009, 113, 1827–1834. [DOI] [PubMed] [Google Scholar]
- Tongraar A.; Liedl K. R.; Rode B. M. Born-Oppenheimer Ab Initio QM/MM dynamics Simulations of Na+ and K+ in Water: From Structure Making to Structure Breaking Effects. J. Phys. Chem. A 1998, 102, 10340–10347. [Google Scholar]
- Hofer T. S.; Randolf B. R.; Rode B. M. Structure-Breaking Effects of Solvated Rb(I) in Dilute Aqueous Solution—An Ab Initio QM/MM MD Approach. J. Comput. Chem. 2005, 26, 949–956. [DOI] [PubMed] [Google Scholar]
- Schwenk C. F.; Hofer T. S.; Rode B. M. Structure Breaking Effect of Hydrated Cs+. J. Phys. Chem. A 2004, 108, 1509–1514. [Google Scholar]
- Tongraar A.; Rode B. M. Structural Arrangement and Dynamics of the Hydrated Mg2+: An Ab Initio QM/MM Molecular Dynamics Simulation. Chem. Phys. Lett. 2005, 409, 304–309. [Google Scholar]
- Sheather S. J.; Jones M. C. A Reliable Data-Based Bandwidth Selection Method for Kernel Density Estimation. J. R. Stat. Soc. Methods B 1991, 53, 683–690. [Google Scholar]
- Bowman A W. A Comparative Study of Some Kernel-Based Nonparametric Density Estimators. J. Stat. Comput. Simul. 1985, 21, 313–327. [Google Scholar]
- Botev Z. I.; Grotowski J. F.; Kroese D. P. Kernel Density Estimation via Diffusion. Ann. Stat. 2010, 38, 2916–2957. [Google Scholar]
- Haar A. Der Massbegriff in der Theorie der Kontinuierlichen Gruppen. Ann. Math. 1933, 34, 147–169. [Google Scholar]
- Peschke M.; Blades A. T.; Kebarle P. Hydration Energies and Entropies for Mg2+, Ca2+, Sr2+ and Ba2+ from Gas-Phase Ion-Water Molecule Equilibria Determinations. J. Phys. Chem. A 1998, 102, 9978–9985. [Google Scholar]
- Noyes R. Thermodynamics of Ion Hydration as a Measure of Effective Dielectric Properties of Water. J. Am. Chem. Soc. 1962, 84, 513. [Google Scholar]
- Marcus Y. Thermodynamic Functions of Transfer of Singe Ions from Water to Nonaqueous and Mixed Solvents. 2. Enthalpies and Entropies of Transfer to Nonaqueous Solvents. Pure Appl. Chem. 1985, 57, 1103–1128. [Google Scholar]
- Botev Z. I.; Kroese D. P.; Taimre T. Generalized Cross-Entropy Methods with Applications to Rare-Event Simulation and Optimization. Simul.-Trans. Soc. Model. Simul. Int. 2007, 83, 785–806. [Google Scholar]
Associated Data
This section collects any data citations, data availability statements, or supplementary materials included in this article.


