

Abstract
Breast cancer tissue contains a small population of cells that have the ability to self-renew; these cells are known as cancer stem-like cells (CSCs). We have recently shown that autophagy is essential for the tumorigenicity of these CSCs. Salinomycin (Sal), a K+/H+ ionophore, has recently been shown to be at least 100 times more effective than paclitaxel in reducing the proportion of breast CSCs. However, its mechanisms of action are still unclear. We show here that Sal blocked both autophagy flux and lysosomal proteolytic activity in both CSCs and non-CSCs derived from breast cancer cells. GFP-LC3 staining combined with fluorescent dextran uptake and LysoTracker-Red staining showed that autophagosome/lysosome fusion was not altered by Sal treatment. Acridine orange staining provided evidence that lysosomes display the characteristics of acidic compartments in Sal-treated cells. However, tandem mCherry-GFP-LC3 assay indicated that the degradation of mCherry-GFP-LC3 is blocked by Sal. Furthermore, the protein degradation activity of lysosomes was inhibited, as demonstrated by the rate of long-lived protein degradation, DQ-BSA assay and measurement of cathepsin activity. Our data indicated that Sal has a relatively greater suppressant effect on autophagic flux in the ALDH+ population in HMLER cells than in the ALDH− population; moreover, this differential effect on autophagic flux correlated with an increase in apoptosis in the ALDH+ population. ATG7 depletion accelerated the proapoptotic capacity of Sal in the ALDH+ population. Our findings provide new insights into how the autophagy-lysosomal pathway contributes to the ability of Sal to target CSCs in vitro.
Keywords: breast cancer stem-like/progenitor cell, salinomycin, autophagy, cell death, lysosome
Introduction
Cancer stem cells are a new target for drug discovery in cancer. The theory of cancer stem-like cells (CSCs) attempts to explain how cancer is initiated and how it recurs after treatment. The hypothesis postulates that tumors are organized in a cellular hierarchy that is maintained by a subpopulation of tumor cells endowed with self-renewal and multilineage differentiation capacities.1 CSCs have been identified in many different types of tumor, including breast cancer.2-5 In breast cancer, a population of CD44high/CD24−/low /EPCAM+ has been identified as being breast CSCs. As markers CD44, CD24 and EPCAM molecules were used to isolate progenitor/CSCs cells. A high level of aldehyde dehydrogenase 1 (ALDH1) activity is an alternative candidate marker of progenitor /stem cell.6,7 Other key features of CSCs include the fact that they form tumor spheres in low-adherence cultures in serum-free medium, their high tumorigenicity and their multidrug resistance.8-10 Eradication of the CSC population is a major clinical goal of cancer therapy.
It has recently been demonstrated that salinomycin (Sal), an antibiotic currently used in veterinary medicine, reduces the proportion of breast CSCs at least 100 times more efficiently than paclitaxel, a chemotherapeutic drug commonly used in breast cancer. Treating mice with Sal results in increased epithelial differentiation of the tumor cells and inhibits mammary tumor growth.11
Despite its toxicity, Sal is currently considered to be potentially promising for the eradication of CSCs. Sal is a monocarboxylic polyether antibiotic already used as an antibacterial and anticoccidiosis drug.12,13 Sal acts as an ionophore,14 and promotes the transfer of cations across biological membranes via an exchange diffusion mechanism. As a result of this cation exchange, transmembrane gradients are altered, which in turn leads to changes in cell function and metabolism. A recent study has shown that Sal functions as an efflux pump p-glycoprotein inhibitor in overcoming drug resistance in various human cancer cell lines.15-18 Sal may also sensitize cancer cells to radiation or to cytostatic drugs, such as etoposide or doxorubicin, by increasing apoptosis as a result of enhancing DNA damage and reducing the levels of CDKN1A/p21 protein.19-21 Evidence is emerging that Sal inhibits WNT-CTNNB1/β-catenin signaling by inducing WNT coreceptor lipoprotein receptor related protein 6 (LRP6) degradation.22,23 In addition, Sal leads to an increase of cytosolic Ca2+ through the Na+/Ca2+ exchangers in the plasma membrane and mitochondria, and induces calpain and cytochrome c-mediated neuronal cell death.24
The studies referred to above all focused on apoptosis, because this process is the essential mechanism by which anticancer drugs kill tumor cells. Macroautophagy (referred as “autophagy” below) has recently emerged as an essential regulator of cell death pathways.25-28 Autophagy is a vacuolar, lysosomal degradation pathway in which the cell “self-digests” its intracellular materials, and recycles its cytoplasmic constituents.29 Basal autophagy is a homeostatic process that prevents the accumulation of damaged proteins and organelles; it reduces ER stress, and limits the production of reactive oxygen species (ROS). In response to stressful conditions, autophagy is stimulated to provide the cell with nutrients and energy that it needs to survive.30 In addition to the basal form of autophagy, there is also a selective form of autophagy, which is mediated by autophagy receptors such as SQSTM1 and ensures that ubiquitinated structures including toxic, aggregation-prone proteins, damaged organelles and invading microorganisms are eliminated.31
Autophagy is governed by the coordinated action of various autophagy-related (ATG) proteins to form a double-membrane bound vacuole known as the autophagosome, from the phagophore assembly site (PAS). Through a process of maturation and fusion, the autophagosome matures by fusing with the endocytic compartments (e.g., early and late endosomes, multivesicular bodies) before fusing with the lysosomal compartment, and finally forms the autolysosome in which cargo degradation and recycling occur to maintain cell metabolism.26,32
The ULK1 complex, and the phosphatidylinositol 3-kinase complex, which includes a set of ATG proteins, assemble at the PAS to initiate autophagy via an initial membrane nucleation step.33 Two ubiquitin-like conjugation systems that form ATG12–ATG5-ATG16L1 and phosphatidylethanolamine (PE)-conjugated LC3/MAP1LC3B, (LC3-II), respectively, are necessary for the elongation of PAS to occur.34,35 MTORC1 (the mechanistic target of rapamycin complex 1) has been identified as being a major checkpoint. Inhibition of MTORC1 induces autophagy.25
Besides its function in cell survival, autophagy also plays an essential role in determining how tumor cells respond to therapy, and to changing environmental stimuli.36,37 Anticancer strategies currently in use induce autophagy in tumor cells that have been exposed to chemotherapy with agents such as arsenic trioxide, etoposide, histone deacetylase inhibitors, rapamycin, temozolomide, tamoxifen, and vitamin D analogs38 or radiation.39 Furthermore, numerous findings have demonstrated that autophagy and apoptosis share common stimuli and constituents.40-44
We report here for the first time that Sal inhibits the autophagic flux in cancer cells by inhibiting the lysosomal activity of cathepsins without altering the integrity of the lysosomal compartment. Notably, we demonstrate that suppressing autophagy by using RNA interference to knock down the expression of ATG7, an essential autophagy protein, significantly inhibits proliferation and enhances apoptotic cell death induced by Sal. The current study is consistent with the fact that Sal specifically targets the apoptotic cell death of ALDH+ cancer subpopulation, which is more susceptible to Sal-mediated inhibition of autophagic flux.
Results
Sal treatment inhibits autophagic flux
To elucidate the effect of Sal on autophagic capacity of breast cancer cell lines and CSCs/progenitor cells, we used several breast cancer cell lines, including MCF-7, HMLER and HMLER CD24low/−. MCF-7 cell lines, trigger autophagy in response to cancer treatment.43 Whereas the HMLER cell line has the epithelial phenotype, HMLER CD24low/− has the mesenchymal phenotype as an intrinsic feature, and displays high levels of the ‘stemness’ phenotype.45 We first characterized the sensitivity of these various breast cancer cell lines to Sal by MTS reduction assays (Fig. S1A). As expected, MCF-7 and HMLER were slightly sensitive to Sal, whereas HMLER CD24low/− cells exhibited substantial dose- and time-dependent sensitivity to Sal.
We next examined the capacity of Sal to modulate autophagy in these cell lines. We therefore examined the accumulation of LC3-II; because of its expression level was correlated with the number of autophagosomes. Sal induced dose- and time-dependent accumulation of the LC3-II form in various breast cancer cell lines (Fig. 1A). Enhanced LC3-II levels can be associated either with increased autophagosome synthesis or with decreased autophagosome turnover, as a result of delayed trafficking to the lysosomes, decreased fusion between compartments, or defective lysosomal proteolytic activity. In order to obtain a better evaluation of autophagic flux, it is now usual to carry out western blotting of control extracts harvested from cells treated with autophagy inhibitors, such as bafilomycin A1 (Baf), a specific vacuolar type H+-ATPase inhibitor.46 Sal-induced accumulation of LC3-II was not enhanced in the presence of Baf; supporting the idea that Sal inhibits degradation of the autophagic contents.

Figure 1. Sal inhibits autophagy flux. (A) Immunoblot analysis of LC3-I and LC3-II levels in HMLER, HMLER-CD24Low/− and MCF7 cell lines treated with the concentrations of Sal indicated for the times described. (B) Autophagic flux. Immunoblot analysis of LC3-I, LC3-II and SQSTM1 levels in HMLER, HMLER- CD24Low/− and MCF7 cell lines incubated in full medium or with 2 μM Sal or EBSS for 4 h in the presence or absence of Baf (final concentration: 100 nM). Actin (ACTB) immunoblotting was used as a loading control. As indicated below each lane, the SQSTM1/ACTB and LC3-II/ACTB ratios were determined using the Bio1D software. The autophagic flux determined as the ratio between the LC3-II and SQSTM1 levels with Baf and without Baf is expressed in arbitrary units. (C) Left, MCF-7-GFP-LC3 mammospheres were incubated in full medium or with 2 μM Sal or EBSS for 4 h in the presence or absence of Baf (final concentration: 100 nM) for 2 h, fixed, and then visualized by confocal microscopy. Scale bar: 15 μm. Right, the number of GFP-LC3 dots was scored on ~50 to 100 cells. The data are presented as means SD from 3 independent experiments, and analyzed using Student’s t-test (*p < 0.05, **p < 0.01 ***p < 0.001,). (D) Left, HMLER, HMLER-CD24Low/−, and MCF7 cell lines were transfected with the tandem mRFP-GFP-LC3 plasmids. Twenty-four hours after the transfection the cells were either treated with 2 μm Sal or starved in EBSS for 4 h. Cells were then fixed and subjected to confocal microscopy. Scale bar: 10 μm. Right, the numbers of yellow LC3 dots and red LC3 dots per cell in each condition were quantified. More than 30 cells were counted in each of the conditions, and the data (mean ± SD) are representative of two independent experiments.
We then investigated the amount of the SQSTM1 that was delivered to the lysosomes for degradation. SQSTM1 protein interacts with both the ubiquitin protein and LC3-II, and is degraded in the autolysosomes. A reduction in the amount of SQSTM1 therefore reflects an increase in autophagic degradation. We also used starvation medium (EBSS), which is used as a positive control to induce a buildup of autophagy and of the autophagic flux. Immunoblot analysis showed that Sal treatment increased the level of SQSTM1 (Fig. 1B), which seems to confirm that Sal impairs the autophagic degradation process. Nonadherent mammosphere cultures provide an appropriate model in which the proportion of mammary CSCs/progenitor cells is increased. We first used MTS reduction assays to determine the sensitivity of this model to Sal (Fig. S1A). As expected, the cells exhibited substantial sensitivity to Sal. We then used mammospheres to investigate the effect of Sal on the autophagic capacity of mammary CSCs/progenitor cells. Changes in LC3 localization were assayed in cells stably transfected with GFP-LC3. As illustrated in Figure 1C, GFP-LC3 assays revealed a few punctate fluorescent patterns in untreated MCF-7-GFP-LC3 mammosphere. Sal caused an accumulation of punctate fluorescent patterns, indicating the redistribution of LC3 to the autophagic structures. The increase in GFP-LC3 puncta was unaffected by the presence of Baf; suggesting that Sal also inhibits the autophagic process in nonadherent mammosphere cultures. These data were confirmed by western blot analysis with an anti-LC3 antibody (data not shown). Statistical analysis indicated that autophagic flux in the mammospheres was significantly inhibited by Sal. Taken together, these findings demonstrate that whichever model is considered, Sal always inhibits autophagic flux. Besides using autophagic flux estimations based on Baf, we also used MCF-7 cells transfected with the GFP-RFP-LC3 plasmid. This probe can be used to identify autophagosomes (GFP positive/RFP positive; yellow dots) and autolysosomes (GFP-negative/RFP-positive; red dots), because the GFP fluorescence is quantitatively quenched in low pH compartments.47 Analysis of the distribution of the GFP-RFP-LC3 fusion protein in the EBSS-treated cells (positive control) showed that numbers of both the yellow and red puncta had increased, indicating that the autophagy flux had increased. Whatever the cell line considered (Fig. 1D), in the presence of Sal we always observed an accumulation of yellow puncta without any significant increase in the number of red puncta. These observations suggest that Sal inhibits the flux through the autophagic pathway.
Autophagosome and lysosome fusion was not inhibited by Sal
The fusion of the autophagosomes with lysosomes is the final stage of autophagy. This step was investigated by staining MCF-7-GFP-LC3 cells with LysoTracker-Red (an acidic pH marker for lysosomes), and observing them using confocal microscopy.
Normal fusion between autophagosomes and lysosomes was induced by starvation conditions (EBSS). Surprisingly, we found that there was a significant overlap between LC3 and lysosomal signals (Fig. 2A, Pearson’s correlation coefficient = 0.5) in the Sal-treated cells, indicating that autophagosome–lysosome fusion was not inhibited. RAB7A is involved in both the endolysosomal and autophagic pathways.48 We therefore transiently cotransfected MCF-7 cells with mcherry-LC3 and RAB7A-GFP plasmids. This cotransfection can be used to identify autophagosomes (mCherry positive/GFP negative; red dots) and autolysosomes (mCherry-positive/GFP-positive; yellow dots). Confocal analysis indicated that LC3 and RAB7A overlapped in the Sal-treated cells, indicating that Sal treatment had not inhibited the fusion between the autophagosome and lysosome (Fig. 2B). We also monitored fluid phase endocytosis by fluorescent dextran uptake (Fig. 2C). Confocal analysis indicated that TRITC-Dextran and LC3 overlapped in the Sal-treated cells (arrows), confirming that autophagosome-lysosome fusion was not inhibited by Sal. This experiment also demonstrates that Sal does not block fluid-phase endocytosis.

Figure 2. Sal does not block the fusion of the autophagosome and lysosome. (A) Right, MCF-7-GFP-LC3 cells were either treated with 2 μM of Sal or starved in EBSS for 4 h, before being stained with LysoTracker-Red. The cells were then fixed, and followed by confocal microscopy. Scale bar: 10 μm. Left, the colocalization of GFP-LC3 and LysoTracker-Red were estimated as Pearson’s correlation coefficient [R(r)] using ImageJ software. More than 30 cells were counted in each condition and data (mean ± SD) are representative of two independent experiments. (B) Right, MCF7 cells were cotransfected by RAB7A-GFP and mCherry-LC3. Twenty-four hours after transfection, the cells were either treated with 2 μM of Sal or starved in EBSS for 4 h. Cells were then fixed before being subjected to confocal microscopy. Scale bar: 10 μm. Left, the colocalization was determined as in (A). (C) MCF-7-GFP-LC3 cells were incubated with TRITC-Dextran (1 mg/mL) overnight followed by a 4 h chase. Cells preloaded with TRITC-Dextran were then either untreated or treated with 2 μM of Sal for 16 h, and then subjected to confocal microscopy analysis without fixation. Right, an intensity profile of both channels was measured using the Plot Profile function in the ImageJ software. The regions where the peak signal for GFP-LC3 (green fluorescence) and the peak signal for TRITC-Dextran (red fluorescence) overlapped were identified. Arrows in the images point to typical examples of colocalized GFP and TRITC-Dextran signals. Data are representative of the cells observed. Scale bar: 10 μm.
Sal induces free GFP fragments from mCherry-GFP-LC3 without affecting of acridine orange staining
As autophagosome-lysosome fusion depends on the pH in acidic compartments,49 we used the acridine orange method (AO) to evaluate the lysosomal pH. AO is a nucleic acid dye that also enters acidic compartments, such as lysosomes, where it becomes protonated and sequestered. Under these low pH conditions, the dye emits red light when excited by blue light. Unlike nigericin (Nig) or Baf, in both control- and Sal-treated cells, the cytoplasm and nucleus displayed green fluorescence, whereas the acidic compartments, including lysosomes, displayed red fluorescence. Our data provide evidence that lysosomes have the characteristics of acidic compartments in Sal-treated cells.
We next performed the mCherry-GFP-LC3 assay in stably transfected MCF-7 cells (Fig. 3B). According to Mizushima et al.,50 when autophagy is stimulated by starvation red puncta accumulate, because of the lysosomal quenching of the GFP fluorescence at acidic pH. When lysosomal degradation was inhibited by treating the cells with either the ionophore Nig or the lysosomotropic drug chloroquine (CQ), we observed an accumulation of yellow puncta. We also observed an accumulation of yellow puncta (p = 0.007) without any significant increase in the number of red puncta in Sal-treated cells as compared with control cells. Interestingly as reported by Ni et al.,51 analysis of the chimeric protein by western blot showed that Sal treatment resulted in the accumulation of free GFP fragments (Fig. 3C). The presence of free GFP fragments was also observed in CQ- (Fig. 3C, CQ) and Nig-treated cells (Fig. 3C, Nig) whereas free GFP fragments were barely detectable in starved cells where the lysosomal activity is high. (Fig. 3C, EBSS). These results suggest that the lysosomal proteolytic activity is impaired in Sal-treated cells.

Figure 3. Sal induces free GFP fragments from mCherry-GFP-LC3 without affecting acridine orange staining. (A) Sal did not interfere with acridine orange-staining of acidic compartments. MCF-7 cells were incubated with or without Sal (2 μM, overnight), Nig (0.1 μM, overnight), or Baf (100 nM, 1 h) before adding the acridine orange. In both the control and Sal-treated cells, the cytoplasm and nucleus essentially displayed green fluorescence, whereas the acidic compartments, including the lysosomes, displayed red fluorescence. Acidification of the latter compartments was inhibited by Nig and Baf. Scale bar: 20 μm. (B) Left, MCF-7-mCherry-GFP-LC3 stable cells were incubated in complete medium (Ctrl), were starved for the time indicated (EBSS), or were treated with Sal, CQ and Nig for the times and concentrations indicated. The cells were then fixed, and visualized by confocal microscopy. Scale bars: 15 μm. Right, the number of GFP+/mCherry+ (yellow) and GFP-/mCherry+-LC3+ (red) dots was scored on ~30 cells. The data are presented as means ± SD from 2 independent experiments, and analyzed using Student’s t-test (*p < 0.05, **p < 0.01, ***p < 0.001). (C) Sal increases the free GFP fragments in MCF-7-mCherry-GFP-LC3 stable cells. Immunoblot analysis of GFP, SQSTM1, LC3-I and LC3-II levels in cells treated with the concentrations of Sal indicated for the times indicated. As a control, cells were either incubated in complete medium (Ctrl), starved for the time indicated (EBSS), or were treated with autophagy inhibitors, such as CQ or Nig, for the times and concentrations indicated.
Sal treatment inhibits lysosomal activity
To monitor lysosomal activity during Sal treatment, cells were assayed for their ability to process DQ-BSA (a derivative of BSA the green fluorescence of which is quenched unless it is cleaved by proteolytic enzymes). Complete medium and starvation conditions were used to provide basal and stimulated lysosomal activity, respectively. As shown in Figure 4A, no dequenching of DQ-BSA occurred in Sal-treated cells, indicating that DQ-BSA was not efficiently cleaved in the presence of Sal. Note that DQ-BSA emission was detected from the lysosomes, as indicated by colocalization with LysoTracker-Red.52

Figure 4. Sal inhibits protein degradation in lysosomes. (A) MCF-7 cells were incubated with DQ-BSA (10 μg/ml) for 2 h. The cells were then washed twice with medium before being treated with 2 μM Sal or starved in EBSS for 4 h. The cells were fixed and stained with LysoTracker-Red before undergoing confocal microscopy. Scale bar: 20 μm. (B) Sal inhibits long-lived protein degradation in cells cultured in full medium. MCF-7 cells were radiolabeled for 24 h with 0.05 mCi/ml of L-[U-14C] valine. At the end of the labeling period, the cells were rinsed 3 times with PBS, before being incubated in full medium ± 2 μm Sal or in EBSS with 10 mM valine for 6 h. The data are presented as means ± SD from 3 independent experiments and analyzed using Student’s t-test (*p < 0.05). (C) Fluorogenic substrate measurement of cathepsin activity. MCF7 cells were treated with the indicated concentrations of Sal for 4 h, and the cell lysates were then used to measure the activity of cathepsins. The combined catalytic activities of cathepsins X, B, L and S were determined fluorometrically by cleaving the common synthetic substrate Z-Phe-Arg-7-amido-4-methylcoumarin. Specific catalytic activities of cathepsins S and C were measured using the substrates Z-Arg-Arg-AMC and Z-Phe-Arg-AMC, respectively. Samples were measured in triplicate. (D) Sal alters the maturation of CTSD in lysosomes without inducing its release into the cellular cytoplasm. The MCF7 cell line was treated with 5 μM Sal for 3 d or not treated. Right, immunoblot analysis of CTSD. The corresponding nonspecific band (NS) levels are shown as loading controls. Left, immunofluorescence detection of CTSD (red) in MCF-7 cells untreated or treated with Sal (5 μM, 3 d), or treated with staurosporine, which was used as positive control (STS, 0.5 μM, 2 h), followed by confocal microscopy. Anti-RPTOR immunofluorescence detection (green) was used as a control for the staining of the cytoplasmic compartment. Scale bar: 20 μm.
The inhibitory effect of Sal on lysosomal function was confirmed by determining the degradation rates of long-lived proteins.53 Sal treatment reduced the degradation of long-lived proteins in MCF-7 cells cultured in complete medium whereas, as expected, nutrient starvation increased the degradation of long-lived proteins (Fig. 4B).
We next performed functional assays of lysosomal activity in Sal-treated MCF-7 cells. We performed various different fluorogenic substrate assays to measure the enzymatic activity of cathepsin (CTS) (Fig. 4C). The combined activity of cathepsins Z, B, L, and S was significantly lower in Sal–treated cells, as were the specific activities of CTSB and CTSL, indicating that Sal significantly inhibits the activity of cathepsins. More importantly, as depicted in Figure 3D, Sal also impaired the maturation of CTSD thus confirming the inhibition of the activity of CTSB and CTSL, which are essential for the cleavage of the intermediate form to produce the mature form.54 However, in contrast to treatment with nigericin, a potassium ionophore with structural similarity to salinomycin, Sal treatment did not result in the release of cathepsins (here shown for CTSD in Fig. 4D) from the lysosomal compartments to the cytoplasmic compartment.54 Taken together, our data demonstrate that Sal impairs autophagic flux by inhibiting lysosomal activity.
Impairment of autophagy potentiates Sal-mediated inhibition of the proliferation of the breast CSCs
The link between the inhibition of autophagy and of cell proliferation by Sal in breast CSCs was further investigated by knocking down the expression of the essential autophagy gene. The size of the mammospheres is correlated with progenitor cell proliferation, whereas the number of mammospheres formed after serial passages at clonal density is correlated with the self-renewal capacity of primitive CSC.55 We first compared, the primary formation of mammospheres following shRNA-mediated silencing of ATG7 in the presence and absence of Sal (Fig. 5A and B). We found that both the size (150 µm vs 250 µm) and the cell viability (50% vs 100%) of the mammospheres decreased following Sal treatment. As previously described,55 the size (200 µm vs 250 µm) of the mammospheres also decreased when ATG7 expression was reduced. It is worth noting that both the size (100 µm vs 200 µm) and the cell viability (20% vs 100%) of the mammospheres fell following combined treatment with Sal and with shRNA-mediated silencing of ATG7. The data obtained confirm our previous data indicating that ATG7 is required for the proliferation of breast CSCs and progenitor cells.55 Notably, our data indicated that sensitivity to Sal was potentiated by downregulation of ATG7. We also observed that Sal induced apoptotic cell death (here measured by the collapse of the mitochondrial potential and TO-PRO®-3 nuclear incorporation) in mammospheres, and that the susceptibility to Sal-induced apoptosis was also significantly increased by the downregulation of ATG7 (Fig. 5B, 50% vs 37%). We then investigated secondary and tertiary (Fig. 5C) MCF-7 mammosphere formation following shRNA-mediated silencing of ATG7 both in the presence of Sal and in its absence. We found that the number of mammospheres fell when Sal treatment was combined with and shRNA-mediated silencing of ATG7. Taken as a whole, our data indicated that the downregulation of ATG7 potentiates the Sal-mediated inhibition of proliferation and Sal-induced apoptosis of breast CSCs. The colony formation assay is an in vitro cell survival assay based on the long-term clonogenic capacity of cells to grow. Colony formation assay analysis indicated that Sal treatment or shRNA-mediated silencing of ATG7 alone, or in combination, significantly reduced colony formation (Fig. 5D). Thus, our data confirm that sensitivity to Sal was potentiated by downregulating ATG7.

Figure 5. Downregulation of ATG7 sensitives breast cancer stem cells to Sal. (A) MCF-7 adherent cells were stably transfected with shRNA-mediated scrambled (shSCR) or shRNA-mediated silencing of ATG7 (shATG7). The single-cell suspension corresponding to each condition was cultured under mammosphere conditions. Representative phase-contrast photomicrographs of mammospheres treated with Sal or untreated. The single-cell suspension from primary mammospheres of ShSCR and ATG7 knockdown cells were seeded at a single cell/well in a 96-well plate, and mammospheres formed after 7 d. The mammospheres were then treated with 2 μM Sal for 4 d or untreated, and monitored under a microscope. (B) Right, quantification of the size and number of mammospheres in (A). Middle, cell viability (%) was determined by an MTS assay comparing the cell proliferation of the mammospheres in response to Sal treatment. Left, apoptosis was evaluated using DiOC6(3) and TO-PRO®-3 staining, and FACS analysis. Results are representative of three independent experiments. (C) MCF7-scrambled (shSCR) and ATG7 knockdown cells were cultured in mammosphere-forming conditions. Primary mammospheres were incubated with Sal (1 and 2 μM) or DMSO for 4 d. In the absence of the drug, the second and third passages that were derived from Sal-treated primary mammospheres yielded fewer spheres than the controls. The data are presented as the mean ± SD from 3 independent experiments, and analyzed using Student’s t-test (*p < 0.05, **p < 0.01, ***p < 0.001). (D) Cologenic assay. Left, representative phase contrast photomicrographs of a cologenic assay. MCF-7 cells (2500 cells/dish) were incubated with Sal (2 μM) for 72 h. After 42 d, the cells were fixed and stained for microscopic examination of colony formation as described in Materials and Method. Right, quantification of the number of clones per 2500 cells (%) performed using the indicated dose. Note that results are normalized vs the untreated shSCR cells.
Sal specifically targets apoptotic cell death in the ALDH+ subpopulation, which is more susceptible to Sal-mediated inhibition of autophagic flux
As described above, Sal sensitizes resistant human cancer cell lines to apoptosis mediated by radiation and cytostatic drugs, and can also induce the apoptotic cell death of cancer cells including CSCs specifically. To get further insights into the potential involvement of autophagic flux inhibition in the susceptibility of CSCs to Sal-induced apoptosis, HLMER cells were first sorted into two subpopulations on the basis of their ALDH1 activity using an Aldefluor assay and using flow cytometry cell sorting (FACSAria; BD Biosciences) (Fig. S2). As illustrated in Figure 6A, western blot analysis of SQSTM1 and LC3 showed that in the presence of Baf in complete medium, SQSTM1 and LC3-II accumulation (measured the basal autophagy flux) increased markedly more in ALDH+ cells than in ALDH− cells (2.7 vs 1.46 and 7.75 vs 5.71, respectively). In accordance with our previous study,55 these data confirm that autophagosome synthesis is significantly greater in ALDH+ cells than in their ALDH− counterparts. We observed that Sal induced a fall in the basal autophagic flux in both ALDH+ cells and ALDH− cells (2.7 vs 1.36 and 1.46 vs 1.31, respectively for SQSTM1; and 7.75 vs 1.63 and 5.71 vs 2.15, respectively for LC3-II). However, the decrease in autophagy flux was greater in ALDH+ cells than in their ALDH− counterparts (51% vs 9% respectively for SQSTM1). More importantly, we observed that the dramatic decrease in the basal autophagic flux in ALDH+ cells was correlated with the greater susceptibility of ALDH+ cells to Sal-induced apoptosis compared with ALDH− cells (Fig. 6B). We next knocked down the expression of the ATG7 gene in ALDH− and ALDH+ cells, using specific siRNAs, and analyzed the crosstalk between apoptosis and autophagy. We found that downregulating ATG7 expression significantly enhanced the cell death-inducing effect of Sal in ALDH+ cells (Fig. 6C), without any having effect in ALDH− cells. Quantification of apoptotic cells showed that the impact of apoptosis in ATG7 RNAi-transfected cells after Sal treatment was greater (35% vs 22%, 48 h) than control (SiRNA Crtl, treated with Sal for 48 h). No difference was observed after the longer treatment (72 h). Our data indicated that depletion of ATG7 in the context of the CSC-phenotype (ALDH+ cells) accelerates the proapoptotic action of Sal, suggesting that the autophagy pathway has a protective effect against the action of Sal. It is worth noting that ATG7 depletion does not sensitize ALDH− cells to Sal-induced cell death. These findings suggest that the autophagy pathway may be involved in controlling the susceptibility of the CSC/progenitor phenotype to Sal-induced apoptotic cell death.

Figure 6. Sal-mediated inhibition of autophagic flux is specifically accompanied with apoptotic cell death in ALDH+ HMLER cells. (A) Autophagic flux. Immunoblot analysis of LC3-I, LC3-II and SQSTM1 levels in ALDH− and ALDH+-sorted HMLER cell lines incubated in full medium with or without 5 μM Sal for 8 h in the presence or absence of Baf (final concentration: 100 nM). Tubulin immunoblotting was used as the loading control. As indicated below each lane, the SQSTM1/Tubulin and LC3-II/Tubulin ratios were determined using Bio1D software. The graph shows the autophagic flux, determined as the ratio between the LC3-II and SQSTM1 levels, with and without Baf, is expressed in arbitrary units. (B) Apoptotic cell death. ALDH− and ALDH+-sorted HMLER cell lines were incubated with concentrations of Sal indicated for 48 h. Apoptosis was evaluated by DiOC6(3) and TO-PRO®-3 staining, and FACS analysis. All data are expressed as means ± s.d. from three individual experiments (***p < 0.005). (C) ALDH− and ALDH+ cells were preincubated with siRNA against ATG7, or with a negative control siRNA for 72 h. The cells were then either treated with Sal (2 μM) or untreated for 48 h and 72 h. Apoptosis was evaluated as described in (B). Data are expressed as means ± s.d. from three individual experiments, and analyzed using Student’s t test (*p < 0.05).
Discussion
Finding new therapeutic strategies for killing CSCs is a major goal of cancer research. Since a recent study has shown that Sal is at least 100 times more effective than paclitaxel in reducing the proportion of breast CSCs, several studies have focused on Sal-induced apoptosis. However, the mechanism of action by which it specifically kills CSCs is still unclear. A proprietary formulation of Sal, VS-507, a WNT inhibitor, will be evaluated in phase I/II clinical trials to treat triple-negative breast cancer. Emerging data indicate the important role of autophagy pathways in the survival, self renewal and differentiation of both stem cells and CSCs.56-59 We have recently shown that autophagy is essential for the tumorigenicity of CSCs in breast cancer.55
In this study, we reported the inhibitory effect of Sal on autophagy and its consequence on the crosstalk with the apoptosis pathway. We investigated the effects of Sal on autophagic flux using a several different approaches, including determining the levels of the LC3 and SQSTM1 proteins by immunoblotting, confocal analysis of tandem GFP-RFP/mCherry-tagged LC3 fluorescence and analysis of the long-lived protein turnover. We provided evidence that Sal inhibits autophagic flux in both CSCs and non-CSCs derived from cancer cell lines. Autophagy flux inhibition is a consequence of the decreased autophagosome turnover. This decrease can be due to delayed trafficking to the lysosomes or decreased fusion between compartments, or defective lysosomal proteolytic activity.
LysoTracker-Red assay, fluorescent dextran uptake and the colocalization of mcherry-LC3 and GFP-RAB7A show that the fusion of autophagosomes and lysosome was not impaired by the action of Sal. It is now generally considered that autophagosome-lysosome fusion is regulated by the internal pH in acidic organelles.49 Our data are consistent with data reported for nigericin or monensin, both of which have a structure similar to that of Sal, and which also impair the autophagic flux.60 In contrast to these ionophores, which act as K+/H+ antiporters and raise the pH of the acidic compartments,60 AO staining shows that in Sal-treated cells, lysosomes display the characteristics of acidic compartments. In addition, like CQ, Sal enlarged the lysosomal compartment (Fig. 3A) which retained the ability to be stained by LysoTracker-Red (Fig. 4A; refs. 61 and 62). Our data demonstrated that the degradation of mCherry-GFP-LC3 is blocked by Sal. These findings are consistent with data reporting that free GFP fragments are the first to be generated in the step-wise degradation of GFP-LC3.51 The authors suggest that the GFP moiety is probably degraded rather than quenched under starvation conditions, but that it accumulates in nonsaturating concentrations of autophagy inhibitors, such as CQ and E64D. As a result of the presence of free GFP fragments, the autolysosomes are stained yellow. Sal probably also has an effect (not detectable by AO staining) on lysosomal pH, which prevents quenching of the GFP fluorescence. These findings highlight the fact that caution is required when using tandem assays to monitor autophagosome-lysosome fusion.
Based on our data from the DQ Green BSA assay, we found that Sal can lead to lysosomal dysfunction. The lysosomal hydrolases that degrade sequestered components that have undergone the most investigation are the cathepsin proteases. Using an in vitro cathepsin substrate assay, CTSD maturation immunoblot, and immunocytochemistry analysis, we notably demonstrated that Sal dramatically reduces the activity of cathepsins, resulting in the inhibition of lysosomal activity. Although the cytoplasmic release of lysosomal CTSB and CTSD precedes cell death following exposure to several stressful situations, such as treatment with staurosporine or tumor necrosis factor α, oxidative stress and UV irradiation,63 our data excluded the involvement of CTSB activity or CTSD release in the lethal effects of Sal.
Breast cancer progenitor/stem-like cells (BCSCs) form spherical clusters (known as “mammospheres”) in suspension cultures due to their capacity for self-renewal; they carry the CD44+/CD24− phenotype and display high ALDH1 activity. The size of the mammospheres is correlated with progenitor cell proliferation, whereas the number of mammospheres formed after serial passages at clonal density is correlated with the self-renewal ability of primitive CSCs.3 We next demonstrated that the inhibition of the autophagy flux by Sal reduced both the size and the number of mammospheres, suggesting that Sal abolished the proliferation of BCSCs. These findings are consistent with our recently published data indicating that the autophagy pathway is essential for maintaining the proliferation of BCSCs.55 Notably, we demonstrate here that depletion of the proteins required for autophagy enhances the apoptosis induced by Sal in adherent and mammospheric cells.
We observed that the basal autophagic flux was higher in the ALDH1+ population derived from the HMLER cell line than in the corresponding ALDH1- population. These findings suggest that cells with the CSC/progenitor phenotype display higher autophagy flux than those with the non-CSC/progenitor phenotype. Autophagy flux fell in both ALDH+ and ALDH− populations following Sal treatment. However, the fall in autophagy flux was greater in ALDH+ population than in the ALDH− one (51% vs 10%, respectively). Consistent with data showing that Sal can effectively kills ALDH+ gastric cells,64 we also observed that apoptotic cell death was higher in the ALDH1+ population derived from the HMLER cell line than in the ALDH− population. These findings are consistent with data indicating that Sal-induced apoptosis is increased in autophagy-deficient cells. Inhibition of Sal-autophagic flux happened very quickly (2 h after treatment), whereas it took much longer (48 h after treatment) for apoptotic cell death to occur (data not shown). The inhibition of the autophagic flux therefore precedes apoptotic cell death. In addition, deficiency of the autophagy pathways sensitizes the cell to Sal-induced apoptosis, highlighting the complex relationship between autophagy and apoptosis in the action of Sal. Accumulating data suggest that ROS plays an essential role in activating autophagy.65 Sal inhibits cancer growth and migration, also via the induction of oxidative stress.66,67 Our data showed that silencing ATG7 does not change the amount of Sal-induced ROS, indicating that the increase of apoptosis in autophagy-deficient cells is not due to higher ROS production (data not shown). Our data indicated that depletion of ATG7 alone in ALDH+ cells (now considered by many to be the most robust marker of CSCs in the breast cancer field) has no effect on cell death; but ATG7 depletion combined with Sal, accelerates the proapoptotic action of Sal (i.e., it has a synergistic effect), suggesting that the autophagy pathway has a protective effect against the action of Sal. It is worth noting that ATG7 depletion does not sensitize ALDH− cells to Sal-induced cell death. The fact that ATG7 knockdown potentiates both the Sal-induced inhibition of proliferation and cell death seems to be contradictory. It is possible that in control ALDH+ cells treated by Sal proapoptotic components are sequestrated in autophagic vacuoles, whereas the increase in apoptosis observed in ATG7-knockdown cells treated by Sal would be the consequence of the cytoplasmic accumulation of proapoptotic components. In line with this proposal, it has been reported that components of the apoptotic machinery such CASP8, CASP3 or mitochondria are selectively sequestrated in autophagic vacuoles.68 Further investigation is necessary to confirm this hypothesis. Our data support a model in which Sal induces ROS and mitochondrial pathway-mediated apoptosis, and dramatically reduces the activity of cathepsins resulting in the inhibition of lysosomal activity and autophagic flux (Fig. 7).
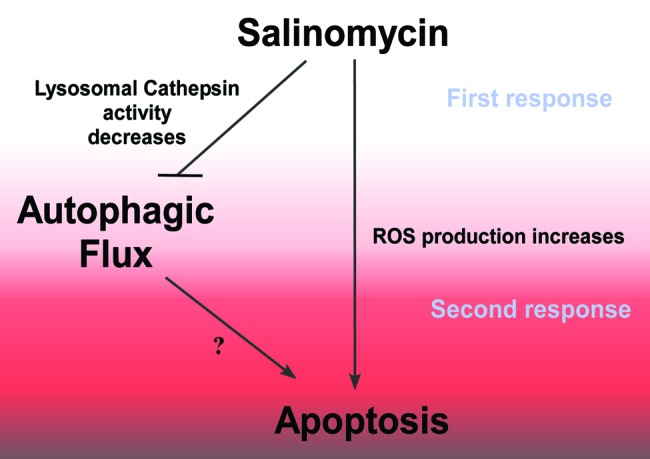
Figure 7. Model of antiautophagic and proapoptotic ability of Sal. Sal induces ROS and mitochondrial pathway-mediated apoptosis, and dramatically reduces the activity of cathepsins resulting in the inhibition of lysosomal activity and autophagic flux.
Our study emphasizes that autophagy is required for the maintenance and expansion of breast CSC/progenitor cells. Indeed, our data are consistent with the fact that by inhibiting the basal autophagy flux, Sal interferes with the maintenance and expansion of the CSC/progenitor phenotype. Surprisingly, the autophagy pathway seems to play some role in controlling the susceptibility of the CSC/progenitor phenotype to Sal-induced apoptotic cell death. Our data provide new insights into how lysosomal function contributes to the ability of Sal to target CSCs in vitro. Our research indicates a possible new strategy for killing CSCs, involving the inhibition of autophagy flux, thus encouraging the development of therapeutic molecules targeting the autophagy flux of the CSC/progenitor phenotype, which is more susceptible to its inhibition.
Materials and Methods
Reagents and antibodies
Salinomycin (S4526), bafilomycin A1 (B1793), and anti-ACTB (β-actin) (40K4879), anti-LC3B rabbit polyclonal (L7543) and anti-ATG7 (A2856) antibodies were supplied by Sigma-Aldrich. Anti- SQSTM1 (p62) antibody (610833) was from BD Transduction Laboratories. Anti-GFP (11814460001) was from Roche. Anti-RPTOR (RAPTOR) (4978) was from Cell Signaling. Anti-CTSD (Cathespin D) antibody (SC-6486) used for western blot was purchased from Santa Cruz Biotechnology and anti-CTSD (M1G8) antibody used for confocal scanning immunofluorescence microscopy was a gift from Dr. Sophie Pattingres (Montpellier, France). Anti-TUBB (β-tubulin) mouse monoclonal antibody (E7) developed by Dr. Micheal Klymkowsky was obtained from the Developmental Studies Hybridoma Bank maintained by the University of Iowa. 3,3′-Dihexyloxacarbocyanine Iodide (DIOC6(3); D273), TO-PRO®-3 (T3605), DQTM Green BSA assay (D12050), Earle’s Balanced Salt Solution (EBSS; 14155-063) and fetal bovine serum (10270-106) were purchased from Invitrogen. The ECLTM western blotting detection kit (WBKLS0500), and donkey anti-rabbit antibody (NA9340N) were purchased from Amersham Biosciences. Goat anti-mouse (170-6516) was obtained from Bio-Rad.
Cell culture
Human breast cancer cell line MCF-7 cells and MCF-7-GFP/LC3 cells were kindly provided by M. Jaattela (Institute of Cancer Biology), and cultured in RPMI supplemented with 2 mM L-glutamine (25030) and 10% FBS. The human mammary epithelial cell line infected with a retrovirus carrying hTERT, SV40 large T and the oncogenic allele H-RasV12 (referred to as HMLER) was a generous gift from RA Weinberg Whitehead Institute, Massachusetts Institute of Technology. Epithelial-mesenchymal transition can promote stem cell phenotype in mammary epithelial cells.69 HMLER CD24−/low (CD24−) is a subclone that was established as described.45 This model is known to be rich in the ‘stemness’ phenotype. HMLER CD24− cells were cultured as recommended by Lonza. ATG7 shRNA- (Santa Cruz, sc-41447-V), and noncoding shRNA-lentiviral particles (Santa Cruz, sc-108080) were used to directly infect immortalized MCF-7 cells, and stable clones were selected using puromycin (Invivogen, ant-pr-1) as previously described.70 The selected cell populations were subjected to western blotting with an anti-ATG7 antibody to investigate the silencing efficiency of the ATG7-shRNA.
Mammosphere-formation assay
Single-cells were plated at 103 cells/ml in ultralow attachment culture dishes in the serum-free DMEM/F12 supplemented with B27 (1:50, Invitrogen, 17504044), 20 ng/ml epidermal growth factor (BD Biosciences, AF 115), and 4 μg/ml insulin (Sigma-Aldrich, I9278), as previously described.71 After 7 d, mammospheres were formed and different concentrations of Sal, as indicated in the figure legends, were added to culture for 4 d. Mammospheres were enzymatically dissociated with 0.05% trypsin (Gibco, 15090) for 15 min at 37°C to obtain a single-cell suspension. Sphere formation was assessed 7 d after seeding the cells at a single cell/well in 96-well ultralow attachment plates (Corning) without any drug. The number and the size of mammospheres were analyzed under a light microscope.
Cell sorting for ALDH+ cells and ALDH− cells by using ALDEFLUOR kit
HLMER cells (1 × 10⁶/ml) were collected and the ALDH1 enzyme activity in these cells was measured by flow cytometry using the enzyme substrate ALDEFLUOR reagent in the presence or absence of the specific enzyme inhibitor diethylamino-benzyaldehyde (DEAB) according to the manufacturer’s protocol (ALDEFLUOR kit, Aldagen, 01700).55 Cells that did or did not express ALDH1 (ALDH+ and ALDH− gates respectively) were sorted on a FACS Aria 1 flow cytomoter (BD Biosciences FACS Aria™ I cell sorter) with 488 nm blue laser and a 530/30 bandpass filter (green fluorescence). ALDH+ cells were identifiable by having greater fluorescence than cells in which the enzyme activity was inhibited by DEAB.
Western blot analysis
Western blot analysis was done as described previously.55 All of the experiments were repeated at least three times. Representative autoradiograms are shown. The antibody dilutions were as follows: anti-LC3 1:5,000; anti-SQSTM1(p62) 1:1000; anti-EGFR 1:1000 anti-ACTB 1:20,000; anti-CTSD 1:1000; anti-GFP 1:1000; anti-TUBB 1:1000.
Confocal scanning immunofluorescence microscopy
Adherent cells were grown to 50% confluence on a coverslip. Mammospheres were cultured overnight in the same medium. Adherent cells and the corresponding mammospheres were then cultured in complete or starvation medium for the times indicated. The cells were washed twice with phosphate-buffered saline (PBS), and then fixed with freshly prepared 3.7% formaldehyde at 4°C for 20 min. The cells were then washed in PBS, and slides were mounted with a coverslip using DAKO Fluorescence Mounting Medium (Dako, S3023). Cell images were obtained using an LSM 510 META confocal microscope (Zeiss, Axiovert® 100) equipped with an argon laser (wavelength excitation 488 nm), and a Plan-Apochromat 63×/1.4 oil objective lens. GFP fluorescence was collected with a 505 nm Long-Pass emission filter. The pinhole diameter was set at 1.0 Airy Unit, giving a 0.8 µm optical slice thickness. Stacks of images were collected every 0.37 µm along the z axis. Since the spheres are 3-dimensional specimens, optical sectioning was done along the XZ-plane to get a Z stack for each specimen. The images were then imported for further analysis. For CTSD staining, treated and untreated cells were washed with PBS, and then fixed by incubating with 4% paraformaldehyde in PBS for 30 min, before being treated with NH4Cl (50 mM in PBS) for 10 min to quench the aldehyde groups. The cells were then rinsed three times with PBS. Saponin (0.05% in PBS with 5% FCS, known as PBS-FCS-S) was used to permeabilize the cells for 15 min. The nonspecific-binding sites were then blocked by incubating with 6 µg/ml human serum in PBS-FCS-S for 15 min. Cells were incubated for 120 min with the anti-human CTSD M1G8 mouse monoclonal antibody and anti-RPTOR rabbit polyclonal antibody, followed by a CyTM5-conjugated donkey anti-mouse IgG (red, 1/100, Jackson ImmunoResearch Laboratories, 715-175-151) and an FITC-conjugated donkey anti-rabbit IgG (green, 1/100, Jackson ImmunoResearch Laboratories, 711-095-152). The cells were then washed in PBS, and the slides were mounted with a coverslip using DAKO Fluorescence Mounting Medium (Dako). Cell images were obtained and analyzed as described above.
Quantitative evaluation
The 3D reconstructions of mammospheres captured by confocal microscopy were performed using the Imaris® software package (Bitplane Scientific Software).
In order to determine the number of GFP-LC3 vacuoles in 3D, we performed surface rendering using the Imaris MeasurementPro module. After identifying the objects from their intensity and their size, the data was exported to MS Excel and further analyzed. At least 50 to 100 cells per sample were counted in duplicate samples per condition per experiment.
GFP-LC3 or mRFP-GFP-LC3 or mCherry-GFP-LC3 assay
Cultured cells seeded in 6-well plates with microscope cover glasses were transfected for 24 h with GFP-LC3 or mRFP-GFP-LC3 (a gift from Dr. T. Yoshimori) using Fugene (Roche, 04709705001). The cells were treated with Sal as indicated in legend figures. After treatment, the cells were fixed with 4% paraformaldehyde (PFA) in phosphate-buffered saline (PBS). All the cell images were obtained using LSM 510 META confocal microscope (Zeiss). Autophagy was then measured by confocal counting of the cells with GFP-LC3 puncta or GFP+/mRFP+ (yellow) and GFP-/RFP-LC3+ (red) puncta. At least 50–100 cells/sample were counted in triplicate samples/condition/experiment.
The assay was performed in MCF-7 cells stably transfected with mCherry-GFP-LC3 (kindly provided by N. Brady, German Cancer Research Center, Heidelberg, Germany. Autophagy was then measured by confocal counting of cells with GFP+/mCherry+ (yellow) or GFP-/mCherry-LC3+ (red) puncta.
Acridine orange staining
Cell staining with acridine orange (AO, Sigma-Aldrich, A6014) was performed according to published procedures,72 adding a final concentration of 2 µg/ml for a period of 20 min (37°C, 5% CO2). Tumor cells were incubated with salinomycin (Sal, 2 µM, overnight), nigericin (Nig, 0.1 µM, overnight), or bafilomycin A1 (Baf, 100 nM, 1h) before the acridine orange was added. Photographs were obtained using an LSM 510 META confocal microscope (Zeiss) equipped with an argon laser (excitation wavelength 488 nm), and a Plan-Apochromat 63× /1.4 oil objective lens. AO produces red fluorescence (emission peak at about 650 nm) in the lysosomal compartments, and green fluorescence (emission peak between 530 and 550 nm) in the cytosolic and nuclear compartments.
Incorporation of TRITC -Dextran
TRITC-Dextran (MW 10,000) was purchased from Molecular Probes (D1817). MCF-7 cells were incubated with TRITC-Dextran (1 mg/ml) overnight. On the following day, the cells were transferred to fresh medium for the chase before being treated overnight with Sal (2 µM). The cells were observed with confocal microscopy without fixation.
Cathepsin activity assay
The catalytic activities of cathepsins Z(X), B, L, and S were determined fluorometrically by cleavage of the common synthetic substrate Z-Phe-Arg-7-amido-4-methylcoumarin (Bachem, 03-32-1501). NP-40 cell lysate protein (6 μg, pH 5) was incubated with pH 5 buffer (0.1 M citrate, 4 mM dithiothreitol, 4 mM ethylenediamine tetraacetic acid, 0.02% Triton X-100) and 10 μM of the substrate at 37°C and excited at 360 nm. The emitted fluorescence was measured at 465 nm every min with a fluorescence reader (Tecan SpectraFluor, Infinite® M1000 PRO). E-64 (30 μM; Sigma, E3132) completely inhibited enzyme activities, confirming the detection of cysteine protease activities. Samples were measured in triplicate. Catalytic activity of cathepsin S was measured with the specific substrate Z-Arg-Arg-MCA (10 μM, Peptanova, 3123-V). CTSC activity was specifically measured by cleaving the synthetic substrate Z-Phe-Arg-MCA (10 μM, Peptanova, 3095-V).
Clonogenic assay
MCF-7 cells were plated in 6-well plates and incubated with various concentrations of Sal (0–10 µM) for 4 d. Single-cell suspensions were then made, and mixed with an equal volume of 0.7% soft agar and plated in 6-well plates (2500 cells/well) for 28 d. After staining with 3-(4,5-dimethylthiazolyl-2)-2,5-diphenyltetrazolium bromide [(MTT), Sigma, M2128], colonies with a diameter of more than 0.5 mm were counted. For each type of cell, triplicate samples were analyzed.
Cell viability assay
The cell viability was determined by using the CellTiter 96® AQueous One Solution Cell Proliferation Assay Kit (Promega, G3582) according to the manufacturer’s manual.
Quantification of apoptosis by flow cytometry/measurement of the mitochondrial membrane potential (MMP)
The cells were treated with Sal as indicated in legend figures. After treatment, MMPs were determined by the retention of the dye DiOC6(3) and changes in plasma membrane permeability were measured by the incorporation of TO-PRO®-3. Cells were collected after treatment, and incubated with 40 nM DiOC6(3) and with 1 µM TO-PRO®-3 at 37°C for 30 min. Cells were washed twice with culture medium and then analyzed on a FACS calibur flow cytometer (Becton Dickinson). The data were processed using Cell Quest software (BD Biosciences). Apoptotic cells, which have decreased MMP, displayed reduced DiOC6(3) fluorescence with or without TO-PRO®-3 nuclear incorporation.
Protein degradation assay
Protein degradation was measured as previously described.43 Briefly, the cells were radiolabeled for 24 h with 0.05 mCi/ml of l-[U-14C]valine (256 mCi/mmol; Amersham Biosciences). At the end of the labeling period, the cells were rinsed three times with phosphate-buffered saline before being incubated for 6 h with 10 mM valine full medium in either the presence or the absence of 2 μM Sal, 100 nM of Baf, or EBSS.
Statistical analysis
Data were compared using a two-tailed Student's t-test, a Mann-Whitney U test, or a Wilcoxon t-test. Two groups were considered to be significantly different if p < 0.05.
Supplementary Material
Acknowledgments
We would like to thank B. Levine for providing the MCF-7 beclin 1 cell line, M. Jäättelä and N. Brady for providing the MCF-7 GFP-LC3 and mCherry-GFP-LC3 cell lines, respectively. We are grateful to Tamotsu Yoshimori (Research Institute for Microbial Diseases, Osaka University, Osaka, Japan) for kindly providing us with the GFP-LC3 and mRFP-GFP-LC3 constructs. This work was supported by institutional funding from INSERM, University Paris-Sud 11, and grants from the PHC-PFCC (program français de cooperation avec la Chine), the ANR (Agence Nationale de la Recherche), the INCa (Institut National du Cancer) and the ‘Ligue Nationale contre le Cancer’.
Glossary
Abbreviations:
- ACTB
actin, beta
- ATG12
autophagy-related 12
- ATG5
autophagy-related 5
- ATG16L1
autophagy-related ATG16L1
- ALDH1
aldehyde dehydrogenase 1
- Baf
bafilomycin A1
- BECN1
Beclin 1, autophagy related
- BCSCs
breast cancer stem-like /progenitor cells
- CASP3
caspase 3, CASP8, caspase 8, apoptosis-related cysteine peptidase
- CTNNB1
catenin (cadherin-associated protein), beta 1
- CTS
cathepsin
- EPCAM
epithelial cell adhesion molecule
- LRP6
lipoprotein receptor related protein
- LC3
microtubule-associated protein 1 light chain 3B
- MTORC1
the mechanistic target of rapamycin complex 1
- Nig
nigericin
- PAS
phagophore assembly site
- AO
acridine orange
- RAB7A
member RAS oncogene family
- ROS
reactive oxygen species
- RPTOR
regulatory associated protein of MTOR, complex 1
- Sal
salinomycin
- TUBB
β-tubulin
- WNT1
wingless-type MMTV integration site family
Disclosure of Potential Conflicts of Interest
The authors declare no conflict of interest.
Supplemental Materials
Supplemental materials may be found here: www.landesbioscience.com/journals/autophagy/article/23997
Footnotes
Previously published online: www.landesbioscience.com/journals/autophagy/article/23997
References
- 1.Clarke MF, Dick JE, Dirks PB, Eaves CJ, Jamieson CH, Jones DL, et al. Cancer stem cells--perspectives on current status and future directions: AACR Workshop on cancer stem cells. Cancer Res. 2006;66:9339–44. doi: 10.1158/0008-5472.CAN-06-3126. [DOI] [PubMed] [Google Scholar]
- 2.Bonnet D, Dick JE. Human acute myeloid leukemia is organized as a hierarchy that originates from a primitive hematopoietic cell. Nat Med. 1997;3:730–7. doi: 10.1038/nm0797-730. [DOI] [PubMed] [Google Scholar]
- 3.Al-Hajj M, Wicha MS, Benito-Hernandez A, Morrison SJ, Clarke MF. Prospective identification of tumorigenic breast cancer cells. Proc Natl Acad Sci U S A. 2003;100:3983–8. doi: 10.1073/pnas.0530291100. [DOI] [PMC free article] [PubMed] [Google Scholar]
- 4.Singh SK, Clarke ID, Terasaki M, Bonn VE, Hawkins C, Squire J, et al. Identification of a cancer stem cell in human brain tumors. Cancer Res. 2003;63:5821–8. [PubMed] [Google Scholar]
- 5.Kim CF, Jackson EL, Woolfenden AE, Lawrence S, Babar I, Vogel S, et al. Identification of bronchioalveolar stem cells in normal lung and lung cancer. Cell. 2005;121:823–35. doi: 10.1016/j.cell.2005.03.032. [DOI] [PubMed] [Google Scholar]
- 6.Ginestier C, Hur MH, Charafe-Jauffret E, Monville F, Dutcher J, Brown M, et al. ALDH1 is a marker of normal and malignant human mammary stem cells and a predictor of poor clinical outcome. Cell Stem Cell. 2007;1:555–67. doi: 10.1016/j.stem.2007.08.014. [DOI] [PMC free article] [PubMed] [Google Scholar]
- 7.Charafe-Jauffret E, Ginestier C, Iovino F, Tarpin C, Diebel M, Esterni B, et al. Aldehyde dehydrogenase 1-positive cancer stem cells mediate metastasis and poor clinical outcome in inflammatory breast cancer. Clin Cancer Res. 2010;16:45–55. doi: 10.1158/1078-0432.CCR-09-1630. [DOI] [PMC free article] [PubMed] [Google Scholar]
- 8.Pardal R, Clarke MF, Morrison SJ. Applying the principles of stem-cell biology to cancer. Nat Rev Cancer. 2003;3:895–902. doi: 10.1038/nrc1232. [DOI] [PubMed] [Google Scholar]
- 9.Clement V, Sanchez P, de Tribolet N, Radovanovic I, Ruiz i Altaba A. HEDGEHOG-GLI1 signaling regulates human glioma growth, cancer stem cell self-renewal, and tumorigenicity. Curr Biol. 2007;17:165–72. doi: 10.1016/j.cub.2006.11.033. [DOI] [PMC free article] [PubMed] [Google Scholar]
- 10.Gangemi R, Paleari L, Orengo AM, Cesario A, Chessa L, Ferrini S, et al. Cancer stem cells: a new paradigm for understanding tumor growth and progression and drug resistance. Curr Med Chem. 2009;16:1688–703. doi: 10.2174/092986709788186147. [DOI] [PubMed] [Google Scholar]
- 11.Gupta PB, Onder TT, Jiang G, Tao K, Kuperwasser C, Weinberg RA, et al. Identification of selective inhibitors of cancer stem cells by high-throughput screening. Cell. 2009;138:645–59. doi: 10.1016/j.cell.2009.06.034. [DOI] [PMC free article] [PubMed] [Google Scholar]
- 12.Danforth HD, Ruff MD, Reid WM, Miller RL. Anticoccidial activity of salinomycin in battery raised broiler chickens. Poult Sci. 1977;56:926–32. doi: 10.3382/ps.0560926. [DOI] [PubMed] [Google Scholar]
- 13.Miyazaki Y, Shibuya M, Sugawara H, Kawaguchi O, Hirsoe C. Salinomycin, a new polyether antibiotic. J Antibiot (Tokyo) 1974;27:814–21. doi: 10.7164/antibiotics.27.814. [DOI] [PubMed] [Google Scholar]
- 14.Mitani M, Yamanishi T, Miyazaki Y. Salinomycin: a new monovalent cation ionophore. Biochem Biophys Res Commun. 1975;66:1231–6. doi: 10.1016/0006-291X(75)90490-8. [DOI] [PubMed] [Google Scholar]
- 15.Fuchs D, Heinold A, Opelz G, Daniel V, Naujokat C. Salinomycin induces apoptosis and overcomes apoptosis resistance in human cancer cells. Biochem Biophys Res Commun. 2009;390:743–9. doi: 10.1016/j.bbrc.2009.10.042. [DOI] [PubMed] [Google Scholar]
- 16.Fuchs D, Daniel V, Sadeghi M, Opelz G, Naujokat C. Salinomycin overcomes ABC transporter-mediated multidrug and apoptosis resistance in human leukemia stem cell-like KG-1a cells. Biochem Biophys Res Commun. 2010;394:1098–104. doi: 10.1016/j.bbrc.2010.03.138. [DOI] [PubMed] [Google Scholar]
- 17.Riccioni R, Dupuis ML, Bernabei M, Petrucci E, Pasquini L, Mariani G, et al. The cancer stem cell selective inhibitor salinomycin is a p-glycoprotein inhibitor. Blood Cells Mol Dis. 2010;45:86–92. doi: 10.1016/j.bcmd.2010.03.008. [DOI] [PubMed] [Google Scholar]
- 18.Wang Y. Effects of salinomycin on cancer stem cell in human lung adenocarcinoma A549 cells. Med Chem. 2011;7:106–11. doi: 10.2174/157340611794859307. [DOI] [PubMed] [Google Scholar]
- 19.Kim JH, Yoo HI, Kang HS, Ro J, Yoon S. Salinomycin sensitizes antimitotic drugs-treated cancer cells by increasing apoptosis via the prevention of G2 arrest. Biochem Biophys Res Commun. 2012;418:98–103. doi: 10.1016/j.bbrc.2011.12.141. [DOI] [PubMed] [Google Scholar]
- 20.Kim WK, Kim JH, Yoon K, Kim S, Ro J, Kang HS, et al. Salinomycin, a p-glycoprotein inhibitor, sensitizes radiation-treated cancer cells by increasing DNA damage and inducing G2 arrest. Invest New Drugs. 2012;30:1311–8. doi: 10.1007/s10637-011-9685-6. [DOI] [PubMed] [Google Scholar]
- 21.Kim JH, Chae M, Kim WK, Kim YJ, Kang HS, Kim HS, et al. Salinomycin sensitizes cancer cells to the effects of doxorubicin and etoposide treatment by increasing DNA damage and reducing p21 protein. Br J Pharmacol. 2011;162:773–84. doi: 10.1111/j.1476-5381.2010.01089.x. [DOI] [PMC free article] [PubMed] [Google Scholar]
- 22.Lu D, Choi MY, Yu J, Castro JE, Kipps TJ, Carson DA. Salinomycin inhibits Wnt signaling and selectively induces apoptosis in chronic lymphocytic leukemia cells. Proc Natl Acad Sci U S A. 2011;108:13253–7. doi: 10.1073/pnas.1110431108. [DOI] [PMC free article] [PubMed] [Google Scholar]
- 23.Tang QL, Zhao ZQ, Li JC, Liang Y, Yin JQ, Zou CY, et al. Salinomycin inhibits osteosarcoma by targeting its tumor stem cells. Cancer Lett. 2011;311:113–21. doi: 10.1016/j.canlet.2011.07.016. [DOI] [PubMed] [Google Scholar]
- 24.Boehmerle W, Endres M. Salinomycin induces calpain and cytochrome c-mediated neuronal cell death. Cell Death Dis. 2011;2:e168. doi: 10.1038/cddis.2011.46. [DOI] [PMC free article] [PubMed] [Google Scholar]
- 25.Codogno P, Meijer AJ. Autophagy and signaling: their role in cell survival and cell death. Cell Death Differ. 2005;12(Suppl 2):1509–18. doi: 10.1038/sj.cdd.4401751. [DOI] [PubMed] [Google Scholar]
- 26.Kroemer G, Jäättelä M. Lysosomes and autophagy in cell death control. Nat Rev Cancer. 2005;5:886–97. doi: 10.1038/nrc1738. [DOI] [PubMed] [Google Scholar]
- 27.Maiuri MC, Zalckvar E, Kimchi A, Kroemer G. Self-eating and self-killing: crosstalk between autophagy and apoptosis. Nat Rev Mol Cell Biol. 2007;8:741–52. doi: 10.1038/nrm2239. [DOI] [PubMed] [Google Scholar]
- 28.Eisenberg-Lerner A, Bialik S, Simon HU, Kimchi A. Life and death partners: apoptosis, autophagy and the cross-talk between them. Cell Death Differ. 2009;16:966–75. doi: 10.1038/cdd.2009.33. [DOI] [PubMed] [Google Scholar]
- 29.Mizushima N. Autophagy: process and function. Genes Dev. 2007;21:2861–73. doi: 10.1101/gad.1599207. [DOI] [PubMed] [Google Scholar]
- 30.Mehrpour M, Esclatine A, Beau I, Codogno P. Overview of macroautophagy regulation in mammalian cells. Cell Res. 2010;20:748–62. doi: 10.1038/cr.2010.82. [DOI] [PubMed] [Google Scholar]
- 31.Mathew R, Karantza-Wadsworth V, White E. Role of autophagy in cancer. Nat Rev Cancer. 2007;7:961–7. doi: 10.1038/nrc2254. [DOI] [PMC free article] [PubMed] [Google Scholar]
- 32.Yorimitsu T, Klionsky DJ. Autophagy: molecular machinery for self-eating. Cell Death Differ. 2005;12(Suppl 2):1542–52. doi: 10.1038/sj.cdd.4401765. [DOI] [PMC free article] [PubMed] [Google Scholar]
- 33.Levine B, Klionsky DJ. Development by self-digestion: molecular mechanisms and biological functions of autophagy. Dev Cell. 2004;6:463–77. doi: 10.1016/S1534-5807(04)00099-1. [DOI] [PubMed] [Google Scholar]
- 34.Mizushima N. Autophagy in Protein and Organelle Turnover. Cold Spring Harb Symp Quant Biol 2011. [DOI] [PubMed] [Google Scholar]
- 35.Weidberg H, Shvets E, Elazar Z. Biogenesis and cargo selectivity of autophagosomes. Annu Rev Biochem. 2011;80:125–56. doi: 10.1146/annurev-biochem-052709-094552. [DOI] [PubMed] [Google Scholar]
- 36.Shintani T, Klionsky DJ. Autophagy in health and disease: a double-edged sword. Science. 2004;306:990–5. doi: 10.1126/science.1099993. [DOI] [PMC free article] [PubMed] [Google Scholar]
- 37.Klionsky DJ. Autophagy: from phenomenology to molecular understanding in less than a decade. Nat Rev Mol Cell Biol. 2007;8:931–7. doi: 10.1038/nrm2245. [DOI] [PubMed] [Google Scholar]
- 38.Shimizu S, Kanaseki T, Mizushima N, Mizuta T, Arakawa-Kobayashi S, Thompson CB, et al. Role of Bcl-2 family proteins in a non-apoptotic programmed cell death dependent on autophagy genes. Nat Cell Biol. 2004;6:1221–8. doi: 10.1038/ncb1192. [DOI] [PubMed] [Google Scholar]
- 39.Kondo Y, Kanzawa T, Sawaya R, Kondo S. The role of autophagy in cancer development and response to therapy. Nat Rev Cancer. 2005;5:726–34. doi: 10.1038/nrc1692. [DOI] [PubMed] [Google Scholar]
- 40.Luo S, Rubinsztein DC. Atg5 and Bcl-2 provide novel insights into the interplay between apoptosis and autophagy. Cell Death Differ. 2007;14:1247–50. doi: 10.1038/sj.cdd.4402149. [DOI] [PubMed] [Google Scholar]
- 41.Yu L, Alva A, Su H, Dutt P, Freundt E, Welsh S, et al. Regulation of an ATG7-beclin 1 program of autophagic cell death by caspase-8. Science. 2004;304:1500–2. doi: 10.1126/science.1096645. [DOI] [PubMed] [Google Scholar]
- 42.Lum JJ, Bauer DE, Kong M, Harris MH, Li C, Lindsten T, et al. Growth factor regulation of autophagy and cell survival in the absence of apoptosis. Cell. 2005;120:237–48. doi: 10.1016/j.cell.2004.11.046. [DOI] [PubMed] [Google Scholar]
- 43.Gao P, Bauvy C, Souquère S, Tonelli G, Liu L, Zhu Y, et al. The Bcl-2 homology domain 3 mimetic gossypol induces both Beclin 1-dependent and Beclin 1-independent cytoprotective autophagy in cancer cells. J Biol Chem. 2010;285:25570–81. doi: 10.1074/jbc.M110.118125. [DOI] [PMC free article] [PubMed] [Google Scholar]
- 44.Lorin S, Pierron G, Ryan KM, Codogno P, Djavaheri-Mergny M. Evidence for the interplay between JNK and p53-DRAM signalling pathways in the regulation of autophagy. Autophagy. 2010;6:153–4. doi: 10.4161/auto.6.1.10537. [DOI] [PubMed] [Google Scholar]
- 45.Morel AP, Lièvre M, Thomas C, Hinkal G, Ansieau S, Puisieux A. Generation of breast cancer stem cells through epithelial-mesenchymal transition. PLoS One. 2008;3:e2888. doi: 10.1371/journal.pone.0002888. [DOI] [PMC free article] [PubMed] [Google Scholar]
- 46.Rubinsztein DC, Cuervo AM, Ravikumar B, Sarkar S, Korolchuk V, Kaushik S, et al. In search of an “autophagomometer”. Autophagy. 2009;5:585–9. doi: 10.4161/auto.5.5.8823. [DOI] [PubMed] [Google Scholar]
- 47.Kimura S, Noda T, Yoshimori T. Dissection of the autophagosome maturation process by a novel reporter protein, tandem fluorescent-tagged LC3. Autophagy. 2007;3:452–60. doi: 10.4161/auto.4451. [DOI] [PubMed] [Google Scholar]
- 48.Jäger S, Bucci C, Tanida I, Ueno T, Kominami E, Saftig P, et al. Role for Rab7 in maturation of late autophagic vacuoles. J Cell Sci. 2004;117:4837–48. doi: 10.1242/jcs.01370. [DOI] [PubMed] [Google Scholar]
- 49.Kawai A, Uchiyama H, Takano S, Nakamura N, Ohkuma S. Autophagosome-lysosome fusion depends on the pH in acidic compartments in CHO cells. Autophagy. 2007;3:154–7. doi: 10.4161/auto.3634. [DOI] [PubMed] [Google Scholar]
- 50.Mizushima N, Yoshimori T, Levine B. Methods in mammalian autophagy research. Cell. 2010;140:313–26. doi: 10.1016/j.cell.2010.01.028. [DOI] [PMC free article] [PubMed] [Google Scholar]
- 51.Ni HM, Bockus A, Wozniak AL, Jones K, Weinman S, Yin XM, et al. Dissecting the dynamic turnover of GFP-LC3 in the autolysosome. Autophagy. 2011;7:188–204. doi: 10.4161/auto.7.2.14181. [DOI] [PMC free article] [PubMed] [Google Scholar]
- 52.Vázquez CL, Colombo MI. Assays to assess autophagy induction and fusion of autophagic vacuoles with a degradative compartment, using monodansylcadaverine (MDC) and DQ-BSA. Methods Enzymol. 2009;452:85–95. doi: 10.1016/S0076-6879(08)03606-9. [DOI] [PubMed] [Google Scholar]
- 53.Bauvy C, Meijer AJ, Codogno P. Assaying of autophagic protein degradation. Methods Enzymol. 2009;452:47–61. doi: 10.1016/S0076-6879(08)03604-5. [DOI] [PubMed] [Google Scholar]
- 54.Zaidi N, Maurer A, Nieke S, Kalbacher H. Cathepsin D: a cellular roadmap. Biochem Biophys Res Commun. 2008;376:5–9. doi: 10.1016/j.bbrc.2008.08.099. [DOI] [PubMed] [Google Scholar]
- 55.Gong C, Bauvy C, Tonelli G, Yue W, Deloménie C, Nicolas V, et al. Beclin 1 and autophagy are required for the tumorigenicity of breast cancer stem-like/progenitor cells. Oncogene. 2012 doi: 10.1038/onc.2012.252. In press. [DOI] [PMC free article] [PubMed] [Google Scholar]
- 56.Salemi S, Yousefi S, Constantinescu MA, Fey MF, Simon HU. Autophagy is required for self-renewal and differentiation of adult human stem cells. Cell Res. 2012;22:432–5. doi: 10.1038/cr.2011.200. [DOI] [PMC free article] [PubMed] [Google Scholar]
- 57.Oliver L, Hue E, Priault M, Vallette FM. Basal autophagy decreased during the differentiation of human adult mesenchymal stem cells. Stem Cells Dev. 2012;21:2779–88. doi: 10.1089/scd.2012.0124. [DOI] [PubMed] [Google Scholar]
- 58.Mortensen M, Soilleux EJ, Djordjevic G, Tripp R, Lutteropp M, Sadighi-Akha E, et al. The autophagy protein Atg7 is essential for hematopoietic stem cell maintenance. J Exp Med. 2011;208:455–67. doi: 10.1084/jem.20101145. [DOI] [PMC free article] [PubMed] [Google Scholar]
- 59.Cufí S, Vazquez-Martin A, Oliveras-Ferraros C, Martin-Castillo B, Vellon L, Menendez JA. Autophagy positively regulates the CD44(+) CD24(-/low) breast cancer stem-like phenotype. Cell Cycle. 2011;10:3871–85. doi: 10.4161/cc.10.22.17976. [DOI] [PubMed] [Google Scholar]
- 60.Lim J, Lee Y, Kim HW, Rhyu IJ, Oh MS, Youdim MB, et al. Nigericin-induced impairment of autophagic flux in neuronal cells is inhibited by overexpression of Bak. J Biol Chem. 2012;287:23271–82. doi: 10.1074/jbc.M112.364281. [DOI] [PMC free article] [PubMed] [Google Scholar]
- 61.Boya P, Gonzalez-Polo RA, Poncet D, Andreau K, Vieira HL, Roumier T, et al. Mitochondrial membrane permeabilization is a critical step of lysosome-initiated apoptosis induced by hydroxychloroquine. Oncogene. 2003;22:3927–36. doi: 10.1038/sj.onc.1206622. [DOI] [PubMed] [Google Scholar]
- 62.Hamacher-Brady A, Stein HA, Turschner S, Toegel I, Mora R, Jennewein N, et al. Artesunate activates mitochondrial apoptosis in breast cancer cells via iron-catalyzed lysosomal reactive oxygen species production. J Biol Chem. 2011;286:6587–601. doi: 10.1074/jbc.M110.210047. [DOI] [PMC free article] [PubMed] [Google Scholar]
- 63.Yamashima T, Oikawa S. The role of lysosomal rupture in neuronal death. Prog Neurobiol. 2009;89:343–58. doi: 10.1016/j.pneurobio.2009.09.003. [DOI] [PubMed] [Google Scholar]
- 64.Zhi QM, Chen XH, Ji J, Zhang JN, Li JF, Cai Q, et al. Salinomycin can effectively kill ALDH(high) stem-like cells on gastric cancer. Biomed Pharmacother. 2011;65:509–15. doi: 10.1016/j.biopha.2011.06.006. [DOI] [PubMed] [Google Scholar]
- 65.Scherz-Shouval R, Elazar Z. Regulation of autophagy by ROS: physiology and pathology. Trends Biochem Sci. 2011;36:30–8. doi: 10.1016/j.tibs.2010.07.007. [DOI] [PubMed] [Google Scholar]
- 66.Ketola K, Hilvo M, Hyötyläinen T, Vuoristo A, Ruskeepää AL, Orešič M, et al. Salinomycin inhibits prostate cancer growth and migration via induction of oxidative stress. Br J Cancer. 2012;106:99–106. doi: 10.1038/bjc.2011.530. [DOI] [PMC free article] [PubMed] [Google Scholar]
- 67.Kim KY, Yu SN, Lee SY, Chun SS, Choi YL, Park YM, et al. Salinomycin-induced apoptosis of human prostate cancer cells due to accumulated reactive oxygen species and mitochondrial membrane depolarization. Biochem Biophys Res Commun. 2011;413:80–6. doi: 10.1016/j.bbrc.2011.08.054. [DOI] [PubMed] [Google Scholar]
- 68.Hou W, Han J, Lu C, Goldstein LA, Rabinowich H. Autophagic degradation of active caspase-8: a crosstalk mechanism between autophagy and apoptosis. Autophagy. 2010;6:891–900. doi: 10.4161/auto.6.7.13038. [DOI] [PMC free article] [PubMed] [Google Scholar]
- 69.Mani SA, Guo W, Liao MJ, Eaton EN, Ayyanan A, Zhou AY, et al. The epithelial-mesenchymal transition generates cells with properties of stem cells. Cell. 2008;133:704–15. doi: 10.1016/j.cell.2008.03.027. [DOI] [PMC free article] [PubMed] [Google Scholar]
- 70.Ghavami S, Mutawe MM, Schaafsma D, Yeganeh B, Unruh H, Klonisch T, et al. Geranylgeranyl transferase 1 modulates autophagy and apoptosis in human airway smooth muscle. Am J Physiol Lung Cell Mol Physiol. 2012;302:L420–8. doi: 10.1152/ajplung.00312.2011. [DOI] [PubMed] [Google Scholar]
- 71.Dontu G, Abdallah WM, Foley JM, Jackson KW, Clarke MF, Kawamura MJ, et al. In vitro propagation and transcriptional profiling of human mammary stem/progenitor cells. Genes Dev. 2003;17:1253–70. doi: 10.1101/gad.1061803. [DOI] [PMC free article] [PubMed] [Google Scholar]
- 72.Traganos F, Darzynkiewicz Z. Lysosomal proton pump activity: supravital cell staining with acridine orange differentiates leukocyte subpopulations. Methods Cell Biol. 1994;41:185–94. doi: 10.1016/S0091-679X(08)61717-3. [DOI] [PubMed] [Google Scholar]
Associated Data
This section collects any data citations, data availability statements, or supplementary materials included in this article.