

Abstract
Background
Multiple lines of evidence support a role for the glutamatergic system in the pathophysiology of major depressive disorder (MDD). Ketamine, an N-methyl-D-aspartate (NMDA) antagonist, rapidly improves depressive symptoms in individuals with treatment-resistant depression. The neural mechanisms underlying this effect remain unknown.
Methods
In this preliminary study, twenty unmedicated participants with treatment-resistant MDD underwent positron emission tomography (PET) to measure regional cerebral glucose metabolism at baseline and following ketamine infusion (single dose of 0.5 mg/kg i.v. over 40 minutes). Metabolic data were compared between conditions using a combination of region-of-interest and voxelwise analyses, and differences were correlated with the associated antidepressant response.
Results
Whole-brain metabolism did not change significantly following ketamine. Regional metabolism decreased significantly under ketamine in the habenula, insula, and ventrolateral and dorsolateral prefrontal cortices of the right hemisphere. Metabolism increased post-ketamine in bilateral occipital, right sensorimotor, left parahippocampal, and left inferior parietal cortices. Improvement in depression ratings correlated directly with change in metabolism in right superior and middle temporal gyri (STG/MTG). Conversely, clinical improvement correlated inversely with metabolic changes in right parahippocampal gyrus and temporoparietal cortex.
Conclusions
Although preliminary, these results indicate that treatment-resistant MDD subjects showed decreased metabolism in the right habenula and the extended medial and orbital prefrontal networks in association with rapid antidepressant response to ketamine. Conversely, metabolism increased in sensory association cortices, conceivably related to the illusory phenomena sometimes experienced with ketamine. Further studies are needed to elucidate how these functional anatomical changes relate to the molecular mechanisms underlying ketamine’s rapid antidepressant effects.
Keywords: major depressive disorder, NMDA receptor antagonist, PET imaging, habenula, parahippocampal gyrus, insula
INTRODUCTION
Controlled clinical trials have demonstrated that a single intravenous infusion of the non-competitive N-methyl-D-aspartate (NMDA) antagonist ketamine has rapid antidepressant effects in patients with treatment-resistant major depressive disorder (MDD) (1, 2). The clinical data regarding ketamine’s antidepressant effect are supported by preclinical evidence showing antidepressant-like responses to ketamine and other NMDA antagonists in animal models (3–11).
The mechanisms underlying ketamine’s antidepressant effects conceivably involve altered glutamatergic signaling in neural circuits implicated in affective disorders. The assessment of cerebral glucose metabolism via positron emission tomography (PET) and [18F]-fluorodeoxyglucose (FDG) provides a relatively specific proxy measure of glutamatergic neurotransmission in humans, because the glucose metabolic signal is dominated by the uptake of glucose into glia in response to neuronal glutamate release (12–16). The [18F]-FDG signal also provides a robust and reproducible measure of metabolic activity in neural circuits.
In healthy humans studied immediately following ketamine administration, regional glucose metabolism assessed using 18FDG-PET increased in prefrontal cortex (PFC) (17), and blood flow assessed using 15O-H20 PET increased in the anterior cingulate cortex and the medial and inferior prefrontal cortices (18, 19). These 18FDG-PET data appear consistent with evidence from preclinical studies (20, 21) showing that ketamine administration leads acutely to increased glutamate release (19, 22). Proton magnetic resonance spectroscopy studies also support an association between ketamine administration and acute increases in cortical glutamate release in healthy humans (23, 24).
A BOLD-fMRI study of the acute effects of ketamine administration in healthy men reported that hemodynamic activity decreased in the ventromedial PFC, including orbitofrontal cortex and subgenual anterior cingulate cortex (sgACC), and increased in the posterior cingulate, thalamus, and temporal cortex (25). BOLD activity changes in ventromedial PFC correlated with the dissociative effects of ketamine. These studies examined the effects of ketamine during or immediately following infusion, during which ketamine produced psychotomimetic effects. In contrast, the antidepressant effects of ketamine administration appeared later, reaching significance about two hours post-infusion (2). Changes in neural activity seen during or immediately following ketamine infusion thus may be more likely to reflect neurophysiological changes associated with psychotomimetic phenomena. Also, based upon evidence that MDD is associated with abnormalities in glutamatergic transmission (10, 26, 27), changes in neural activity induced by ketamine may differ between depressed and healthy populations. To date, no studies have described the effects of ketamine on regional cerebral metabolism or blood flow in depressed individuals.
The extent to which neural changes associated with ketamine’s antidepressant effects resemble those of conventional antidepressant drugs remains unclear. It is conceivable that antidepressant treatments that appear diverse with respect to their primary receptor pharmacology may share common functional anatomical pathways that support the resolution of depressive symptoms. In the current study, we identified candidate structures of interest a priori, based upon studies reporting metabolic changes associated with other antidepressant treatments. These structures comprised the amygdala, sgACC, and habenula, where clinical and/or preclinical studies have reported reduced metabolic activity in response to antidepressant treatments (28–34).
Notably, the importance of the sgACC in MDD has been well established (see, for example, (32)). In addition, many forms of effective antidepressant treatment decrease glucose metabolism in the sgACC, indicating that this may be an important region in MDD symptomatology (reviewed in (30)). Activity in the sgACC during the performance of a variety of cognitive tasks has also been shown to change with effective antidepressant treatment (35). Similarly, the role of the amygdala in the pathophysiolgy of MDD has also been established (reviewed in (31)). As with the sgACC, effective antidepressant treatment appears to lower amygdala metabolism (29). Several studies have also reported changes in amygdalar-cortical connectivity with antidepressant treatment (36, 37). Animal studies also suggest that the amygdala is vital to plasticity changes induced by antidepressant agents (38). Finally, much recent evidence implicates the habenula in the modulation of antidepressant response. In animal models, inhibition of the lateral habenula (39), or depleting habenula transmitter release (40), reduce depressive-like behaviors. Moreover, deep brain stimulation (DBS) in the sgACC and the habenula has been associated with antidepressant response in treatment-refractory depressed subjects (41–43). Finally, metabolic or hemodynamic activity has been shown to increase in the sgACC, habenula, and amygdala during rapid induction of depressed mood using tryptophan and/or catecholamine depletion (44–48).
Based upon these findings, we hypothesized that by scanning individuals with MDD during a time frame consistent with the onset of ketamine’s antidepressant effects, we would observe decreased glucose metabolism in these regions. Post hoc analyses investigated the effects of ketamine on other structures via whole-brain voxel-wise analysis.
METHODS AND MATERIALS
Participants
Volunteers aged 18–65 years were recruited through physician referrals to the National Institute of Mental Health (NIMH) and by media advertisements. The participants (n=20) included males and females who met criteria for MDD (DSM-IV-TR). Patients had to have scored ≥22 on the Montgomery-Asberg Depression Rating Scale (MADRS (49)) at the time of both the baseline scan and the ketamine infusion, and were defined as treatment-resistant. Additional details regarding subject selection and screening, as well as the definition of treatment resistance appear in the Supplemental Methods.
Written informed consent was obtained as approved by the Combined Neuroscience Institutional Review Board and the Radiation Safety Committee at the National Institutes of Health (NIH).
Experimental design
Pharmacological intervention
Following screening, a two-week drug-free period, and baseline ratings, participants underwent open-label constant infusion of racemic ketamine hydrochloride (0.5 mg/kg IV) over 40 minutes via Baxter infusion pump (Deerfield, Illinois).
Assessment of clinical response to ketamine
Depressive symptoms were rated using the MADRS at baseline (60 minutes prior to infusion) and at 40, 80, 110, and 230 minutes post-ketamine infusion. The percent change between the −60 and 230 minute MADRS was selected a priori as the primary clinical outcome measure for correlation with imaging results. To assess ketamine-associated changes in other symptom domains, participants were administered the Brief Psychiatric Rating Scale (BPRS) (50) and the Clinician-Administered Dissociative States Scale (CADSS) (51) at the same time points. Responders were defined as those subjects experiencing at least a 50% decrease in MADRS at the 230-minute time point.
Image acquisition and analysis
Participants underwent a baseline scan performed one to three days before ketamine infusion, and a post-ketamine scan initiated approximately 120 minutes post-infusion. This timing was based upon the onset of antidepressant effects observed in our previous study in a similar population (2). Both scans were performed at approximately the same time of day on a GE Advance PET scanner (GE Medical Systems, Waukesha, Wisconsin) in 3D mode (35 contiguous slices, 4.25 mm plane separations; reconstructed resolution=6 mm full-width at half-maximum in all planes). Details regarding PET acquisition, preprocessing, and modeling appear in the Supplemental Methods.
To provide an anatomical framework for the PET image analysis, MRI scans were obtained using a 3.0-T scanner (Signa, GE Medical Systems) and 3D MPRAGE sequence (TE-2.982ms, TR=7.5ms, inversion time=725ms, voxel size=0.90×0.90×1.2 mm). Non-brain tissues were removed from the brain images using the brain extraction tool (BET) (52), then manually edited. The resulting whole brain images were segmented into gray matter, white matter, and cerebrospinal fluid (CSF) components using the FMRIB automated segmentation tool (FAST) (53), and separate binary mask images were created for each component.
To test a priori hypotheses involving small structures, an MRI-based region-of-interest (ROI) analysis was performed to assess metabolism in the amygdala, habenula, and sgACC. Using MEDx software (Medical Numerics, Sterling, VA), mean rCMRGlu measurements were obtained from predefined ROIs positioned on individual subjects’ MRI scans by a single investigator (PJC) and masked with the gray matter mask. To assess the specificity of metabolic data obtained in amygdala and habenula, ROI were placed in the anterior hippocampus and the medial thalamus adjacent to the ROI of primary interest. Thus, if significant results were found only in the amygdala and/or habenula, but not the hippocampus or thalamus, we could be more confident that our results were specific to our a priori regions, and not due to partial volume effects. Whole brain CMRGlu was obtained to assess the global effects of ketamine within the entire gray matter mask, and to normalize mean regional metabolic values. ROIs in the amygdala, sgACC, anterior hippocampus, and medial thalamus were placed as previously described (54). Details regarding habenula placement appear in the Supplemental Methods; a sample placement is shown in Figure 1.
Figure 1.
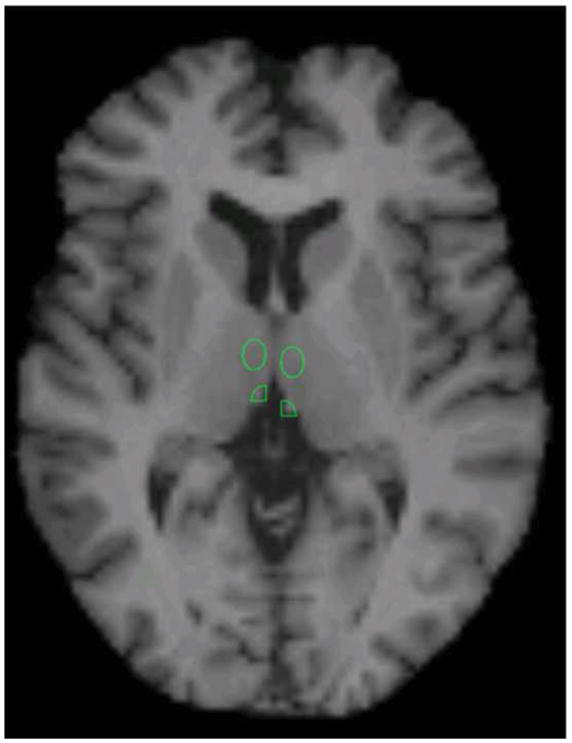
Region placement of the habenula on a representative subject. Medial thalamic region of interest (ROI) is also visible.
Statistics
The a priori hypotheses were tested using paired t-tests. In addition, metabolic changes between conditions were correlated with the percent change in MADRS scores from baseline to 230 minutes following ketamine administration to assess treatment-related effects. Given the preliminary nature of this study, and the small sample size, results are presented without correction for multiple comparisons. Effect sizes and confidence intervals are also reported.
To assess metabolic changes in other regions, voxel-wise analysis was performed post hoc using Statistical Parametric Mapping software (SPM5) (Wellcome Department of Imaging Neuroscience, London, UK) within MATLAB 6.0 (MathWorks Inc, Natick, MA). PET images were co-registered to the MRI scans and spatially normalized to the Montreal Neurological Institute (MNI) brain template. Images were filtered with a 6-mm Gaussian smoothing kernel to compensate for anatomic variability and misalignment error. All statistical models incorporated global normalization, whereby each image was divided by the mean of that image (as implemented in SPM5). Within SPM5, paired t-tests were performed using baseline and post-ketamine scans. To assess the metabolic correlates of clinical response to ketamine, the percent change in MADRS scores between baseline and 230 minutes was correlated with the change in metabolism. The MNI coordinates were nonlinearly translated to the stereotaxic spatial array of Talairach and Tournoux (http://imaging.mrc-cbu.com.ac.uk/downloads/MNI2tal/mni2tal.m), and brain atlases (55, 56) were consulted for localization. The uncorrected voxel threshold for the paired t-tests and correlational analyses was set at p<0. 05, but only those clusters that remained significant after stringent correction for multiple corrections using Gaussian random field theory are reported (57). In addition, we report clusters that overlap our a priori regions (amygdala, habenula, and subgenual ACC) when the peak voxel had an uncorrected p-value less that 0.005, and the extent of the cluster was greater than the “expected voxels per cluster”. Although this voxel extent threshold is not appropriate to use as a threshold by itself, we applied it as an additional control for our a priori regions. It should be noted that because all metabolic values were normalized by a global value, our findings reflect changes in relative but not absolute metabolism. For the sake of simplicity, however, we refer to “increased” or “decreased” metabolism throughout the text.
RESULTS
Behavioral response to ketamine
Twenty subjects (six females) with treatment-resistant MDD underwent ketamine infusion and both PET scan sessions (see Table 1 for demographic/clinical data). The mean decrease in MADRS scores between baseline and 230 minutes post-ketamine was 29.7% (+/− 28.0% SD). Six of the 20 subjects had a decrease in MADRS score ≥50% at 230 minutes. Details regarding the observed dissociative symptoms are reported in the Supplemental Results.
Table 1.
Demographic and clinical characteristics of the MDD sample
| TOTAL | Non-Responders N=14 |
Responders N=6 |
|||||
|---|---|---|---|---|---|---|---|
| n | % | n | % | n | % | p | |
|
| |||||||
| Gender (Female) | 6 | 30 | 4 | 29 | 2 | 33 | 0.83 |
| Mean | SD | Mean | SD | Mean | SD | p | |
| Age | 47.6 | 12.2 | 46.0 | 12.2 | 51.3 | 12.2 | 0.38 |
| Length of Illness (Years) | 26.2 | 12.8 | 27.6 | 12.4 | 22.8 | 14.2 | 0.46 |
| Length of Current Episode | 115.9 | 161.0 | 149.4 | 183.4 | 37.7 | 24.7 | 0.16 |
| MADRS | |||||||
| • Screening | 33.5 | 5.3 | 33.5 | 5.7 | 33.5 | 4.7 | 1.00 |
| • Baseline | 33.1 | 5.7 | 33.5 | 5.9 | 32.2 | 5.6 | 0.64 |
| • 40 Minutes | 18.7 | 8.2 | 20.7 | 8.5 | 14.0 | 5.3 | 0.09 |
| • 120 Minutes | 23.6 | 10.3 | 27.9 | 8.3 | 13.5 | 6.8 | 0.002 |
| • 230 Minutes | 23.4 | 10.6 | 28.3 | 8.6 | 11.8 | 2.6 | <.001 |
| • 1 Day | 23.2 | 12.1 | 27.7 | 11.0 | 12.7 | 6.9 | 0.007 |
| CADSS | |||||||
| • Baseline | 3.0 | 4.9 | 2.2 | 3.5 | 4.8 | 7.3 | 0.28 |
| • 40 Minutes | 23.0 | 19.7 | 24.3 | 17.0 | 20.0 | 26.3 | 0.67 |
| • 80 Minutes | 1.8 | 4.4 | 0.9 | 1.9 | 3.7 | 7.6 | 0.21 |
| • 120 Minutes | 0.9 | 2.8 | 0.4 | 1.1 | 2.2 | 4.8 | 0.19 |
| • 230 Minutes | 1.1 | 3.8 | 0.4 | 0.8 | 2.8 | 6.9 | 0.19 |
| • 1 Day | 1.0 | 2.5 | 0.6 | 1.4 | 1.7 | 4.1 | 0.41 |
| BPRS | |||||||
| • Baseline | 34.9 | 6.1 | 35.4 | 6.9 | 33.5 | 4.0 | 0.53 |
| • 40 Minutes | 29.5 | 8.0 | 32.2 | 8.0 | 23.7 | 4.0 | 0.03 |
| • 80 Minutes | 27.6 | 6.7 | 30.5 | 5.8 | 20.8 | 2.4 | 0.001 |
| • 120 Minutes | 27.0 | 5.2 | 29.0 | 4.6 | 22.3 | 3.3 | 0.005 |
| • 230 Minutes | 26.7 | 6.7 | 29.2 | 6.2 | 20.8 | 3.8 | 0.007 |
| • 1 Day | 28.0 | 5.9 | 30.2 | 5.5 | 22.7 | 2.7 | 0.005 |
Abbreviations: BPRS, Brief Psychiatric Rating Scale; CADSS, Clinician-Administered Dissociative States Scale; MADRS, Montgomery-Asberg Depression Ratings Scale; MDD, major depressive disorder; SD, standard deviation.
PET Results
Whole brain CMRGlu was successfully modeled in both pre- and post-treatment scans for 19 of the 20 subjects (mean CMRGlu=0.074 +/− 0.009 and 0.076 +/− 0.013 mg/min/mL, respectively). In one subject, a technical problem precluded acquisition of the absolute data, so this subject’s results were used only in analyses of the normalized PET data. Absolute whole brain metabolism did not differ between baseline and ketamine conditions (p=0.341). Relative to baseline, normalized metabolism decreased significantly following ketamine in the right habenula (p=0.023; Table 2). Normalized metabolism also increased in the right amygdala ROI (p=.04). Changes in sgACC, left amygdala, and left habenula ROI were not significant. Metabolism did not change significantly in control ROIs in the medial thalamus and hippocampus (p>0.2). No significant correlations were observed between change in metabolism and change in MADRS score in any a priori ROI.
Table 2.
Globally normalized (regional CMRGlu/ global CMRGlu) PET results before and after ketamine infusion for the MRI-based, a priori ROIs and their relevant control regions
| Baseline Normalized Metabolism | Post-Ketamine Normalized Metabolism | Area | |||||||||||
|---|---|---|---|---|---|---|---|---|---|---|---|---|---|
| Region | Mean | SD | Mean | SD | t | df | p | d | 95% C.I. | Mean | SD | ||
| Amygdala | Left | 0.839 | 0.066 | 0.835 | 0.105 | −0.16 | 18 | 0.878 | −0.07 | −1.06 | 0.92 | 176.96 | 21.85 |
| Right | 0.79 | 0.065 | 0.829 | 0.066 | 2.21 | 18 | 0.04 | 1.04 | 0.05 | 2.03 | 175.91 | 21.34 | |
| Habenula | Left | 1.072 | 0.174 | 1.06 | 0.186 | −0.36 | 18 | 0.724 | −0.17 | −1.16 | 0.82 | 14.06 | 5.97 |
| Right | 1.325 | 0.172 | 1.247 | 0.181 | −2.48 | 18 | 0.023 | −1.17 | −2.16 | −0.18 | 38.56 | 11.02 | |
| Subgenual ACC | Left | 1.091 | 0.09 | 1.093 | 0.072 | 0.16 | 18 | 0.872 | 0.08 | −0.91 | 1.07 | 1610.50 | 285.26 |
| Right | 1.074 | 0.09 | 1.063 | 0.086 | −0.77 | 18 | 0.452 | −0.36 | −1.35 | 0.63 | 1548.85 | 329.74 | |
| Hippocampus | Left | 0.865 | 0.077 | 0.874 | 0.073 | 0.54 | 18 | 0.599 | 0.25 | −0.74 | 1.24 | 206.58 | 22.97 |
| Right | 0.84 | 0.078 | 0.85 | 0.108 | 0.36 | 18 | 0.724 | 0.17 | −0.82 | 1.16 | 204.35 | 29.09 | |
| Medial Thalamus | Left | 1.291 | 0.168 | 1.288 | 0.151 | −0.11 | 18 | 0.915 | −0.05 | −1.04 | 0.94 | 137.11 | 30.64 |
| Right | 1.351 | 0.164 | 1.31 | 0.123 | −1.28 | 18 | 0.218 | −0.6 | −1.59 | 0.39 | 138.50 | 29.72 | |
Abbreviations: ACC, anterior cingulate cortex; rCMRGlu, regional cerebral metabolic rate of glucose metabolism; ROI, region of interest.
Voxel-wise analysis (N=20, Table 3, Figure 2) showed significant metabolic increases following ketamine infusion in occipital cortex, postcentral gyrus, and inferior parietal cortex. Conversely, metabolism decreased following ketamine in insula, ventrolateral prefrontal cortex (VLPFC), and dorsolateral PFC (DLPFC). In addition, clusters meeting our criteria for a priori regions were noted in the right habenula, bilateral ventral ACC and left amygdala.
Table 3.
Results of the voxelwise analysis identifying areas where normalized metabolism increased vs. decreased under ketamine.
| Regions of Metabolic Increase under Ketamine | |||||||
|---|---|---|---|---|---|---|---|
| MNI Coordinate | Peak Voxel | Cluster | |||||
| Region | X | Y | Z | t-value | Uncorrected p | Extent | Corrected p |
| R Occipital C | 34 | −88 | −12 | 5.40 | <0.001 | 4697 | <0.001 |
| R Postcentral G | 38 | −40 | 64 | 4.43 | <0.001 | ||
| L Occipital C | −22 | −48 | −10 | 4.76 | <0.001 | 3274 | 0.004 |
| L Inferior Parietal C | −40 | −84 | −10 | 4.39 | <0.001 | ||
| L Occipital C | −30 | −88 | 14 | 4.00 | <0.001 | ||
| Regions of Metabolic Decrease under Ketamine | |||||||
|---|---|---|---|---|---|---|---|
| MNI Coordinate | Peak Voxel | Cluster | |||||
| Region | X | Y | Z | t-value | Uncorrected p | Extent | Corrected p |
| R Insula | 40 | 6 | 14 | 5.92 | <0.001 | 2869 | 0.008 |
| R Ventrolateral PFC | 38 | 40 | 12 | 4.38 | <0.001 | ||
| R Dorsolateral PFC | 26 | 30 | 30 | 4.32 | <0.001 | ||
| R Habenula | 6 | −32 | 4 | 3.88 | <0.001 | 404 | -- |
| R Ventral ACC | 20 | 46 | −4 | 3.49 | 0.001 | 347 | -- |
| L Amygdala | −16 | −8 | −14 | 3.06 | 0.003 | 137 | -- |
| L Ventral ACC | −10 | 44 | 4 | 2.95 | 0.004 | 366 | -- |
Abbreviations: ACC, anterior cingulate cortex; C, cortex; G, gyrus; L, left; MNI, Montreal Neurological Institute coordinates; PFC, prefrontal cortex; R, right.
MNI coordinates indicate the distance (in millimeters) from the stereotaxic origin (anterior commissure), with X representing the lateral distance from the origin (positive numbers to the right), Y representing the anterior-posterior dimension (positive numbers anterior), and Z representing the dorsal-ventral dimension (positive numbers dorsal).
Figure 2.
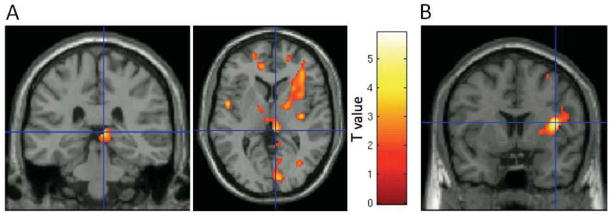
Coronal image sections obtained with a statistical parametric map of t-values software (SPM5) (Wellcome Department of Imaging Neuroscience, London, UK) illustrating key findings from voxelwise analysis of ketamine-induced metabolic changes in a group of individuals with treatment-resistant major depressive disorder (MDD; N=20). The color bar designates the corresponding voxel t-statistic value. Clusters are overlaid on a canonical single subject image, with t-maps thresholded to show only the relevant cluster. (A) Glucose metabolism decreased in the right habenula. The peak voxel from the habenula cluster in the voxelwise analysis shown here is located at coordinates 6, −32, 4 (x, y, z). This voxelwise finding corresponds with the finding in the region of interest (ROI) analysis of a significant decrease in the right habenula ROI following ketamine infusion (Table 2). (B) Decreased metabolism in the right insula was the most robust (i.e., peak t-value) finding in the voxelwise analysis (Table 4).
In the voxelwise correlational analysis, improvement in depressive symptoms significantly correlated with increasing metabolism in superior and middle temporal gyri (STG/MTG), and cerebellum. Conversely, clinical improvement significantly correlated with decreasing metabolism in more ventral and medial loci within the STG/MTG, along with parahippocampal gyrus (PHG), inferior parietal cortex, and temporo-occipital cortex (Table 4). An additional cluster meeting our criteria for a priori regions was noted in the ventral ACC.
Table 4.
Results of the voxelwise analysis identifying areas where changes in metabolism correlated with changes in MADRS ratings.
| Areas where metabolic change correlated inversely with changes in depression ratings | |||||||
|---|---|---|---|---|---|---|---|
| MNI Coordinate | Peak Voxel | Cluster | |||||
| Region | X | Y | Z | t-value | Uncorrected p | Extent | Corrected p |
| R Superior Temporal G | 68 | −34 | 10 | 5.27 | <0.001 | 15511 | <0.001 |
| R Middle Temporal G | 64 | −28 | 0 | 5.16 | <0.001 | ||
| L Cerebellum | −50 | −58 | −32 | 4.60 | <0.001 | 2854 | 0.020 |
| R Middle Temporal G | 54 | 2 | −22 | 3.93 | <0.001 | 3670 | 0.004 |
| Areas where metabolic change correlated directly with changes in depression ratings | |||||||
|---|---|---|---|---|---|---|---|
| MNI Coordinate | Peak Voxel | Cluster | |||||
| Region | X | Y | Z | t-value | Uncorrected p | Extent | Corrected p |
| R Superior/Middle Temporal G | 46 | −42 | −6 | 5.57 | <0.001 | 2467 | 0.045 |
| R Parahippocampal G | 30 | −20 | −28 | 3.92 | 0.001 | ||
| R Hippocampus | 38 | −14 | −16 | 3.49 | 0.001 | ||
| L Inferior Parietal C | −32 | −54 | 32 | 4.99 | <0.001 | 5425 | <0.001 |
| L Temporo-Occipital C | −42 | −66 | −6 | 4.85 | <0.001 | ||
| Ventral ACC | 0 | 48 | 4 | 3.44 | 0.001 | 284 | -- |
Abbreviations: ACC, anterior cingulate cortex; C, cortex; G, gyrus; L, left; MNI, Montreal Neurological Institute coordinates; PFC, prefrontal cortex; R, right.
MNI coordinates indicate the distance (in millimeters) from the stereotaxic origin (anterior commissure), with X representing the lateral distance from the origin (positive numbers to the right), Y representing the anterior-posterior dimension (positive numbers anterior), and Z representing the dorsal-ventral dimension (positive numbers dorsal).
DISCUSSION
This preliminary study is the first to describe the functional anatomical correlates of the rapid antidepressant effects of ketamine in patients with MDD. Ketamine administration did not significantly affect whole brain metabolism during the time frame assessed herein, suggesting that the delay between ketamine infusion and FDG injection was sufficiently long to allow the acute effects of ketamine to subside. We predicted that metabolism would decrease under ketamine in the amygdala, habenula and sgACC ROIs. Partly consistent with our hypothesis, we found that the normalized metabolism decreased in the right habenula and right amygdala. While metabolism also decreased nominally in the adjacent ROI in the medial thalamus, the smaller magnitude and non-significance of this change confirmed the specificity of the difference in the habenula. Consistent with the results of the ROI analysis, the voxel-wise analysis showed reduced metabolism under ketamine in a cluster that included the right habenula. The voxel-wise analysis also showed significant metabolic decreases under ketamine in areas within the ventrolateral and dorsolateral PFC.
Notably, the habenula plays a key role in the long-term modification of monoamine transmission in response to stress (58, 59), and in the suppression of dopamine cell activity following omission of an expected reward (60, 61). In this latter role, habenular activity is thought to drive the “frustration” response associated with having an unfulfilled expectation of reward. Increased habenular metabolism occurs in animal models of stress (62) and depression (34, 63). Moreover, antidepressant drugs attenuated the metabolic response to experimental manipulations that induced behavioral analogs of depression (34), and habenular lesions ameliorated behavioral response to repeated stress (58, 64). In humans with mood disorders, both gray matter volume and neuronal counts are decreased in the habenula (65, 66). Finally, studies noting that habenular activity increased during induction of depressed mood via tryptophan depletion (44, 45) and that DBS in the habenula had antidepressant effects in treatment-resistant MDD (42, 43) support the relevance of reduced habenular metabolism to rapid antidepressant response. The voxel-wise results also showed a small cluster in the vicinity of the habenula, further confirming our ROI results. It should also be noted that the area reported for the right habenula ROI is larger than the left. This should not be interpreted as an actual difference in volume, although one may exist, because this is simply the volume of grey matter voxels identified within the predefined ROI and not the absolute area. Differences in contrast between the left and right habenula may have affected this measure. Nevertheless, the habenula does appear to show significant laterality effects in some species (67), although the nature and significance of this effect in humans in unknown.
Preclinical studies demonstrated that ketamine acutely induced spine formation and synaptogenesis in the medial PFC (mPFC) of rats via the mammalian target of rapamycin (mTOR) pathway (11) in a time frame consistent with the antidepressant effects of ketamine. Li and colleagues also showed that modulation of mPFC afferents onto lateral habenula neurons produced antidepressant effects in rat models of depression (40). It is thus conceivable that ketamine-induced neuroplasticity changes in mPFC may at least partially underlie the decreased metabolism we observed in right habenula.
Metabolic changes were also noted in the right amygdala ROI, although in the opposite direction to our hypothesis. The difference may reflect the fact that the ROI targeted the lateral amygdala nuclei. In support of this theory, the voxel-wise analysis identified an area of reduced metabolism under ketamine in left amygdala, specifically in the vicinity of the basal and central nuclei (56). A variety of antidepressant treatments have been associated with decreased amygdalar activity (29, 68–70), and left amygdala metabolism has been reported to correlate positively with severity of depression (31). Because the lateral amygdalar nucleus—which serves as the sensory interface for the amygdala complex (71)—was targeted in the ROI analysis, the increased metabolism observed in the right amygdala ROI could conceivably reflect heightened sensory input to the lateral nuclei following ketamine. In addition, there is evidence for laterality differences in amygdalar function (72), although these are poorly understood.
In the voxel-wise correlational analysis the areas where we observed the most significant correlations between improvement in depressive symptoms and metabolic changes were in the superior and middle temporal gyri. These findings were complex, however, as in one set of right STG and MTG areas increasing metabolism correlated with lower depression severity ratings (see Table 4), whereas in a more medial and caudal STG area and a more ventral and anterior MTG area the correlation was in the opposite direction.
Decreasing metabolism post-ketamine in the right PHG correlated significantly with improvement in depressive symptoms (Table 4). Similarly, Kennedy and colleagues found that decreased metabolism in the right PHG was associated with successful paroxetine treatment (73). In addition, decreased grey matter volume has been reported in the PHG in MDD (74–76). Of particular note given the potential role of BDNF in ketamine’s mechanism of action, the 66Met allele of the BDNF gene was associated with decreased PHG volume (77). The PHG, rostral STG, and amygdala share extensive monosynaptic connections with medial PFC regions including the ACC and ventromedial PFC (BA 10) to form part of an extended “visceromotor” network that modulates the visceral, emotional, and behavioral aspects of emotional behavior (78). It is noteworthy that the reduced metabolic activity in this extended network under ketamine is associated with improved depressive symptoms (Tables 3, 4). Furthermore, decreased metabolism in the right insula correlated with improvement in depressive symptoms. These findings echo those of Mayberg and colleagues (33) and Kennedy and colleagues (73), which found that activity decreased in the anterior and posterior insula in MDD subjects following successful treatment with paroxetine.
Following ketamine, we observed widespread increases in metabolism in sensorimotor and sensory association cortices. These changes may conceivably relate to the sensory and dissociative phenomena induced by ketamine. Nevertheless, these ketamine-induced illusory phenomena had resolved nearly two hours prior to 18FDG injection. Alternatively, these increases in sensory cortices represent a reversal of baseline decreases in these areas previously reported in subjects with depression (79). Notably, components of the extended medial prefrontal network constitute a “default” network of cortical areas implicated in self-referential functions and the patterns of physiological activity within these areas in depression have been hypothesized to relate to self-absorption or obsessive ruminations (29, 80–82). It is conceivable that, as components of this default system/visceromotor network are deactivated under ketamine, depressive symptoms improve and various sensory cortices reciprocally increase their activity (79).
It is also interesting to note that our ROI findings were confined to the right hemisphere. While there is some evidence that the networks involved in mood disorders may have differential function based on laterality, this may simply be the result of limited power due to the small sample size.
Several methodological limitations of our study merit comment. First, ketamine was administered in an open-label design, and the participants were not compared to a parallel control sample randomized to placebo. This reflects our intention to limit the number of subjects exposed to ionizing radiation in this preliminary study. It is also important to note that because the antidepressant effects of ketamine were previously established in independent, randomized, placebo-controlled trials (1, 2), it is unlikely that the effects observed here are due solely to the placebo effect. Although a cross-over design would have permitted exploration of placebo effects with a similar number of subjects, this would have added the potential confound of carryover and/or order effects. Thus, we determined that the current open-label design was best suited to test our hypotheses. Nevertheless, some contribution of a placebo effect cannot be eliminated. In addition, this study design did not allow us to disentangle which effects were due to ketamine specifically versus which were consequent to a general improvement in mood. Future studies may consider incorporating a placebo and/or active comparator control in order to address these issues. Another limitation of this study is the subject sample size, which did not allow for comparisons between responders and non-responders. The proportion of responders in the present study—30%—is lower than reported in a previous study of ~52% (2), but not substantially different from another study (83) that found a response rate of 40%. A likely reason for the lower response rates in later cohorts is that subjects included in later studies were more treatment-resistant; for instance, in our first study, 22% had failed ECT, whereas in the present study 40% had failed ECT. The correlational approach using the changes in MADRS score as an additional regressor in the SPM analysis was meant to partially address this issue. Another key point is that the subjects in this study were treatment-resistant, so the results may not generalize to other samples of depressed subjects. Finally, there is the issue of dissociative symptoms potentially altering the findings. We scheduled the PET scanning procedures to begin 120 minutes after the ketamine infusion; psychotomimetic effects are typically absent before 80 minutes post-infusion. Although in no cases were dissociative effects present at the time of scanning, we cannot rule out carry-over effects.
A technical limitation of our methods is that the spatial resolution of PET is low relative to the small size of the habenula. We thus relied upon an MRI-based ROI method to test a priori hypotheses in small structures. This approach allowed accurate placement of these ROIs over the target structure in each subject to accommodate inter-individual differences in anatomy. To establish the specificity of our results we placed ROI in the adjacent medial thalamus—where we did not expect to see differences in metabolism following ketamine infusion—to ensure that any change observed in the habenula ROI did not reflect spillover from a difference in the thalamus. Nevertheless, the metabolism measured over the habenula ROI is influenced by partial volume effects from neighboring structures. Crucially, the voxel-wise analysis confirmed the conclusions of the ROI analysis by identifying a cluster that included the habenula. The stereotaxic coordinates for the peak metabolic change in this vicinity were approximately 4.4 mm from the center of the habenula in the Jurgen Mai atlas, and the cluster extended well into the habenula (56) (Figure 1, Table 4). It should be noted that due to smoothing and normalization to a standard coordinate space, the cluster of suprathreshold voxel t-values extends beyond the habenula boundaries. Notably, glucose metabolism has the advantage of assessing those changes in glutamatergic transmission that may result from ketamine administration without being confounded by nonspecific effects on cerebrovascular function.
Finally, our imaging findings may not be generalizable to imaging at other time-points following ketamine administration. We timed the [18F]FDG uptake period to coincide with the epoch when we observed the initial decrement in depression-ratings under ketamine relative to placebo in our previous study (2). It remains unclear how imaging results acquired earlier or later following ketamine administration may differ from those reported herein.
In conclusion, decreased metabolism in the right habenula, PHG, and other components of the extended medial and orbital prefrontal networks were associated with rapid antidepressant effects of ketamine in treatment-resistant MDD subjects. It appears that ketamine may exert its rapid antidepressant effect in part by regulating aberrant activity in these networks. Taken together, our findings are compatible with hypotheses based on preclinical data indicating that ketamine’s rapid antidepressant effects may be mediated by synaptic plasticity within neural circuits that function abnormally in depression. Future studies exploring the relationship between these changes in synaptic plasticity and the function of the extended medial prefrontal network may elucidate the mechanisms underlying rapid antidepressant response to ketamine.
Supplementary Material
Acknowledgments
This work was supported in part by the Intramural Research Program of the National Institute of Mental Health, National Institutes of Health (IRP-NIMH-NIH). Ioline Henter provided excellent editorial assistance.
Footnotes
Financial Disclosures: This work was supported in part by the Intramural Research Program of the National Institute of Mental Health, National Institutes of Health (IRP-NIMH-NIH). Drs. Manji and Zarate are listed as co-inventors on a patent for the use of ketamine in major depression and have assigned their patent rights on ketamine to the U.S. government. Dr. Manji is currently an employee of Johnson & Johnson Pharmaceuticals. Dr. Drevets has consulted for Pfizer Pharmaceuticals, Johnson and Johnson Pharmaceuticals, Eisai, Inc., and Myriad/ Rules Based Medicine, Inc. All other authors report no biomedical financial interests or potential conflicts of interest.
Publisher's Disclaimer: This is a PDF file of an unedited manuscript that has been accepted for publication. As a service to our customers we are providing this early version of the manuscript. The manuscript will undergo copyediting, typesetting, and review of the resulting proof before it is published in its final citable form. Please note that during the production process errors may be discovered which could affect the content, and all legal disclaimers that apply to the journal pertain.
References
- 1.Berman RM, Cappiello A, Anand A, Oren DA, Heninger GR, Charney DS, et al. Antidepressant effects of ketamine in depressed patients. Biol Psychiatry. 2000;47:351–354. doi: 10.1016/s0006-3223(99)00230-9. [DOI] [PubMed] [Google Scholar]
- 2.Zarate CA, Jr, Singh JB, Carlson PJ, Brutsche NE, Ameli R, Luckenbaugh DA, et al. A randomized trial of an N-methyl-D-aspartate antagonist in treatment-resistant major depression. Arch Gen Psychiatry. 2006;63:856–864. doi: 10.1001/archpsyc.63.8.856. [DOI] [PubMed] [Google Scholar]
- 3.Trullas R, Skolnick P. Functional antagonists at the NMDA receptor complex exhibit antidepressant actions. Eur J Pharmacol. 1990;185:1–10. doi: 10.1016/0014-2999(90)90204-j. [DOI] [PubMed] [Google Scholar]
- 4.Meloni D, Gambarana C, De Montis MG, Dal Pra P, Taddei I, Tagliamonte A. Dizocilpine antagonizes the effect of chronic imipramine on learned helplessness in rats. Pharmacol Biochem Behav. 1993;46:423–426. doi: 10.1016/0091-3057(93)90374-3. [DOI] [PubMed] [Google Scholar]
- 5.Moryl E, Danysz W, Quack G. Potential antidepressive properties of amantadine, memantine and bifemelane. Pharmacol Toxicol. 1993;72:394–397. doi: 10.1111/j.1600-0773.1993.tb01351.x. [DOI] [PubMed] [Google Scholar]
- 6.Papp M, Moryl E. Antidepressant activity of non-competitive and competitive NMDA receptor antagonists in a chronic mild stress model of depression. Eur J Pharmacol. 1994;263:1–7. doi: 10.1016/0014-2999(94)90516-9. [DOI] [PubMed] [Google Scholar]
- 7.Layer RT, Popik P, Olds T, Skolnick P. Antidepressant-like actions of the polyamine site NMDA antagonist, eliprodil (SL-82.0715) Pharmacol Biochem Behav. 1995;52:621–627. doi: 10.1016/0091-3057(95)00155-p. [DOI] [PubMed] [Google Scholar]
- 8.Przegalinski E, Tatarczynska E, Deren-Wesolek A, Chojnacka-Wojcik E. Antidepressant-like effects of a partial agonist at strychnine-insensitive glycine receptors and a competitive NMDA receptor antagonist. Neuropharmacology. 1997;36:31–37. doi: 10.1016/s0028-3908(96)00157-8. [DOI] [PubMed] [Google Scholar]
- 9.Yilmaz A, Schulz D, Aksoy A, Canbeyli R. Prolonged effect of an anesthetic dose of ketamine on behavioral despair. Pharmacol Biochem Behav. 2002;71:341–344. doi: 10.1016/s0091-3057(01)00693-1. [DOI] [PubMed] [Google Scholar]
- 10.Sanacora G, Zarate CA, Krystal JH, Manji HK. Targeting the glutamatergic system to develop novel, improved therapeutics for mood disorders. Nat Rev Drug Discov. 2008;7:426–437. doi: 10.1038/nrd2462. [DOI] [PMC free article] [PubMed] [Google Scholar]
- 11.Li N, Lee B, Liu RJ, Banasr M, Dwyer JM, Iwata M, et al. mTOR-dependent synapse formation underlies the rapid antidepressant effects of NMDA antagonists. Science. 2010;329:959–964. doi: 10.1126/science.1190287. [DOI] [PMC free article] [PubMed] [Google Scholar]
- 12.Shulman RG, Rothman DL. Interpreting functional imaging studies in terms of neurotransmitter cycling. Proc Natl Acad Sci U S A. 1998;95:11993–11998. doi: 10.1073/pnas.95.20.11993. [DOI] [PMC free article] [PubMed] [Google Scholar]
- 13.Sibson NR, Dhankhar A, Mason GF, Rothman DL, Behar KL, Shulman RG. Stoichiometric coupling of brain glucose metabolism and glutamatergic neuronal activity. Proc Natl Acad Sci U S A. 1998;95:316–321. doi: 10.1073/pnas.95.1.316. [DOI] [PMC free article] [PubMed] [Google Scholar]
- 14.Magistretti PJ, Pellerin L. Astrocytes Couple Synaptic Activity to Glucose Utilization in the Brain. News Physiol Sci. 1999;14:177–182. doi: 10.1152/physiologyonline.1999.14.5.177. [DOI] [PubMed] [Google Scholar]
- 15.Rothman DL, Sibson NR, Hyder F, Shen J, Behar KL, Shulman RG. In vivo nuclear magnetic resonance spectroscopy studies of the relationship between the glutamate-glutamine neurotransmitter cycle and functional neuroenergetics. Philos Trans R Soc Lond B Biol Sci. 1999;354:1165–1177. doi: 10.1098/rstb.1999.0472. [DOI] [PMC free article] [PubMed] [Google Scholar]
- 16.Shen J, Petersen KF, Behar KL, Brown P, Nixon TW, Mason GF, et al. Determination of the rate of the glutamate/glutamine cycle in the human brain by in vivo 13C NMR. Proc Natl Acad Sci U S A. 1999;96:8235–8240. doi: 10.1073/pnas.96.14.8235. [DOI] [PMC free article] [PubMed] [Google Scholar]
- 17.Breier A, Malhotra AK, Pinals DA, Weisenfeld NI, Pickar D. Association of ketamine-induced psychosis with focal activation of the prefrontal cortex in healthy volunteers. Am J Psychiatry. 1997;154:805–811. doi: 10.1176/ajp.154.6.805. [DOI] [PubMed] [Google Scholar]
- 18.Holcomb HH, Lahti AC, Medoff DR, Weiler M, Tamminga CA. Sequential regional cerebral blood flow brain scans using PET with H2(15)O demonstrate ketamine actions in CNS dynamically. Neuropsychopharmacology. 2001;25:165–172. doi: 10.1016/S0893-133X(01)00229-9. [DOI] [PubMed] [Google Scholar]
- 19.Holcomb HH, Lahti AC, Medoff DR, Cullen T, Tamminga CA. Effects of noncompetitive NMDA receptor blockade on anterior cingulate cerebral blood flow in volunteers with schizophrenia. Neuropsychopharmacology. 2005;30:2275–2282. doi: 10.1038/sj.npp.1300824. [DOI] [PubMed] [Google Scholar]
- 20.Itoh T, Wakahara S, Nakano T, Suzuki K, Kobayashi K, Inoue O. Effects of anesthesia upon 18F-FDG uptake in rhesus monkey brains. Ann Nucl Med. 2005;19:373–377. doi: 10.1007/BF03027401. [DOI] [PubMed] [Google Scholar]
- 21.Littlewood CL, Jones N, O’Neill MJ, Mitchell SN, Tricklebank M, Williams SC. Mapping the central effects of ketamine in the rat using pharmacological MRI. Psychopharmacology (Berl) 2006;186:64–81. doi: 10.1007/s00213-006-0344-0. [DOI] [PubMed] [Google Scholar]
- 22.Moghaddam B, Adams B, Verma A, Daly D. Activation of glutamatergic neurotransmission by ketamine: a novel step in the pathway from NMDA receptor blockade to dopaminergic and cognitive disruptions associated with the prefrontal cortex. J Neurosci. 1997;17:2921–2927. doi: 10.1523/JNEUROSCI.17-08-02921.1997. [DOI] [PMC free article] [PubMed] [Google Scholar]
- 23.Rowland LM, Bustillo JR, Mullins PG, Jung RE, Lenroot R, Landgraf E, et al. Effects of ketamine on anterior cingulate glutamate metabolism in healthy humans: a 4-T proton MRS study. Am J Psychiatry. 2005;162:394–396. doi: 10.1176/appi.ajp.162.2.394. [DOI] [PubMed] [Google Scholar]
- 24.Stone JM, Dietrich C, Edden R, Mehta MA, De Simoni S, Reed LJ, et al. Ketamine effects on brain GABA and glutamate levels with 1H-MRS: relationship to ketamine-induced psychopathology. Mol Psychiatry. 2012;17:664–665. doi: 10.1038/mp.2011.171. [DOI] [PMC free article] [PubMed] [Google Scholar]
- 25.Deakin JF, Lees J, McKie S, Hallak JE, Williams SR, Dursun SM. Glutamate and the neural basis of the subjective effects of ketamine: a pharmaco-magnetic resonance imaging study. Arch Gen Psychiatry. 2008;65:154–164. doi: 10.1001/archgenpsychiatry.2007.37. [DOI] [PubMed] [Google Scholar]
- 26.Drevets WC, Price JL, Furey ML. Brain structural and functional abnormalities in mood disorders: implications for neurocircuitry models of depression. Brain Struct Funct. 2008;213:93–118. doi: 10.1007/s00429-008-0189-x. [DOI] [PMC free article] [PubMed] [Google Scholar]
- 27.Krystal JH, Sanacora G, Blumberg H, Anand A, Charney DS, Marek G, et al. Glutamate and GABA systems as targets for novel antidepressant and mood-stabilizing treatments. Mol Psychiatry. 2002;7(Suppl 1):S71–80. doi: 10.1038/sj.mp.4001021. [DOI] [PubMed] [Google Scholar]
- 28.Victor TA, Furey ML, Fromm SJ, Ohman A, Drevets WC. Relationship between amygdala responses to masked faces and mood state and treatment in major depressive disorder. Arch Gen Psychiatry. 2010;67:1128–1138. doi: 10.1001/archgenpsychiatry.2010.144. [DOI] [PMC free article] [PubMed] [Google Scholar]
- 29.Drevets WC, Bogers W, Raichle ME. Functional anatomical correlates of antidepressant drug treatment assessed using PET measures of regional glucose metabolism. Eur Neuropsychopharmacol. 2002;12:527–544. doi: 10.1016/s0924-977x(02)00102-5. [DOI] [PubMed] [Google Scholar]
- 30.Drevets WC, Savitz J, Trimble M. The subgenual anterior cingulate cortex in mood disorders. CNS Spectr. 2008;13:663–681. doi: 10.1017/s1092852900013754. [DOI] [PMC free article] [PubMed] [Google Scholar]
- 31.Price JL, Drevets WC. Neurocircuitry of mood disorders. Neuropsychopharmacology. 2010;35:192–216. doi: 10.1038/npp.2009.104. [DOI] [PMC free article] [PubMed] [Google Scholar]
- 32.Drevets WC, Price JL, Simpson JR, Jr, Todd RD, Reich T, Vannier M, et al. Subgenual prefrontal cortex abnormalities in mood disorders. Nature. 1997;386:824–827. doi: 10.1038/386824a0. [DOI] [PubMed] [Google Scholar]
- 33.Mayberg HS, Liotti M, Brannan SK, McGinnis S, Mahurin RK, Jerabek PA, et al. Reciprocal limbic-cortical function and negative mood: converging PET findings in depression and normal sadness. Am J Psychiatry. 1999;156:675–682. doi: 10.1176/ajp.156.5.675. [DOI] [PubMed] [Google Scholar]
- 34.Caldecott-Hazard S, Mazziotta J, Phelps M. Cerebral correlates of depressed behavior in rats, visualized using 14C-2-deoxyglucose autoradiography. J Neurosci. 1988;8:1951–1961. doi: 10.1523/JNEUROSCI.08-06-01951.1988. [DOI] [PMC free article] [PubMed] [Google Scholar]
- 35.Keedwell PA, Drapier D, Surguladze S, Giampietro V, Brammer M, Phillips M. Neural markers of symptomatic improvement during antidepressant therapy in severe depression: subgenual cingulate and visual cortical responses to sad, but not happy, facial stimuli are correlated with changes in symptom score. J Psychopharmacol. 2009;23:775–788. doi: 10.1177/0269881108093589. [DOI] [PubMed] [Google Scholar]
- 36.Chen CH, Suckling J, Ooi C, Fu CH, Williams SC, Walsh ND, et al. Functional coupling of the amygdala in depressed patients treated with antidepressant medication. Neuropsychopharmacology. 2008;33:1909–1918. doi: 10.1038/sj.npp.1301593. [DOI] [PubMed] [Google Scholar]
- 37.McCabe C, Mishor Z. Antidepressant medications reduce subcortical-cortical resting-state functional connectivity in healthy volunteers. Neuroimage. 2011;57:1317–1323. doi: 10.1016/j.neuroimage.2011.05.051. [DOI] [PMC free article] [PubMed] [Google Scholar]
- 38.Castro JE, Varea E, Marquez C, Cordero MI, Poirier G, Sandi C. Role of the amygdala in antidepressant effects on hippocampal cell proliferation and survival and on depression-like behavior in the rat. PLoS One. 2010;5:e8618. doi: 10.1371/journal.pone.0008618. [DOI] [PMC free article] [PubMed] [Google Scholar]
- 39.Winter C, Vollmayr B, Djodari-Irani A, Klein J, Sartorius A. Pharmacological inhibition of the lateral habenula improves depressive-like behavior in an animal model of treatment resistant depression. Behav Brain Res. 2011;216:463–465. doi: 10.1016/j.bbr.2010.07.034. [DOI] [PubMed] [Google Scholar]
- 40.Li B, Piriz J, Mirrione M, Chung C, Proulx CD, Schulz D, et al. Synaptic potentiation onto habenula neurons in the learned helplessness model of depression. Nature. 2011;470:535–539. doi: 10.1038/nature09742. [DOI] [PMC free article] [PubMed] [Google Scholar]
- 41.Mayberg HS, Lozano AM, Voon V, McNeely HE, Seminowicz D, Hamani C, et al. Deep brain stimulation for treatment-resistant depression. Neuron. 2005;45:651–660. doi: 10.1016/j.neuron.2005.02.014. [DOI] [PubMed] [Google Scholar]
- 42.Sartorius A, Kiening KL, Kirsch P, von Gall CC, Haberkorn U, Unterberg AW, et al. Remission of major depression under deep brain stimulation of the lateral habenula in a therapy-refractory patient. Biol Psychiatry. 2010;67:e9–e11. doi: 10.1016/j.biopsych.2009.08.027. [DOI] [PubMed] [Google Scholar]
- 43.Sartorius A, Henn FA. Deep brain stimulation of the lateral habenula in treatment resistant major depression. Med Hypotheses. 2007;69:1305–1308. doi: 10.1016/j.mehy.2007.03.021. [DOI] [PubMed] [Google Scholar]
- 44.Morris JS, Smith KA, Cowen PJ, Friston KJ, Dolan RJ. Covariation of activity in habenula and dorsal raphe nuclei following tryptophan depletion. Neuroimage. 1999;10:163–172. doi: 10.1006/nimg.1999.0455. [DOI] [PubMed] [Google Scholar]
- 45.Roiser JP, Levy J, Fromm SJ, Nugent AC, Talagala SL, Hasler G, et al. The effects of tryptophan depletion on neural responses to emotional words in remitted depression. Biol Psychiatry. 2009;66:441–450. doi: 10.1016/j.biopsych.2009.05.002. [DOI] [PMC free article] [PubMed] [Google Scholar]
- 46.Neumeister A, Nugent AC, Waldeck T, Geraci M, Schwarz M, Bonne O, et al. Neural and behavioral responses to tryptophan depletion in unmedicated patients with remitted major depressive disorder and controls. Arch Gen Psychiatry. 2004;61:765–773. doi: 10.1001/archpsyc.61.8.765. [DOI] [PubMed] [Google Scholar]
- 47.Neumeister A, Hu XZ, Luckenbaugh DA, Schwarz M, Nugent AC, Bonne O, et al. Differential effects of 5-HTTLPR genotypes on the behavioral and neural responses to tryptophan depletion in patients with major depression and controls. Arch Gen Psychiatry. 2006;63:978–986. doi: 10.1001/archpsyc.63.9.978. [DOI] [PubMed] [Google Scholar]
- 48.Hasler G, Fromm S, Carlson PJ, Luckenbaugh DA, Waldeck T, Geraci M, et al. Neural response to catecholamine depletion in unmedicated subjects with major depressive disorder in remission and healthy subjects. Arch Gen Psychiatry. 2008;65:521–531. doi: 10.1001/archpsyc.65.5.521. [DOI] [PMC free article] [PubMed] [Google Scholar]
- 49.Montgomery SA, Smeyatsky N, de Ruiter M, Montgomery DB. Profiles of antidepressant activity with the Montgomery-Asberg Depression Rating Scale. Acta Psychiatr Scand Suppl. 1985;320:38–42. doi: 10.1111/j.1600-0447.1985.tb08073.x. [DOI] [PubMed] [Google Scholar]
- 50.Gorham DR, Overall JE. Drug-action profiles based on an abbreviated psychiatric rating scale. J Nerv Ment Dis. 1960;131:528–535. doi: 10.1097/00005053-196012000-00007. [DOI] [PubMed] [Google Scholar]
- 51.Bremner JD, Krystal JH, Putnam FW, Southwick SM, Marmar C, Charney DS, et al. Measurement of dissociative states with the Clinician-Administered Dissociative States Scale (CADSS) J Trauma Stress. 1998;11:125–136. doi: 10.1023/A:1024465317902. [DOI] [PubMed] [Google Scholar]
- 52.Smith SM. Fast robust automated brain extraction. Hum Brain Mapp. 2002;17:143–155. doi: 10.1002/hbm.10062. [DOI] [PMC free article] [PubMed] [Google Scholar]
- 53.Zhang Y, Brady M, Smith S. Segmentation of brain MR images through a hidden Markov random field model and the expectation-maximization algorithm. IEEE Trans Med Imaging. 2001;20:45–57. doi: 10.1109/42.906424. [DOI] [PubMed] [Google Scholar]
- 54.Nugent AC, Neumeister A, Goldman D, Herscovitch P, Charney DS, Drevets WC. Serotonin transporter genotype and depressive phenotype determination by discriminant analysis of glucose metabolism under acute tryptophan depletion. Neuroimage. 2008;43:764–774. doi: 10.1016/j.neuroimage.2008.07.040. [DOI] [PMC free article] [PubMed] [Google Scholar]
- 55.Talairach J, Tournoux P. Co-planar Stereotaxic Atlas of the Human Brain. New York, NY: Thieme Medical Publishers; 1988. [Google Scholar]
- 56.Mai JK, Assheuer J, Paxinos G. Atlas of the Human Brain. San Diego, CA: Elsevier Academic Press; 2004. [Google Scholar]
- 57.Worsley KJ, Marrett S, Neelin P, Vandal AC, Friston KJ, Evans AC. A unified statistical approach for determining significant signals in images of cerebral activation. Hum Brain Mapp. 1996;4:58–73. doi: 10.1002/(SICI)1097-0193(1996)4:1<58::AID-HBM4>3.0.CO;2-O. [DOI] [PubMed] [Google Scholar]
- 58.Amat J, Sparks PD, Matus-Amat P, Griggs J, Watkins LR, Maier SF. The role of the habenular complex in the elevation of dorsal raphe nucleus serotonin and the changes in the behavioral responses produced by uncontrollable stress. Brain Res. 2001;917:118–126. doi: 10.1016/s0006-8993(01)02934-1. [DOI] [PubMed] [Google Scholar]
- 59.Thornton EW, Bradbury GE. Effort and stress influence the effect of lesion of the habenula complex in one-way active avoidance learning. Physiol Behav. 1989;45:929–935. doi: 10.1016/0031-9384(89)90217-5. [DOI] [PubMed] [Google Scholar]
- 60.Shepard PD, Holcomb HH, Gold JM. Schizophrenia in translation: the presence of absence: habenular regulation of dopamine neurons and the encoding of negative outcomes. Schizophr Bull. 2006;32:417–421. doi: 10.1093/schbul/sbj083. [DOI] [PMC free article] [PubMed] [Google Scholar]
- 61.Ullsperger M, von Cramon DY. Error monitoring using external feedback: specific roles of the habenular complex, the reward system, and the cingulate motor area revealed by functional magnetic resonance imaging. J Neurosci. 2003;23:4308–4314. doi: 10.1523/JNEUROSCI.23-10-04308.2003. [DOI] [PMC free article] [PubMed] [Google Scholar]
- 62.Wirtshafter D, Asin KE, Pitzer MR. Dopamine agonists and stress produce different patterns of Fos-like immunoreactivity in the lateral habenula. Brain Res. 1994;633:21–26. doi: 10.1016/0006-8993(94)91517-2. [DOI] [PubMed] [Google Scholar]
- 63.Shumake J, Edwards E, Gonzalez-Lima F. Opposite metabolic changes in the habenula and ventral tegmental area of a genetic model of helpless behavior. Brain Res. 2003;963:274–281. doi: 10.1016/s0006-8993(02)04048-9. [DOI] [PubMed] [Google Scholar]
- 64.Yang LM, Hu B, Xia YH, Zhang BL, Zhao H. Lateral habenula lesions improve the behavioral response in depressed rats via increasing the serotonin level in dorsal raphe nucleus. Behav Brain Res. 2008;188:84–90. doi: 10.1016/j.bbr.2007.10.022. [DOI] [PubMed] [Google Scholar]
- 65.Savitz JB, Nugent AC, Bogers W, Roiser JP, Bain EE, Neumeister A, et al. HHabenula volume in bipolar disorder and major depressive disorder: a high-resolution magnetic resonance imaging study. Biol Psychiatry. 2010;69:336–343. doi: 10.1016/j.biopsych.2010.09.027. [DOI] [PMC free article] [PubMed] [Google Scholar]
- 66.Ranft K, Dobrowolny H, Krell D, Bielau H, Bogerts B, Bernstein HG. Evidence for structural abnormalities of the human habenular complex in affective disorders but not in schizophrenia. Psychol Med. 2009;40:557–567. doi: 10.1017/S0033291709990821. [DOI] [PubMed] [Google Scholar]
- 67.Gutierrez-Ibanez C, Reddon AR, Kreuzer MB, Wylie DR, Hurd PL. Variation in asymmetry of the habenular nucleus correlates with behavioural asymmetry in a cichlid fish. Behav Brain Res. 2011;221:189–196. doi: 10.1016/j.bbr.2011.03.001. [DOI] [PubMed] [Google Scholar]
- 68.Henry TR, Bakay RA, Votaw JR, Pennell PB, Epstein CM, Faber TL, et al. Brain blood flow alterations induced by therapeutic vagus nerve stimulation in partial epilepsy: I. Acute effects at high and low levels of stimulation. Epilepsia. 1998;39:983–990. doi: 10.1111/j.1528-1157.1998.tb01448.x. [DOI] [PubMed] [Google Scholar]
- 69.Sheline YI, Barch DM, Donnelly JM, Ollinger JM, Snyder AZ, Mintun MA. Increased amygdala response to masked emotional faces in depressed subjects resolves with antidepressant treatment: an fMRI study. Biol Psychiatry. 2001;50:651–658. doi: 10.1016/s0006-3223(01)01263-x. [DOI] [PubMed] [Google Scholar]
- 70.Fu CH, Williams SC, Cleare AJ, Brammer MJ, Walsh ND, Kim J, et al. Attenuation of the neural response to sad faces in major depression by antidepressant treatment: a prospective, event-related functional magnetic resonance imaging study. Arch Gen Psychiatry. 2004;61:877–889. doi: 10.1001/archpsyc.61.9.877. [DOI] [PubMed] [Google Scholar]
- 71.LeDoux JE. Emotion: clues from the brain. Annu Rev Psychol. 1995;46:209–235. doi: 10.1146/annurev.ps.46.020195.001233. [DOI] [PubMed] [Google Scholar]
- 72.Lanteaume L, Khalfa S, Regis J, Marquis P, Chauvel P, Bartolomei F. Emotion induction after direct intracerebral stimulations of human amygdala. Cereb Cortex. 2007;17:1307–1313. doi: 10.1093/cercor/bhl041. [DOI] [PubMed] [Google Scholar]
- 73.Kennedy SH, Evans KR, Kruger S, Mayberg HS, Meyer JH, McCann S, et al. Changes in regional brain glucose metabolism measured with positron emission tomography after paroxetine treatment of major depression. Am J Psychiatry. 2001;158:899–905. doi: 10.1176/appi.ajp.158.6.899. [DOI] [PubMed] [Google Scholar]
- 74.Abe O, Yamasue H, Kasai K, Yamada H, Aoki S, Inoue H, et al. Voxel-based analyses of gray/white matter volume and diffusion tensor data in major depression. Psychiatry Res. 2010;181:64–70. doi: 10.1016/j.pscychresns.2009.07.007. [DOI] [PubMed] [Google Scholar]
- 75.Lai CH, Hsu YY, Wu YT. First episode drug-naive major depressive disorder with panic disorder: gray matter deficits in limbic and default network structures. Eur Neuropsychopharmacol. 2010;20:676–682. doi: 10.1016/j.euroneuro.2010.06.002. [DOI] [PubMed] [Google Scholar]
- 76.Gilbert AM, Prasad K, Goradia D, Nutche J, Keshavan M, Frank E. Grey matter volume reductions in the emotion network of patients with depression and coronary artery disease. Psychiatry Res. 2010;181:9–14. doi: 10.1016/j.pscychresns.2009.07.006. [DOI] [PubMed] [Google Scholar]
- 77.Montag C, Weber B, Fliessbach K, Elger C, Reuter M. The BDNF Val66Met polymorphism impacts parahippocampal and amygdala volume in healthy humans: incremental support for a genetic risk factor for depression. Psychol Med. 2009;39:1831–1839. doi: 10.1017/S0033291709005509. [DOI] [PubMed] [Google Scholar]
- 78.Ongur D, Ferry AT, Price JL. Architectonic subdivision of the human orbital and medial prefrontal cortex. J Comp Neurol. 2003;460:425–449. doi: 10.1002/cne.10609. [DOI] [PubMed] [Google Scholar]
- 79.Drevets WC, Raichle ME. Reciprocal suppression of regional cerebral blood flow during emotional versus higher cognitive processes: implications for interactions between emotion and cognition. Cognition and Emotion. 1998;12:353–385. [Google Scholar]
- 80.Raichle ME, MacLeod AM, Snyder AZ, Powers WJ, Gusnard DA, Shulman GL. A default mode of brain function. Proc Natl Acad Sci U S A. 2001;98:676–682. doi: 10.1073/pnas.98.2.676. [DOI] [PMC free article] [PubMed] [Google Scholar]
- 81.Gusnard DA, Akbudak E, Shulman GL, Raichle ME. Medial prefrontal cortex and self-referential mental activity: relation to a default mode of brain function. Proc Natl Acad Sci U S A. 2001;98:4259–4264. doi: 10.1073/pnas.071043098. [DOI] [PMC free article] [PubMed] [Google Scholar]
- 82.Grimm S, Ernst J, Boesiger P, Schuepbach D, Hell D, Boeker H, et al. Increased self-focus in major depressive disorder is related to neural abnormalities in subcortical-cortical midline structures. Hum Brain Mapp. 2009;30:2617–2627. doi: 10.1002/hbm.20693. [DOI] [PMC free article] [PubMed] [Google Scholar]
- 83.Ibrahim L, Diazgranados N, Franco-Chaves J, Brutsche N, Henter ID, Kronstein P, et al. Course of improvement in depressive symptoms to a single intravenous infusion of ketamine vs add-on riluzole: results from a 4-week, double-blind, placebo-controlled study. Neuropsychopharmacology. 2012;37:1526–1533. doi: 10.1038/npp.2011.338. [DOI] [PMC free article] [PubMed] [Google Scholar]
Associated Data
This section collects any data citations, data availability statements, or supplementary materials included in this article.