

Abstract
Objective
Rho-kinases (ROCKs) have been implicated in the pathogenesis of cardiovascular and renal disorders. We recently showed that ROCKs could regulate the differentiation of murine TH17 cells and production of IL-17 and IL-21, two cytokines associated with SLE. The goal of this study was to assess ROCK activation in human TH17 cells and evaluate ROCK activity in SLE patients.
Methods
An ELISA-based ROCK activity assay was employed to evaluate ROCK activity in human cord blood CD4+ T cells differentiated under TH0 or TH17 conditions. We then performed a cross-sectional analysis of 28 SLE patients and 25 healthy matched controls. ROCK activity in peripheral blood mononuclear cell (PBMC) lysates was assessed by ELISA. Cytokine and chemokine profiles were analyzed via ELISA.
Results
Human cord blood CD4+ T cells differentiated under TH17 conditions expressed higher levels of ROCK activity than CD4+ T cells stimulated under TH0 conditions. Production of IL-17 and IL-21 was furthermore inhibited by addition of a ROCK inhibitor. SLE PBMCs expressed significantly higher levels of ROCK activity as compared to healthy controls, 1.25 vs. 0.56, respectively (p=0.0015). Sixteen (57%) SLE patients expressed high ROCK levels (OD450>1). Disease duration, lymphocyte count, and azathioprine use were significant independent predictors of ROCK activity in multivariable analyses.
Conclusions
Consistent with previous results in the murine system, increased ROCK activation was associated with TH17 differentiation. Enhanced ROCK activity was furthermore observed in a subgroup of SLE patients. These data support the concept that the ROCK pathway could represent an important therapeutic target for SLE.
Introduction
Rho GTPases (Rac and RhoA) play a key role in a wide-range of biological processes by regulating cytoskeletal reorganization and gene expression (1). Upon binding GTP, Rho GTPases undergo a conformational switch allowing them to bind to and activate a number of effectors. RhoA exerts its major effects by activating Rho kinases (ROCKs), which are serine/threonine kinases that include two isoforms, ROCK1 and ROCK2 (1, 2). The ROCKs can regulate cytoskeletal reorganization through phosphorylation of a number of proteins including MYPT1 (the regulatory subunit of myosin light chain phosphatase) and ERM proteins (ezrin, radixin and moesin). In addition to adhesion and migration, the ROCKs also regulate cell proliferation, differentiation, and apoptosis (3, 4). The ROCKs have been shown to play a key role in nonhematopoietic cells and abnormal activation of the RhoA/ROCK pathway has been implicated in the pathogenesis of cardiovascular, renal, and neurological disorders (5–11). As such, ROCK inhibition has emerged as an important therapeutic target for the treatment of these diseases. ROCK inhibitors, like Fasudil and Y-27632, have shown benefits in murine models of atherosclerosis (12) and clinical trials with Fasudil have demonstrated benefits in patients with stable angina pectoris with minimal side effects (13, 14). Inhibition of ROCK activation has also been implicated in the anti-inflammatory effects of statins due to the ability of statins to interfere with the activation of RhoA (15). Interestingly, ROCK activation has also been observed in response to Angiotensin II stimulation (9) raising the possibility that inhibitors of this pathway can also affect the activity of the ROCK kinases.
While the role of the ROCKs in nonhematopoietic cells has been extensively investigated, their role in the immune system is only now beginning to be elucidated. Emerging evidence supports the notion that aberrant ROCK activation may play a role in the pathogenesis of Systemic Lupus Erythematosus (SLE). Indeed, aberrant levels of ERM phosphorylation, which can be ameliorated by administration of a ROCK inhibitor, are one of the cytoskeletal abnormalities detected in SLE T cells (16). Recent murine studies have furthermore demonstrated that ROCK2 regulates not only T cell cytoskeletal dynamics but also CD4+ T cell effector function. Indeed, ROCK2 was found to be activated in TH17 cells and to phosphorylate IRF4 thus regulating the production of IL-17 and IL-21 (17), two cytokines known to contribute to the pathogenesis of lupus and other autoimmune diseases (18–20). Aberrant ROCK2 activation was observed in T cells from various lupus-prone mice and administration of Fasudil in vivo ameliorated the deregulated production of IL-17, IL-21, and the inflammatory and autoantibody responses observed in these mice (17, 21).
Given that the ROCKs could represent a novel therapeutic target for SLE and potentially other autoimmune diseases, in the present study we investigated whether ROCK activation also occurs in human TH17 cells and assessed whether ROCK inhibitors could also affect human IL-17 and IL-21 production. Importantly, we directly investigated the levels of ROCK activation in SLE patients using a novel assay to measure cellular ROCK activity. Consistent with the murine studies, ROCK activation was observed in cord blood CD4+ T cells differentiated under TH17 conditions. Remarkably, elevated levels of ROCK activation were detected in ~60% of SLE patients as compared to healthy controls. Taken together these data support the idea that the RhoA/ROCK pathway could represent an important therapeutic target for the treatment of SLE and that serial measurements of ROCK activation in SLE patients may be useful to monitor the efficacy of therapies, such as ROCK inhibitors and/or statins, aimed at inhibiting this pathway.
Materials and Methods
Cell cultures
Cryopreserved vials of human cord blood CD4+ T lymphocytes were obtained from Lonza Poietics, Immune Cell Systems, and AllCells, LLC. CD4+ T cell purity was >95%. Cells were thawed according to manufacturer’s instructions and cultured in LGM-3 (Lonza) media supplemented with 1% BSA, penicillin, and streptomycin. CD4+ T cells (106 cells/well) were stimulated with plate-bound αCD3 (5 μg/ml; UCHT1 clone) and soluble αCD28 (1 μg/ml) for three days. For TH17 differentiation, medium was supplemented with the following combination of cytokines: TGF-β1 (5 ng/ml), IL-1β (10 ng/ml), IL-6 (20 ng/ml), and IL-23 (50 ng/ml). The ROCK inhibitor, Y-27632 (EMD), was added at day 2. NIH 3T3 adherent cells were cultured and stimulated with 10μM lysophosphatidic acid (LPA, Sigma) as previously described (22).
ROCK Activity Assays
Western Blotting
Extracts were obtained by using lysis buffer containing 1% NP-40 detergent as described (23). In selected experiments, cells were fixed and harvested in 10% trichloroaceticacid (TCA) and 10mM dichlorodiphenyltrichloroethane (DDT) and cell lysates were prepared as previously described (22). Levels of phosphorylated MYPT1 were detected by western blotting using a rabbit anti-phospho-MBS/MYPT1-Thr853 (pMYPT1) specific antibody (Cyclex Co.,Ltd.). Phosphorylated levels of Ezrin, Radixin, and Moesin (ERM) were detected by western blotting with a rabbit anti-phospho-ERM (pERM) specific antibody (Cell Signaling Technology) while total levels of ERM proteins were detected using a goat anti-ERM antibody (C-19; Santa Cruz Biotechnology, Inc.). ImageJ software (NIH) was used to quantitate bands and densitometry values were then normalized to their respective loading controls. Phosphorylated levels of IRF4 were detected by western blotting with a rabbit polyclonal antibody specific for phosphoIRF4 that we previously generated (17) while total levels of IRF4 were detected using a goat anti-IRF4 antibody (M-17; Santa Cruz Biotechnology, Inc.).
ELISA
ROCK activity in extracts was measured using the 96-well ROCK Activity Assay Kit (Cell Biolabs, Inc.). PBMC lysates were prepared using 1% NP-40 lysis buffer. Briefly, 10 μg of whole cell extracts were incubated in kinase buffer and added to a 96-well plate coated with MYPT1, the ROCK substrate. After washing, the wells were incubated with anti-phospho-MYPT1 (Thr696) antibody. After 1-hour, the wells were washed and an HRP-conjugated secondary antibody was added for another hour. Substrate solution was then added and quantification performed on a spectrophotometer using 450nm as the primary wavelength. Active ROCK2 (1–4ng) served as a positive control as per the manufacturer’s instructions. In experiments in which Y-27632 was used, the PBMC samples were pre-incubated with 50μM of Y-27632 for one hour prior to the ELISA.
Study Subjects
A cross sectional study of 28 SLE patients followed at the Hospital for Special Surgery compared to 25 healthy controls. Inclusion criteria for SLE patients included: age 18–65 years, ability and willingness to provide written informed consent, and classification of SLE according to the revised 1997 ACR criteria (24). Exclusion criteria included: active infection by history, pregnancy, pulse glucocorticoid therapy within 1 month, Cyclophosphamide therapy within 3 months, Rituximab therapy within 1 year, and any anti-TNF therapy within 3 months. Disease activity was assessed at the time of sampling by the Systemic Lupus Erythematosus Disease Activity Index SELENA modification (SELENA-SLEDAI) (25). Clinical data including laboratory parameters, medications, complications, and serology were collected. Inclusion criteria for healthy controls included: age 18–65 years, ability and willingness to provide written informed consent, nongravid, and no known diagnosis of any autoimmune disease.
Samples
Heparinized venous blood samples (10–20 ml) were obtained from each study participant by hospital phlebotomists and processed immediately. Plasma was collected and stored at −80°C. Peripheral blood mononuclear cells (PBMCs) were isolated by centrifugation using Ficoll-Paque PLUS (GE Healthcare) density gradient according to manufacturer’s instructions.
ELISA
Plasma samples and/or supernatants were analyzed for IL-17 (eBioscience), IL-21 (eBioscience), CCL20 (R&D Systems), and BAFF (R&D Systems) levels by ELISA according to manufacturers’ instructions.
dsDNA crithidia
Plasma samples were analyzed for dsDNA using the IFA nDNA Test System (Zeus Scientific, Inc.). Serial plasma dilutions (1:10 through 1:2560) were incubated on C. luciliae substrate slides according to manufacturer’s instructions and examined for kinetoplast fluorescence. All positive samples were titrated to the last dilution (≥1:2560 maximal) giving a positive fluorescence, which was recorded as the dsDNA titer.
Measurement of serum IFNα activity
Human WISH epithelial cell line cells (product no. CCL-25; American Type Culture Collection) were grown as previously described (26). WISH cells were used to measure Interferon-inducing activity in patient plasma via the expression of IFIT1, IFI44, and IFIT3 genes by real-time quantitative PCR as previously described (26).
Statistics
Statistical analyses were performed using GraphPad Prism (5.0d) and SAS. Data are expressed as medians with interquartile range, unless otherwise specified. The two-tailed unpaired Student’s t test, Mann-Whitney, and Kruskal-Wallis tests were used to evaluate differences in continuous variables between groups, depending on the distribution of the data. The Dunn’s or Bonferroni multiple comparisons test was used when appropriate for multiple comparisons. Fisher’s exact test was used to compare proportions between groups. Correlations were estimated with the Spearman correlation coefficient. Linear regression models were fit to the data using a stepwise approach to identify independent predictors of ROCK activity. ROCK activity levels were analyzed on both the original and rank transformed scales, but results from only the former are presented since the two approaches yielded nearly identical results. A P value less than 0.05 was considered statistically significant.
Results
ROCK activation in human TH17 cells
We previously demonstrated that murine CD4+ T cells activate ROCK2 upon exposure to TH17 skewing conditions but not to TH0 conditions, leading us to hypothesize that ROCK activation might also occur in human TH17 cells (17). Measurements of ROCK activation in our murine studies had been performed with a nonradioactive in vitro kinase assay, which assesses the ability of immunoprecipitated ROCK2 to phosphorylate exogenous MYPT1 (17). While this assay could easily be performed with murine CD4+ T cells due to the availability of large number of cells, utilization of this assay for human studies, where only limited samples are available, could prove problematic. Prior to commencing our human studies, we thus set out to explore the ability of an ELISA-based ROCK kinase activity assay to accurately measure ROCK activity since this assay could easily be adapted to small number of cells. Given that immunoblotting for pMYPT1 and ERM proteins (pERM) have been previously employed to assess ROCK activation (16, 22), a comparison of these different methodologies was conducted utilizing extracts obtained from 3T3 cells treated with LPA. Extracts were prepared via two protocols; one we had employed in our murine T cell studies, and one previously optimized to detect endogenous pMYPT1 (22, 23). Levels of pMYPT1 were increased approximately two-fold in 3T3 cells stimulated with LPA regardless of the protocol utilized (Figures 1A and B). Probing the same extracts with an antibody against pERM also revealed upregulation of pERM levels (Figure 1C). Importantly, stimulated 3T3 cells also demonstrated enhanced ROCK activation when measured via the ELISA-based ROCK kinase activity assay (Figure 1D). Therefore, the ELISA-based ROCK kinase activity assay can be effectively employed to measure ROCK activation in cells.
Figure 1. ROCK activation in 3T3 cells as assessed by different methodologies.
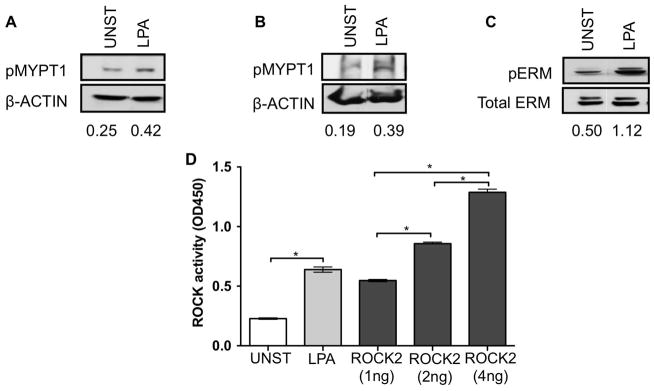
(A) NIH 3T3 cells were either left unstimulated or stimulated with 10μM LPA for 10 minutes. Whole cell extracts were prepared using lysis buffer containing 1% NP-40 detergent. Phosphorylated levels of endogenous MYPT1 were detected by western blotting with an anti-phospho-MYPT1-Thr853 specific antibody (top panel). The blot was later stripped and reprobed with a β-actin Ab as a loading control (bottom panel). (B) NIH 3T3 cells were stimulated as in (A). Whole cell extracts were prepared using 10% TCA and 10mM DDT and levels of pMYPT1 evaluated as described in (A). (C) NIH 3T3 cells were stimulated as in (A). Whole cell extracts were prepared using lysis buffer containing 1% NP-40 detergent. Phosphorylation of ERM proteins was evaluated by western blotting with an anti-phospho-ERM specific antibody (top panel). The blot was later stripped and reprobed with an anti-total ERM Ab as a loading control (bottom panel). (D) 3T3 cells stimulated as indicated above were prepared as described in (A) and ROCK activation assessed by an ELISA-based ROCK kinase activity assay. Active ROCK2 (1–4ng) was used a positive control. Data were analyzed by Two-tailed unpaired t-test; *p<0.05. UNST: Unstimulated.
To evaluate whether ROCK activation would occur in human TH17 cells, purified human cord blood CD4+ T lymphocytes were differentiated under either TH0 or TH17 skewing conditions in the presence or absence of the ROCK inhibitor Y-27632. As compared to TH0 cells, TH17 cells exhibited higher levels of ROCK activation, which was diminished upon the addition of Y-27632 (Figure 2A). In line with our murine studies, the increased levels of ROCK activation in TH17 cells were accompanied by enhanced IRF4 phosphorylation, which was decreased in the presence of Y-27632 (Figure 2B). Addition of Y-27632 furthermore diminished the ability of TH17 cells to produce IL-17 and IL-21 in a dose-dependent manner (Figure 2C and D). Interestingly, IL-21 production appeared to be more sensitive to ROCK inhibition than IL-17 production. Taken together these studies thus indicate that similarly to the murine system, ROCK is activated under TH17 conditions and ROCK inhibitors can decrease the production of IL-17 and IL-21 by human TH17 cells.
Figure 2. ROCK activation in human TH-17 cells.

(A) Human CD4+ T cells from cord blood (106 cells/well) were stimulated under either TH0 or TH17 skewing conditions in the presence or absence of Y-27632 (90μM). ROCK activation was assessed at day 3 by an ELISA-based ROCK kinase activity assay. (B) Human CD4+ T cells from cord blood were stimulated as in (A) in the presence or absence of Y-27632 (90μM) and extracts were analyzed by Western blotting using an antibody that recognizes phosphorylated IRF4 (pIRF4) (upper panel). The blot was later stripped and reprobed with an antibody against total IRF4 (lower panel). Human CD4+ T cells from cord blood were stimulated as in (A) in the presence or absence of Y-27632 (30–90μM as indicated) and the levels of (C) IL-17 and (D) IL-21 in the supernatants were assessed by ELISA. Shown is one representative experiment of three independent experiments. Data were analyzed by one-way ANOVA with Bonferroni post test analysis; *p<0.05. Y(30): 30μM Y-27632; Y(60): 60μM Y-27632; Y(90): 90μM Y-27632.
Demographic and Clinical Characteristics of Study Cohort
Given that enhanced IL-17 and IL-21 production has been associated with lupus pathogenesis (18–20) and that we had detected aberrant ROCK activation in a number of lupus-prone models (17, 21), we next sought to employ this ELISA-based ROCK kinase activity assay to directly assess the levels of ROCK activation in healthy controls and SLE patients. We thus conducted a cross-sectional analysis of 28 SLE patients and 25 matched healthy controls. Both groups exhibited similar demographics with respect to age, sex, and race/ethnicity (Supplementary Table 1). The clinical features of the SLE patients are summarized in Table 1 and include immunologic characteristics and disease manifestations that may have been experienced by the patients at any time during their disease. Mean duration of disease was 9.46 ± 5.87 years (Range: 1–21 years). Three patients were ANA negative by history, however 2 of these patients were dsDNA positive. The remaining ANA negative patient didn’t have any positive serology, but had a history of neuropsychiatric disease and met clinical ACR criteria for SLE. Eleven patients had a history of lupus nephritis and 6 with a history of neuropsychiatric disease. All but 4 patients were on prednisone at the time of sample collection with a mean daily dose of 9.14 ± 10.51 mg. Aside from prednisone and hydroxychloroquine, 23 patients were receiving adjunctive immunosuppressive therapy: 14 mycophenolate mofetil, 7 azathioprine, and 2 methotrexate. With respect to disease activity, mean SLEDAI was 4.0 ± 2.4 (Range: 0–10) and physician global assessment 0.8 ± 0.7 (Range:0–2).
Table 1.
Clinical Characteristics of 28 SLE patients
| SLE Characteristics | N=28 (%) |
|---|---|
| Skin Manifestations | |
| Malar rash | 19 (67.86) |
| Discoid rash | 1 (3.57) |
| Photosensitivity | 17 (60.71) |
| Oral/nasal ulcers | 10 (35.71) |
| Arthritis | 22 (78.57) |
| Serositis | 17 (60.71) |
| Renal Disease | 11 (39.29) |
| Class IV | 2 |
| Class V | 3 |
| Class III/IV | 1 |
| Class III/V | 1 |
| Class IV/V | 2 |
| NPSLE | 6 (21.43) |
| Hematologic abnormalities | 15 (53.57) |
| Mean ALC +/− SD (cells/nl) | 1.24 +/− 0.86 |
| Immunologic Manifestations | |
| ANA | 25 (89.29) |
| Anti-dsDNA antibodies | 24 (85.71) |
| Anti-smith antibodies | 8 (28.57) |
| Antiphospholipid antibodies | 2 (7.14) |
| RF and CCP antibodies | 1 (3.57) |
| Pulmonary hypertension | 1 (3.57) |
| Gastrointestinal vasculitis | 1 (3.57) |
| Current Medications | |
| Hydroxychloroquine | 26 (92.86) |
| Azathioprine | 7 (25) |
| Mycophenolate mofetil | 14 (50) |
| Methotrexate | 2 (7.14) |
| Prednisone | 24 (85.71) |
| Mean +/− SD (mg) | 9.1 +/− 10.5 |
| SLEDAI | |
| Mean +/− SD | 4.0 +/− 2.4 |
| Range | (0–10) |
| Physician Global Assessment (0–3) | |
| Mean +/− SD | 0.8 +/− 0.7 |
| Range | (0–2) |
ALC=Absolute Lymphocyte Count; RF=Rheumatoid Factor; CCP=Cyclic Citrullinated Peptide
Elevated Levels of ROCK Activity in SLE patients
To evaluate ROCK activation in healthy controls and SLE patients, we elected to assess ROCK activity in PBMCs given that the activity of the enzyme can be affected by culture conditions and thus evaluating ROCK activity directly in unmanipulated PBMCs would most closely reflect the levels of enzyme activity within each subject. PBMCs were isolated from heparinized blood samples and extracts were processed immediately and stored at −80°C. At a later time point extracts were subjected to the ELISA-based ROCK kinase activity assay. PBMCs from SLE patients expressed significantly higher median ROCK levels when compared to healthy controls, 1.251 (IQR: 0.5–1.6) vs. 0.5645 (IQR: 0.5–0.7), respectively (p=0.0015) (Figure 3A). There were two subgroups of SLE patients: those with high (ROCKhigh) and low (ROCKlow) ROCK levels as determined by the tight clustering of values above and below the OD450 value of 1. Sixteen of the 28 (57%) patients were in the ROCKhigh group (OD450>1) and none of the healthy controls (p<0.0001). These data thus indicate that a subset of SLE patients exhibits enhanced ROCK activity.
Figure 3. ROCK activity in SLE patients versus healthy controls.
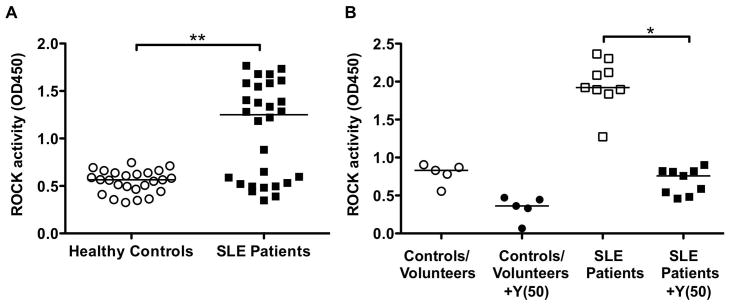
(A) PBMCs were obtained from heparinized blood samples of 28 SLE patients and 25 matched healthy controls. Whole cell extracts were prepared and ROCK activation assessed by an ELISA-based ROCK kinase activity assay. Data were analyzed by Mann-Whitney test; **p=0.0015. (B) ROCK activity in the presence or absence of Y-27632 (50 μM) from healthy controls/volunteers and SLE patients. Data were analyzed by Kruskal-Wallis with Dunn’s post test analysis; *p<0.05. Horizontal bars represent medians. Y(50): 50μM Y-27632.
To further evaluate the ability of the ELISA-based ROCK kinase activity assay to measure ROCK activation in samples from different sources, additional blood samples from healthy volunteers who were not matched to the SLE cohort were obtained. There was no significant difference in ROCK levels in PBMCs from healthy volunteers when compared to PBMCs from the healthy matched controls (data not shown). In addition, to confirm that the elevated ROCK activity levels observed in the SLE patients were indeed due to ROCK activation, ROCK activity in a subset of samples was also measured after the addition of Y-27632 to the in vitro kinase reactions (Figure 3B). As expected, addition of the ROCK inhibitor diminished the levels of ROCK activation in all samples and was able to decrease ROCK activation in SLE samples to levels similar to those observed in healthy controls and volunteers.
Cytokine Profile in SLE Patients
As TH17 cells have been implicated in the pathogenesis of SLE (18–20) and are known to be regulated by the ROCKs (17), next we sought to assess whether the elevated ROCK levels observed in SLE patients were associated with evidence of increased IL-17 and IL-21 production as determined by measuring plasma levels. Increased levels of IL-17 have been detected in SLE patients in some studies (18–20) and recent studies have also reported increases in plasma IL-21 and polymorphisms of the IL21 and IL21R genes in SLE (19). No statistically significant difference in IL-17 and IL-21 levels between SLE patients and healthy controls was however detected in this study (Figure 4A and B). Given that CCL20 is an important chemokine for the recruitment of TH17 cells to sites of inflammation (27, 28), CCL20 levels were also measured. CCL20 levels in the SLE patients were significantly elevated compared to controls, 16.1 pg/ml (IQR: 10–23) vs. 10.2 pg/ml (IQR: 7.1–15.5) with p=0.02, respectively (Figure 4C). Consistent with previous studies, SLE patients expressed significantly higher BAFF (29–34) (Figure 4D) and IFN inducible gene levels (IFIGs) (35–39) (Figure 4E) when compared to controls. There was no detectable correlation between the various cytokine levels or IFIGs when compared to ROCK activity (data not shown).
Figure 4. Levels of IL-17, IL-21, CCL-20, BAFF and IFN-inducible genes (IFIGs) in SLE patients compared to healthy controls.

Plasma samples were analyzed for (A) hIL-17, (B) hIL-21, (C) hCCL20, and (D) hBAFF levels by ELISA. Mann-Whitney test. (E) To measure Interferon-inducible genes (IFIGs) in plasma, WISH cells were cultured with recombinant human IFNα or 50% patient or control plasma for 6 hrs. IFIGs were then determined by real-time quantitative polymerase chain reaction. Relative expression of 3 IFIGs (IFIT1, IFI44, and IFIT3) were averaged to obtain an Average Relative Expression of the 3 IFIGs (Avg R.E. IFIG). Data were analyzed by Mann-Whitney test. Horizontal bars represent medians.
Clinical Correlation of ROCK Activity
We performed a series of analyses to determine whether the level of ROCK activation in SLE patients correlated with disease specific manifestations and/or immunologic characteristics. In bivariate analyses, there was no association of ROCK activity levels with known measures of disease activity, including SLEDAI, dsDNA titers (Figure 5A and B), and physician global assessment. Absolute lymphocyte count (ALC) was the only clinical variable associated with ROCK activity (p=0.04).
Figure 5. Enhanced ROCK activity in SLE patients does not correlate with SLEDAI scores or dsDNA titers and is not associated with ACEI/ARB use.

No correlation between ROCK activity and (A) SLEDAI scores and (B) dsDNA titers. Spearman correlation. (C) ROCK activity levels in SLE patients with respect to ACEI or ARB use. Data were analyzed by Kruskal-Wallis with Dunn’s post test analysis; *p<0.05. Horizontal bars represent medians. ACEI: Angiotensin converting enzyme inhibitors; ARB: Angiotensin receptor blockers.
We also compared the characteristics of ROCKhigh and ROCKlow subgroups and found no appreciable differences with respect to the following factors: serology, mean prednisone dose, MMF use, and statin use (data not shown). The mean disease duration in the ROCKhigh subgroup was 10.6 ± 6.6 years vs. 8 ± 4.6 years in the ROCKlow subgroup (p=0.39). Median ALCs were lower in the ROCKlow subgroup (0.62 cells/nl, IQR: 0.49–0.76) compared to the ROCKhigh subgroup (1.42 cells/nl, IQR: 0.64–3.32) (p=0.07). However, 37.5% (6/16) of the ROCKhigh subgroup had low ALC. In multivariable analyses using linear regression models, disease duration (p=0.02), absolute lymphocyte count (ALC) (p=0.002), and azathioprine (p=0.02) use were identified as independent predictors of ROCK activity levels.
Although statins can potentially interfere with ROCK activation, only 4 SLE patients were receiving statins, and they were not clustered in the ROCKlow subgroup. As angiotensin II has been shown to activate RhoA (9), we also evaluated whether the concomitant use of an angiotensin converting enzyme inhibitors (ACEI) or angiotensin receptor blockers (ARB) could be affecting ROCK levels in the ROCKlow subgroup. Nine of the 28 SLE patients were prescribed an ACEI/ARB for hypertension, renal disease, and/or proteinuria. As shown in Figure 5C, there was no significant difference in ROCK levels in SLE patients with respect to ACEI/ARB use. Therefore, the distinction between the ROCKhigh and ROCKlow subgroups is not secondary to angiotensin blockade.
Discussion
Although the key role of the RhoA/ROCK pathway in cardiovascular disorders is well recognized (5–7) its contribution to autoimmunity is just beginning to emerge. Consistent with our murine studies which implicated the RhoA/ROCK pathway in the control of IL-17 and IL-21 production (17), here we show that ROCK activation is also observed in human TH17 cells and that ROCK inhibition can decrease the production of IL-17 and IL-21 by these cells. Importantly, we utilized a novel ELISA-based ROCK kinase activity assay to directly measure cellular ROCK activity and demonstrate that ~60% of SLE patients exhibit increased ROCK activity. These findings are consistent with previous studies, which have shown that SLE T cells exhibit increased levels of pERM proteins, a known ROCK target (16). Taken together with our murine studies, these data support the idea that deregulated ROCK activation plays a role in the pathogenesis of autoimmune disorders and that inhibition of ROCK activation could be a novel therapeutic target for SLE.
While previous studies have investigated ROCK activation using Western blotting to assess the levels of phosphorylation of ROCK targets such as ERM proteins or MBS/MYPT1 (16, 22), in this study, we employed a novel ELISA-based ROCK kinase activity assay to directly measure ROCK activity in patients’ samples. This assay offers several advantages including the ability to measure ROCK activity in a relatively small number of cells, high throughput, and the ability to use OD values to readily quantitate ROCK activity. Although follow-up studies will be necessary to further validate the clinical usefulness of this assay, this method could potentially be used to monitor ROCK activation in SLE patients in longitudinal studies, to assess the efficacy of drugs such as statins, which have the potential of inhibiting the ROCK kinases (15), or to evaluate the effectiveness of the new classes of ROCK inhibitors under development. We cannot, however, rule out that the sensitivity of this assay may be better at higher (OD>1) than lower levels of ROCK activation and that development of assays with increased sensitivity will also be necessary to obtain a more accurate comparison of the levels of ROCK activation in healthy controls versus the SLE patients in the ROCKlow group.
Similar to our murine studies (17), we observed ROCK activation in human cord blood CD4+ T cells differentiated under TH17 conditions. Intriguingly, although the production of both IL-17 and IL-21 was ameliorated by the addition of Y-27632, a higher concentration of Y-27632 was needed to achieve a significant decrease in IL-17 and IL-21 production in the human system than in the murine system (17), suggesting that human T cells may be more resistant to ROCK inhibition than their murine counterparts; an effect that was previously also observed in samples from MS patients (40). Although previous studies demonstrated higher levels of IL-17 and IL-21 in the serum or plasma of SLE patients (18–20), we did not observe increases in plasma IL-17 and IL-21 levels in our patient cohort. This may be a consequence of the low disease activity in our patients compared to previous studies (41–44). The low IL-17 and IL-21 plasma levels could thus explain our inability to detect an association between ROCK activation and IL-17 and IL-21 production. Additionally, plasma cytokine levels can be difficult to assess. Thus, while the need to establish, optimize, and verify this new ELISA-based ROCK kinase activity assay limited the analyses that we could perform on the samples, follow-up investigations will be aimed at correlating ROCK activity levels with the frequencies of IL-17 and IL-21 producing cells in SLE patients. We are furthermore developing assays geared to evaluating ROCK activity by intracellular FACS in order to determine ROCK activation levels within specific cellular compartments while simultaneously minimizing the manipulation of the samples.
While we did not detect significant elevations of IL-17 and IL-21 in the plasma, our study is the first to report increased plasma levels of CCL20 in SLE patients. Given the ability of CCL20 to recruit TH17 cells (27, 28), another explanation for the lack of association between ROCK activation and plasma IL-17 and IL-21 levels is that deregulated production of CCL20 in SLE patients leads to the recruitment of TH17 cells into the tissues where the aberrant production of IL-17 and IL-21 then takes place. Longitudinal studies as well as assessment of ROCK activation in additional cohorts of patients and in tissues will be required to address these different possibilities.
We demonstrated a positive association of elevated ROCK levels with disease duration, lymphocyte count, and azathioprine use. Interestingly, azathioprine has previously been shown to decrease Rac activation (45), and this effect could account for the increased ROCK activation in these patients given the known ability of Rac to inhibit RhoA (2, 46) and thus ROCK activation. Interestingly, ALC was associated with ROCK activity and identified as an independent predictor of ROCK activity in multivariable analysis using linear regression. Given that the ROCK activity assay was performed on isolated PBMCs and not on whole blood, that the same amount of extract was used for all samples, and that PBMCs are composed primarily of lymphocytes and monocytes, changes in the lymphocyte/monocyte ratio in the different PBMC samples could alter the levels of ROCK activation that we would detect, depending upon the source of the high ROCK activity in PBMCs. To evaluate this possibility we assessed whether ROCK activity correlated with the lymphocyte/monocyte ratio in each sample. There was a lack of correlation between ROCK activity levels and the lymphocyte/monocyte ratio (p=0.39) suggesting that variations in the frequencies of monocytes within the samples do not account for the variations in ROCK activity levels observed in SLE patients. We however cannot exclude that in the ROCKlow subgroup, TH17 cells have redistributed to target organs leading to a lower proportion of TH17 cells within the lymphocyte fraction in these patients (and potentially lower ALCs) and thus leading to an underestimation of ROCK activity in the peripheral blood. Again, an assessment of ROCK activation in the tissues will be helpful in determining whether in these patients the low levels of ROCK activity are due to the redistribution of lymphocytes expressing high levels of ROCK activation into the tissues.
Given the cross-sectional nature of this pilot study and the relatively low mean disease activity indices of our patients, additional studies will be required to confirm these associations and further characterize the relationship between ROCK levels, ALC, disease activity, and/or medications. Importantly, in view of the known involvement of the ROCKs with the pathogenesis of cardiovascular diseases (5–7), further longitudinal studies will be required to evaluate whether the increased ROCK activation seen in some SLE patients is potentially associated with the development of premature atherosclerosis, which is observed in this disease (47, 48).
In conclusion, our data support the concept that the RhoA/ROCK pathway could represent an important therapeutic target for the treatment of SLE and that monitoring ROCK activation in SLE patients may be utilized to assess the efficacy of therapies, such as statins or ROCK inhibitors, aimed at inhibiting this pathway.
Acknowledgments
This research was supported by a Fellowship from the S.L.E. Lupus Foundation, Inc., the Alliance for Lupus Research, the NIH, the Peter Jay Sharp Foundation, and the Mary Kirkland Center for Lupus Research.
We thank the SLE patients, their physicians, and the healthy volunteers at the Hospital for Special Surgery for participating in this study.
References
- 1.Ridley AJ. Rho family proteins: coordinating cell responses. Trends Cell Biol. 2001;11:471–7. doi: 10.1016/s0962-8924(01)02153-5. [DOI] [PubMed] [Google Scholar]
- 2.Guilluy C, Garcia-Mata R, Burridge K. Rho protein crosstalk: another social network? Trends in cell biology. 2011;21:718–26. doi: 10.1016/j.tcb.2011.08.002. [DOI] [PMC free article] [PubMed] [Google Scholar]
- 3.Noma K, Oyama N, Liao JK. Physiological role of ROCKs in the cardiovascular system. Am J Physiol Cell Physiol. 2006;290:C661–8. doi: 10.1152/ajpcell.00459.2005. [DOI] [PMC free article] [PubMed] [Google Scholar]
- 4.Wettschureck N, Offermanns S. Rho/Rho-kinase mediated signaling in physiology and pathophysiology. J Mol Med (Berl) 2002;80:629–38. doi: 10.1007/s00109-002-0370-2. [DOI] [PubMed] [Google Scholar]
- 5.Zhou Q, Gensch C, Liao JK. Rho-associated coiled-coil-forming kinases (ROCKs): potential targets for the treatment of atherosclerosis and vascular disease. Trends in pharmacological sciences. 2011;32:167–73. doi: 10.1016/j.tips.2010.12.006. [DOI] [PMC free article] [PubMed] [Google Scholar]
- 6.Satoh K, Fukumoto Y, Shimokawa H. Rho-kinase: important new therapeutic target in cardiovascular diseases. Am J Physiol Heart Circ Physiol. 2011;301:H287–96. doi: 10.1152/ajpheart.00327.2011. [DOI] [PubMed] [Google Scholar]
- 7.Surma M, Wei L, Shi J. Rho kinase as a therapeutic target in cardiovascular disease. Future cardiology. 2011;7:657–71. doi: 10.2217/fca.11.51. [DOI] [PMC free article] [PubMed] [Google Scholar]
- 8.Hayashi K, Wakino S, Kanda T, Homma K, Sugano N, Saruta T. Molecular mechanisms and therapeutic strategies of chronic renal injury: role of rho-kinase in the development of renal injury. J Pharmacol Sci. 2006;100:29–33. doi: 10.1254/jphs.fmj05003x6. [DOI] [PubMed] [Google Scholar]
- 9.Komers R. Rho kinase inhibition in diabetic nephropathy. Curr Opin Nephrol Hypertens. 2011;20:77–83. doi: 10.1097/MNH.0b013e32834131f8. [DOI] [PubMed] [Google Scholar]
- 10.Kubo T, Yamaguchi A, Iwata N, Yamashita T. The therapeutic effects of Rho-ROCK inhibitors on CNS disorders. Ther Clin Risk Manag. 2008;4:605–15. doi: 10.2147/tcrm.s2907. [DOI] [PMC free article] [PubMed] [Google Scholar]
- 11.Wang QM, Liao JK. ROCKs as immunomodulators of stroke. Expert Opin Ther Targets. 2012 doi: 10.1517/14728222.2012.715149. [DOI] [PMC free article] [PubMed] [Google Scholar]
- 12.Shimokawa H, Takeshita A. Rho-kinase is an important therapeutic target in cardiovascular medicine. Arterioscler Thromb Vasc Biol. 2005;25:1767–75. doi: 10.1161/01.ATV.0000176193.83629.c8. [DOI] [PubMed] [Google Scholar]
- 13.Shimokawa H, Hiramori K, Iinuma H, Hosoda S, Kishida H, Osada H, et al. Anti-anginal effect of fasudil, a Rho-kinase inhibitor, in patients with stable effort angina: a multicenter study. J Cardiovasc Pharmacol. 2002;40:751–61. doi: 10.1097/00005344-200211000-00013. [DOI] [PubMed] [Google Scholar]
- 14.Vicari RM, Chaitman B, Keefe D, Smith WB, Chrysant SG, Tonkon MJ, et al. Efficacy and safety of fasudil in patients with stable angina: a double-blind, placebo-controlled, phase 2 trial. J Am Coll Cardiol. 2005;46:1803–11. doi: 10.1016/j.jacc.2005.07.047. [DOI] [PubMed] [Google Scholar]
- 15.Zhou Q, Liao JK. Pleiotropic effects of statins. - Basic research and clinical perspectives. Circulation journal : official journal of the Japanese Circulation Society. 2010;74:818–26. doi: 10.1253/circj.cj-10-0110. [DOI] [PMC free article] [PubMed] [Google Scholar]
- 16.Li Y, Harada T, Juang YT, Kyttaris VC, Wang Y, Zidanic M, et al. Phosphorylated ERM is responsible for increased T cell polarization, adhesion, and migration in patients with systemic lupus erythematosus. J Immunol. 2007;178:1938–47. doi: 10.4049/jimmunol.178.3.1938. [DOI] [PubMed] [Google Scholar]
- 17.Biswas P. Phosphorylation of IRF4 by ROCK2 regulates IL-17 and IL-21 production and the development of autoimmunity in mice. The Journal of Clinical Investigation. 2010:120. doi: 10.1172/JCI42856. [DOI] [PMC free article] [PubMed] [Google Scholar]
- 18.Garrett-Sinha LA, John S, Gaffen SL. IL-17 and the Th17 lineage in systemic lupus erythematosus. Curr Opin Rheumatol. 2008;20:519–25. doi: 10.1097/BOR.0b013e328304b6b5. [DOI] [PubMed] [Google Scholar]
- 19.Apostolidis SA, Lieberman LA, Kis-Toth K, Crispin JC, Tsokos GC. The dysregulation of cytokine networks in systemic lupus erythematosus. J Interferon Cytokine Res. 2011;31:769–79. doi: 10.1089/jir.2011.0029. [DOI] [PMC free article] [PubMed] [Google Scholar]
- 20.Pernis AB. Th17 cells in rheumatoid arthritis and systemic lupus erythematosus. J Intern Med. 2009;265:644–52. doi: 10.1111/j.1365-2796.2009.02099.x. [DOI] [PubMed] [Google Scholar]
- 21.Stirzaker R, Biswas P, Gupta S, Song L, Bhagat G, Pernis A. Administration of Fasudil, a ROCK inhibitor, attenuates disease in lupus-prone NZB/W F1 female mice. Lupus. 2012 doi: 10.1177/0961203312436862. [DOI] [PubMed] [Google Scholar]
- 22.Liu PY, Liao JK. A method for measuring Rho kinase activity in tissues and cells. Methods Enzymol. 2008;439:181–9. doi: 10.1016/S0076-6879(07)00414-4. [DOI] [PMC free article] [PubMed] [Google Scholar]
- 23.Gupta S, Xia D, Jiang M, Lee S, Pernis AB. Signaling pathways mediated by the TNF- and cytokine-receptor families target a common cis-element of the IFN regulatory factor 1 promoter. J Immunol. 1998;161:5997–6004. [PubMed] [Google Scholar]
- 24.Hochberg MC. Updating the American College of Rheumatology revised criteria for the classification of systemic lupus erythematosus. Arthritis Rheum. 1997;40:1725. doi: 10.1002/art.1780400928. [DOI] [PubMed] [Google Scholar]
- 25.Petri M, Kim MY, Kalunian KC, Grossman J, Hahn BH, Sammaritano LR, et al. Combined oral contraceptives in women with systemic lupus erythematosus. The New England journal of medicine. 2005;353:2550–8. doi: 10.1056/NEJMoa051135. [DOI] [PubMed] [Google Scholar]
- 26.Hua J, Kirou K, Lee C, Crow MK. Functional assay of type I interferon in systemic lupus erythematosus plasma and association with anti-RNA binding protein autoantibodies. Arthritis Rheum. 2006;54:1906–16. doi: 10.1002/art.21890. [DOI] [PubMed] [Google Scholar]
- 27.Wan W, Murphy PM. Regulation of Atherogenesis by Chemokine Receptor CCR6. Trends in cardiovascular medicine. 2011;21:140–4. doi: 10.1016/j.tcm.2012.04.003. [DOI] [PMC free article] [PubMed] [Google Scholar]
- 28.Comerford I, Bunting M, Fenix K, Haylock-Jacobs S, Litchfield W, Harata-Lee Y, et al. An immune paradox: how can the same chemokine axis regulate both immune tolerance and activation?: CCR6/CCL20: a chemokine axis balancing immunological tolerance and inflammation in autoimmune disease. BioEssays : news and reviews in molecular, cellular and developmental biology. 2010;32:1067–76. doi: 10.1002/bies.201000063. [DOI] [PubMed] [Google Scholar]
- 29.Stohl W, Metyas S, Tan SM, Cheema GS, Oamar B, Xu D, et al. B lymphocyte stimulator overexpression in patients with systemic lupus erythematosus: longitudinal observations. Arthritis and rheumatism. 2003;48:3475–86. doi: 10.1002/art.11354. [DOI] [PubMed] [Google Scholar]
- 30.Zhang J, Roschke V, Baker KP, Wang Z, Alarcon GS, Fessler BJ, et al. Cutting edge: a role for B lymphocyte stimulator in systemic lupus erythematosus. Journal of immunology. 2001;166:6–10. doi: 10.4049/jimmunol.166.1.6. [DOI] [PubMed] [Google Scholar]
- 31.Cheema GS, Roschke V, Hilbert DM, Stohl W. Elevated serum B lymphocyte stimulator levels in patients with systemic immune-based rheumatic diseases. Arthritis and rheumatism. 2001;44:1313–9. doi: 10.1002/1529-0131(200106)44:6<1313::AID-ART223>3.0.CO;2-S. [DOI] [PubMed] [Google Scholar]
- 32.Petri M, Stohl W, Chatham W, McCune WJ, Chevrier M, Ryel J, et al. Association of plasma B lymphocyte stimulator levels and disease activity in systemic lupus erythematosus. Arthritis and rheumatism. 2008;58:2453–9. doi: 10.1002/art.23678. [DOI] [PubMed] [Google Scholar]
- 33.Furie R, Petri M, Zamani O, Cervera R, Wallace DJ, Tegzova D, et al. A phase III, randomized, placebo-controlled study of belimumab, a monoclonal antibody that inhibits B lymphocyte stimulator, in patients with systemic lupus erythematosus. Arthritis and rheumatism. 2011;63:3918–30. doi: 10.1002/art.30613. [DOI] [PMC free article] [PubMed] [Google Scholar]
- 34.Navarra SV, Guzman RM, Gallacher AE, Hall S, Levy RA, Jimenez RE, et al. Efficacy and safety of belimumab in patients with active systemic lupus erythematosus: a randomised, placebo-controlled, phase 3 trial. Lancet. 2011;377:721–31. doi: 10.1016/S0140-6736(10)61354-2. [DOI] [PubMed] [Google Scholar]
- 35.Niewold TB, Hua J, Lehman TJ, Harley JB, Crow MK. High serum IFN-alpha activity is a heritable risk factor for systemic lupus erythematosus. Genes Immun. 2007;8:492–502. doi: 10.1038/sj.gene.6364408. [DOI] [PMC free article] [PubMed] [Google Scholar]
- 36.Hooks JJ, Moutsopoulos HM, Geis SA, Stahl NI, Decker JL, Notkins AL. Immune interferon in the circulation of patients with autoimmune disease. The New England journal of medicine. 1979;301:5–8. doi: 10.1056/NEJM197907053010102. [DOI] [PubMed] [Google Scholar]
- 37.Weckerle CE, Franek BS, Kelly JA, Kumabe M, Mikolaitis RA, Green SL, et al. Network analysis of associations between serum interferon-alpha activity, autoantibodies, and clinical features in systemic lupus erythematosus. Arthritis and rheumatism. 2011;63:1044–53. doi: 10.1002/art.30187. [DOI] [PMC free article] [PubMed] [Google Scholar]
- 38.Kirou KA, Lee C, George S, Louca K, Peterson MG, Crow MK. Activation of the interferon-alpha pathway identifies a subgroup of systemic lupus erythematosus patients with distinct serologic features and active disease. Arthritis and rheumatism. 2005;52:1491–503. doi: 10.1002/art.21031. [DOI] [PubMed] [Google Scholar]
- 39.Kariuki SN, Franek BS, Kumar AA, Arrington J, Mikolaitis RA, Utset TO, et al. Trait-stratified genome-wide association study identifies novel and diverse genetic associations with serologic and cytokine phenotypes in systemic lupus erythematosus. Arthritis Res Ther. 2010;12:R151. doi: 10.1186/ar3101. [DOI] [PMC free article] [PubMed] [Google Scholar]
- 40.Zhang X, Tao Y, Troiani L, Markovic-Plese S. Simvastatin inhibits IFN regulatory factor 4 expression and Th17 cell differentiation in CD4+ T cells derived from patients with multiple sclerosis. J Immunol. 2011;187:3431–7. doi: 10.4049/jimmunol.1100580. [DOI] [PubMed] [Google Scholar]
- 41.Yang J, Chu Y, Yang X, Gao D, Zhu L, Wan L, et al. Th17 and natural Treg cell population dynamics in systemic lupus erythematosus. Arthritis and rheumatism. 2009;60:1472–83. doi: 10.1002/art.24499. [DOI] [PubMed] [Google Scholar]
- 42.Wong CK, Lit LC, Tam LS, Li EK, Wong PT, Lam CW. Hyperproduction of IL-23 and IL-17 in patients with systemic lupus erythematosus: implications for Th17-mediated inflammation in auto-immunity. Clin Immunol. 2008;127:385–93. doi: 10.1016/j.clim.2008.01.019. [DOI] [PubMed] [Google Scholar]
- 43.Zhao XF, Pan HF, Yuan H, Zhang WH, Li XP, Wang GH, et al. Increased serum interleukin 17 in patients with systemic lupus erythematosus. Molecular biology reports. 2010;37:81–5. doi: 10.1007/s11033-009-9533-3. [DOI] [PubMed] [Google Scholar]
- 44.Shah K, Lee WW, Lee SH, Kim SH, Kang SW, Craft J, et al. Dysregulated balance of Th17 and Th1 cells in systemic lupus erythematosus. Arthritis Res Ther. 2010;12:R53. doi: 10.1186/ar2964. [DOI] [PMC free article] [PubMed] [Google Scholar]
- 45.Poppe D, Tiede I, Fritz G, Becker C, Bartsch B, Wirtz S, et al. Azathioprine suppresses ezrin-radixin-moesin-dependent T cell-APC conjugation through inhibition of Vav guanosine exchange activity on Rac proteins. Journal of immunology. 2006;176:640–51. doi: 10.4049/jimmunol.176.1.640. [DOI] [PMC free article] [PubMed] [Google Scholar]
- 46.Pernis AB. Rho GTPase-mediated pathways in mature CD4+ T cells. Autoimmun Rev. 2009;8:199–203. doi: 10.1016/j.autrev.2008.07.044. [DOI] [PubMed] [Google Scholar]
- 47.Skaggs BJ, Hahn BH, McMahon M. Accelerated atherosclerosis in patients with SLE--mechanisms and management. Nat Rev Rheumatol. 2012;8:214–23. doi: 10.1038/nrrheum.2012.14. [DOI] [PMC free article] [PubMed] [Google Scholar]
- 48.Salmon JE, Roman MJ. Subclinical atherosclerosis in rheumatoid arthritis and systemic lupus erythematosus. Am J Med. 2008;121:S3–8. doi: 10.1016/j.amjmed.2008.06.010. [DOI] [PMC free article] [PubMed] [Google Scholar]