

Abstract
Cells in the animal early visual cortex are sensitive to contour orientations and form repeated structures known as orientation columns. At the behavioral level, there exist 2 well-known global biases in orientation perception (oblique effect and radial bias) in both animals and humans. However, their neural bases are still under debate. To unveil how these behavioral biases are achieved in the early visual cortex, we conducted high-resolution functional magnetic resonance imaging experiments with a novel continuous and periodic stimulation paradigm. By inserting resting recovery periods between successive stimulation periods and introducing a pair of orthogonal stimulation conditions that differed by 90° continuously, we focused on analyzing a blood oxygenation level-dependent response modulated by the change in stimulus orientation and reliably extracted orientation preferences of single voxels. We found that there are more voxels preferring horizontal and vertical orientations, a physiological substrate underlying the oblique effect, and that these over-representations of horizontal and vertical orientations are prevalent in the cortical regions near the horizontal- and vertical-meridian representations, a phenomenon related to the radial bias. Behaviorally, we also confirmed that there exists perceptual superiority for horizontal and vertical orientations around horizontal and vertical meridians, respectively. Our results, thus, refined the neural mechanisms of these 2 global biases in orientation perception.
Keywords: fMRI, oblique effect, orientation, primary visual cortex, radial bias
Introduction
Cells in the early visual cortex in many species of animals are sensitive to contour orientations (Hubel and Wiesel 1962, 1968). Using functional magnetic resonance imaging (fMRI), preferences for stimulus orientation have also been inferred (Tootell, Hadjikhani, Vanduffel et al. 1998; Boynton and Finney 2003; Fang et al. 2005; Liu et al. 2006; Serences et al. 2009; Weigelt et al. 2012) and decoded (Haynes and Rees 2005; Kamitani and Tong 2005; Harrison and Tong 2009; Swisher et al. 2010) in the human visual cortex. Orientation preferences are continuously represented, forming repeated structures known as orientation columns (Blasdel and Salama 1986; Grinvald et al. 1986). High-resolution fMRI has been successfully used for visualizing orientation columns in cats (Kim et al. 2000; Duong et al. 2001; Fukuda et al. 2006; Moon et al. 2007) and humans (Yacoub et al. 2008).
At the behavioral level, there are 2 well-known global biases in orientation perception. One is the oblique effect, referring to the observation that both humans and animals have a greater behavioral sensitivity to the gratings of cardinal (horizontal and vertical) orientations than to the gratings of oblique orientations (Appelle 1972). The other is the radial bias, describing a biased sensitivity to radial orientations at particular angles (Sasaki et al. 2006; Freeman et al. 2011). However, it is still unclear how these behavioral superiorities for certain orientations are achieved within the early visual cortex. Alternative neural mechanisms have been hypothesized, with one proposing that the more cortical area is devoted to achieve this superiority (e.g. Maffei and Campbell 1970), and the other suggesting that stronger neuronal responses could be the source (e.g. Mansfield and Ronner 1978). In comparison to numerous animal single-unit and optical imaging studies, human fMRI studies so far have provided only limited evidence that can contribute to this debate, as blood oxygenation level-dependent (BOLD) responses to different orientations were compared with relatively coarse spatial resolutions in the previous studies (e.g. Furmanski and Engel 2000; Sasaki et al. 2006; Mannion et al. 2009, 2010; Freeman et al. 2011). Thus, it is necessary to address these issues at higher spatial resolutions, preferentially at the columnar (sub-millimeter) resolutions. Furthermore, to deal with the increased scan time that accompanies the high-resolution fMRI approaches, it is desirable to utilize more efficient stimulation paradigms (in comparison with traditional, time-consuming block designs) so that orientation preferences at the single-voxel level can be revealed within a limited experimental time.
A continuous stimulation paradigm, in which a grating rotates continuously, thus covering all orientations over a short period of time, has been used to reveal orientation-tuning properties of single voxels in high-resolution fMRI studies (Fukuda et al. 2006; Moon et al. 2007; Yacoub et al. 2008). We have found, however, that the BOLD signal is not sensitive enough to capture the modulatory effect caused by the change in stimulus orientation when the original paradigm is used. The failure is primarily attributed to 2 phenomena; the first is the gradual decrease in BOLD response, possibly caused by neural adaptation mechanisms (Movshon and Lennie 1979; Hammond et al. 1985), and the second is the phase inconsistency of BOLD response to the repeated presentation of particular orientations, noticeably in the latter stage of the stimulation period (Bandettini et al. 1997; Mintun et al. 2002; Lin et al. 2009).
To overcome these shortcomings, we devised a stimulation paradigm that retains the basic feature of the continuous and periodic presentation of the full-range of orientations with 2 key modifications. First, we inserted a resting recovery period following the presentation of the full-range of orientations, which allowed a robust BOLD response to be evoked every time when the stimulus appeared, and secondly, we introduced a pair of orthogonal stimulation conditions, which allowed us to extract the maximal BOLD response modulated by the change in stimulus orientation using the differential analysis method (Grinvald et al. 2000). Using this stimulation paradigm, we quantitatively investigated global distribution features of single voxels’ orientation preferences. We found that there are more voxels preferring horizontal and vertical orientations at the positions of the horizontal- and vertical-meridian representations, thus refining the neural mechanisms of the oblique effect (Appelle 1972) and radial bias (Sasaki et al. 2006; Freeman et al. 2011).
Materials and Methods
Subjects
Six subjects (ages 20–35, 3 males) participated in the main fMRI experiment. Three of them also participated in 3 additional control fMRI experiments and 5 took part in a psychophysical experiment measuring discrimination thresholds of line orientations at different meridian locations and eccentricities. All subjects were healthy, without past history of psychiatric or neurological diseases, had a normal or corrected-to-normal vision and gave their written informed consent before each experiment. All experiments were approved by the RIKEN Functional MRI Safety and Ethics Committee.
Imaging Hardware
All fMRI experiments were conducted on a 4 T whole-body MRI system equipped with a head gradient system (Agilent Inc., Santa Clara, CA, United States of America). High-resolution 3-dimensional T1-weighted anatomical magnetic resonance images were acquired with a birdcage radio-frequency (RF) coil. A 3-inch single-loop transmit/receive RF surface coil was used to acquire functional and co-registered anatomical images in the functional experiment. The surface coil was mounted on a support frame attached to the patient table.
During the experiment, the subject was asked to lie supine on the patient table and to rest the back of the head on the surface coil. Head motion was restricted using a bite-bar as well as foam rubber padding and monitored with 2 pressure sensors placed adjacent to the subject's head. The subject's heartbeat was monitored with a pulse oximeter, and respiration was monitored with a pressure sensor placed on the abdominal region. Both signals were recorded along with the timing of RF pulses for later corrections of physiological fluctuations (Hu et al. 1995).
Visual Stimulation
The presentation of visual stimuli in fMRI experiments was controlled using the Psychophysics Toolbox extensions (Brainard 1997; Pelli 1997) in Matlab (The MathWorks, Inc., Natick, MA, United States of America) run on a PowerMac G4 computer. Stimuli were delivered to the subject's eyes via an optic fiber liquid crystal display goggle system (Avotec, Inc., Jensen Beach, FL, United States of America) that subtended 25° × 19° of visual angle. The image on the goggles had a resolution of 800 × 600 pixels and was presented with a refresh rate of 60 Hz. The subject adjusted 2 refractive correction lenses on the goggles to achieve a corrected-to-normal vision. Image acquisition and stimulus presentation times were synched and a trigger signal was sent from the scanner's console to the PowerMac G4 computer equipped with a digital I/O board (PCI-DIO-96, National Instruments, Austin, TX, United States of America). All signals related to the timing of RF pulses, stimulus onset and offset, as well as the state of the subject, including physiological data, behavioral performance, head position, and eye position, were simultaneously recorded using an another PowerMac G4 computer with a data acquisition board (PCI-6023E, National Instruments) and a custom-built program written in LabView (National Instruments).
A circular square-wave grating (18° in diameter, 2 cycles per degree, no drifting, 78% contrast) was used in the experiment. In a pilot experiment, we tested with both stationary and drifting gratings and confirmed that orientation preferences of individual voxels were indifferent no matter what type of the grating was used. The stationary grating was adopted because the subject reported that stationary grating, when rotated in steps (see below), could be perceived more smoothly. The foveal region surrounding the fixation cross (up to 1.5° from the center of the fixation cross) was filled with homogeneous gray color. Throughout the experiment, the subject was instructed to fixate on the central fixation cross. To help maintain fixation and the level of arousal, the subject performed a detection task on the fixation cross. Every 2–5 s, the luminance of the fixation cross was increased for 100 ms, and the subject was to report that event with a button press. The task itself was only moderately demanding. As a result, all subjects performed the task almost perfectly. Nevertheless, the subject's eye position was monitored using the eye tracker built into the goggle system via the software package iView (SensoMotoric Instruments, Boston, MA, United States of America). Offline analysis confirmed that the subject maintained a fixation throughout the experiment.
Imaging Parameters and Experimental Paradigms
Before the main experiment, the retinotopy of individual subjects was mapped using a standard visual-field mapping method (Wandell et al. 2007). Prior to each functional experiment, T1-weighted anatomical images at the same slice positions as functional images were acquired with a 4-segment MPRAGE pulse sequence. In the functional experiment, 4 contiguous slices (field of view, 16 × 8 cm2; matrix size, 256 × 128; in-plane resolution, 0.625 × 0.625 mm2; slice thickness, 3 mm) were placed to cover either the dorsal or the ventral primary visual cortex on 1 hemisphere of the subject. This prescription procedure, as it has been previously detailed (Cheng et al. 2001), was to ensure that a portion of the cortex selected based on morphological and retinotopic criteria could be optimally covered with a limited number of slices for the sake of a reasonable sampling rate (i.e. volume time repetition (TR), see below).
The stimulus in the main fMRI experiment was continuously and periodically presented. The basic idea of the paradigm was to use a continuously rotating high-contrast grating to stimulate visually responsive voxels. If a voxel is orientation selective, its response measured in the BOLD signal should be modulated temporally by the rotating grating that changes orientation gradually over the stimulation time. Further, because the rotation with a full-cycle of orientations (0–180°) is repeated periodically, the voxel's response should also be periodic and a Fourier analysis of the time course at the stimulation frequency would determine the phase (orientation) at which the peak response is evoked, thus allowing us to infer the voxel's orientation preference. To exploit the fact that neurons respond maximally at their preferred orientations and minimally at orientations orthogonal to their preferred orientations (Hubel and Wiesel 1962, 1968), we adopted the differential analysis method by introducing a pair of stimulation conditions whose orientations are orthogonal to each other. For the differential BOLD response to this pair of orthogonal conditions, it is expected that the modulatory orientation effect (alternating current [AC] components) will be enhanced and other response components (direct current [DC] components) that are not directly related to orientation changes (e.g. the stimulus onset and offset and neural adaptation) will be reduced.
To focus on the initial stimulation phase, where the problems of neural adaptation and loose neurovascular coupling are minimal and orientation modulation can be better revealed, we modified the stimulation paradigm by adding a resting period after each individual stimulation period. Specifically, the subject viewed multiple epochs of 1.5 cycles (36 s) of rotating gratings that were sandwiched between 24 s blank displays. A full-cycle rotation (0–180°) completed in 24 s (this rotation time was empirically chosen based on our preliminary experiments where rotation times of 12, 24, and 32 s, were tested), in clockwise direction in steps (0.5 s per step; orientation difference between successive steps was 3.75°). The 1.5 cycles were chosen to compromise between avoiding the sudden strong response at the onset of the grating appearance (in case 1 cycle is used) and shortening total scan time (in case 2 or more cycles are used). In individual stimulation periods, the grating started rotating from either the horizontal (H) or the vertical (V) orientation, thus creating 2 orientation conditions that were continuously orthogonal to each other. Each orientation condition was repeated 12 times and the 2 conditions were presented in an H–V–V–H–H–V–V–H–H–V–V–H–H–V–V–H–H–V–V–H–H–V–V–H order. Functional images were acquired using a high-resolution (0.625 × 0.625 × 3 mm3), 4-segment centric-ordered echo-planar imaging (EPI) pulse sequence (4 slices per volume; volume TR, 2 s; echo time, 25 ms; average flip angle, 45°) to target a retinotopically-defined quadrant of the primary visual cortex (V1). In total, 735 volumes of EPI images over 1470 s were collected in the experiment.
The same stimulation paradigm was also used in 3 additional control experiments to examine the effects of rotation direction, starting orientations in each pair of orthogonal conditions, and stimulus presentation period. In the first control experiment, the rotation direction of grating was changed from clockwise to counter-clockwise. In the second control experiment, each pair of rotations started from either 0° and 90° or 45° and 135°. In the third control experiment, the stimulation period of grating was extended from 1.5 to 2.5 cycles. The results from these control experiments are summarized in the Supplementary Results and Supplementary Figure S1.
Data Processing and Analysis
In all functional scans, longitudinal magnetization was allowed to reach steady state before EPI images were collected by the use of dummy scans. EPI distortions were minimized using a reference volume (without phase encoding) acquired at the beginning of each scan (Bruder et al. 1992). The first echo in each segment was a navigator echo, which was used to correct inter-segment phase and amplitude variations (Kim et al. 1996). Cardiac and respiratory fluctuations were removed from time series images using a retrospective estimation and correction method, which employed pulsation and respiration data recorded during image acquisition (Hu et al. 1995). In-plane motion correction was also applied (Maas et al. 1997). Both corrections were carried out using k-space data. In addition, a high-pass filter was used to suppress baseline signal drifts. No other spatial or temporal smoothing was applied.
For the data obtained in the main experiment, the significance of orientation modulation embedded in the raw time course was determined on a voxel-by-voxel basis as follows. First, the mean hemodynamic response to each stimulus condition was estimated using a deconvolution approach (Dale 1999). This procedure assumes a linear temporal summation of the fMRI responses (Boynton et al. 1996; Dale and Buckner 1997), but does not assume any particular shape for the time course of the hemodynamic impulse response function. The goodness-of-fit for the deconvolution model was assessed by the amount of variance accounted for by the estimated hemodynamic responses, r2. The significance (P-values) for the r2 values was computed using a permutation method described previously (Gardner et al. 2005). For each voxel, the P-value gave an estimation of how well the voxel responded to the visual stimulation, including both a DC component evoked by the high-contrast grating and an AC component modulated by the change in stimulus orientation.
We then created a differential time course for each voxel that passed the threshold set for the r2 value by subtracting neighboring pairs of raw BOLD responses to the 2 orthogonal conditions. For each of the 12 pairs of H and V conditions as described above, the original BOLD response to the H condition was subtracted from that to the V condition. The resultant differential time course was thus composed of 12 repeats of a 60 s period (30 volumes), with the first 36 s (18 volumes) exhibiting the difference in response to the 2 orthogonal conditions and the remaining 24 s (12 volumes) reflecting the difference in the baseline fluctuation. To take the hemodynamic delay into account and concentrate on analyzing the differential response modulated by the change in stimulus orientation, we discarded the first 6 and last 12 volumes from each period. The retained 12 volumes in the period (temporally corresponding to the latter full-cycle stimulation with the rotating grating) were then concatenated to form a single differential time-course (144 volumes). Because the subtraction largely removed the DC components that were common between the 2 orthogonal conditions, this differential time course reflected primarily the AC component that was modulated by stimulus orientation.
To determine the significance of orientation modulation contained in the differential time course, a fast Fourier analysis was applied and the coherence coefficient (cc) was estimated for each voxel. The cc is defined as the amplitude of the stimulus frequency (i.e. 12 cycles in this case) divided by the sum of squares of all frequency components by the following formula (Engel et al. 1997).
 |
where  is the stimulus frequency, F is the signal intensity of the Fourier transformed time course. Before the Fourier analysis was performed, a low-cut de-trending was applied to the differential time course.
Because the cc reflects the correlation between a sinusoidal function and the differential time course (Engel et al. 1997), its significance can be estimated, based on the approximation that the cc has an F-distribution in the null hypothesis (i.e. zero coherence) with an assumption of white (temporally uncorrelated) noise, by the following formula (Bandettini et al. 1993; Tootell, Hadjikhani, Hall, et al. 1998):
where n is the number of frequencies. For example, the cc of 0.23 in our study (n= 72) corresponds to an F-value of 3.98, which gives a P-value of approximately 0.05. All statistical analyses mentioned above were performed using in-house developed functions written in Matlab, a Matlab Toolbox for circular statistics (Berens 2009) and the software package MrTools developed at the New York University and RIKEN Brain Science Institute (http://gru.brain.riken.jp).
The hemodynamic response delay, which could cause a systemic time shift of orientation preference in our study, was corrected by comparing the similarity between orientation preferences obtained in experiments where the grating was rotated in clockwise and counter-clockwise directions, similar to the approach used in the retinotopic mapping (Wandell et al. 2007). In brief, the voxels with a significant orientation modulation in the clockwise experiment were first selected using the procedure described above. Then, for the same voxels, we obtained differential time courses from the counter-clockwise experiment and time-reversed these differential time courses. The Fourier analysis was applied to both the differential time courses obtained in the clockwise experiment and the reversed differential time courses obtained in the counter-clockwise experiment and 2 sets of phases for all voxels were obtained. We then shifted these 2 sets of phases in opposite directions (in number of image volumes) and calculated the linear correlation of voxel-wise phases between the clockwise and counter-clockwise experiments after each shift. The shift that gave the largest linear correlation value was defined as the time delay in the hemodynamic response. Based on the results from 3 subjects, the hemodynamic delay in our study was ∼ 6 s (3 volumes), which was then applied to the data obtained from all 6 subjects.
Limited by the number of slices that could be prescribed in this high-resolution fMRI study (see above), only 1 quadrant of the visual field in V1 was completely covered for each subject. In total, data from 4 dorsal V1s in the right hemisphere, 1 ventral V1 in the right and 1 ventral V1 in the left were collected. In the group analysis, the data from different subjects (thus different quadrants) were collapsed and represented in a new coordinate system (see Supplementary Fig. S2 for explanations). The abscissa of the coordinate represents each voxel's retinotopic polar angle, which was converted to within 0–90° and the ordinate represents the voxel's orientation preference, which was converted to take the value either between −90 and 0° or between 0 and 90°. In this coordinate system, a voxel at 0° polar angle having a 0° orientation preference is a horizontal-meridian voxel preferring horizontal orientation, and a voxel at 90° polar angle having a −90° or 90° orientation preference is a vertical-meridian voxel preferring vertical orientation; both voxels can be regarded as having radial-angle orientation preferences. Similarly, a voxel at 45° polar angle having a 45° orientation preference is a voxel having a radial-angle orientation preference and a voxel at 45° polar angle having a −45° orientation preference is a voxel whose orientation preference is complementary to the radial angle.
Psychophysical Experiment Determining Orientation Discrimination Thresholds
The orientation sensitivity at various locations of the visual field was assessed for 5 of the 6 subjects who had participated in the main fMRI experiment, using a line orientation discrimination task (Westheimer 2003). Stimulus locations were distributed along the horizontal (0°/180°), vertical (90°/270°), and 2 principal oblique (45°/225° and 135°/315°) meridians at 2 eccentricities (4° and 8°). The line length was 0.45° at 4° eccentricity and 0.90° at 8° eccentricity and the width was 0.04° at both eccentricities. The stimuli were generated using a smooth line function in PsychToolbox (DrawLines) on an Apple Mac Pro computer and presented on a 21″ cathode ray tube display (Dell p1013, with a resolution of 1800 × 1440 pixels and a refresh rate of 75 Hz) through a 2-dimensional Gaussian aperture. The aperture was the same as the line length in size and had 2 standard deviations with the full transparency centered at the center of the line. The experiment was conducted in a darkened room. The luminance of the line and background was 83.7 and 0.06 cd/m2, respectively.
At each location, the discrimination thresholds were obtained for 4 line orientations, namely horizontal, vertical, 45° and 135° orientations. In a given trial, a reference line for a fixed orientation was first presented for 300 ms, followed by a blank screen for 600 ms, and then a test line with 1 of 7 orientations (equally spaced intervals, centered on the reference orientation) was presented for another 300 ms at the same location. After the presentation of the test line, the subject was asked to report by pressing 1 of the 2 buttons whether the test line appeared to have a more clockwise or counter-clockwise orientation than the reference line within 2 s. The inter-trial interval was 3 s. For each reference orientation that was continuously tested, 70 trials (10 trials for each test orientation) were conducted in a randomized order. In total, 280 trials were collected in a run for 4 reference orientations at 1 meridian location. Typically, 4–8 runs were conducted in an experimental session, and a total of 32 runs (2 runs per location) were obtained for all 16 locations at both eccentricities over several sessions. For each subject, the test order of reference orientations and meridian locations at each eccentricity was pseudo-randomly assigned. Before the formal experiment was commenced, the subject went through sufficient training so that the thresholds could be stabilized and proper intervals for the 7 orientations of the test line could be empirically determined.
During the experiment, the subject viewed stimuli binocularly at a distance of ∼57 cm and was asked to fixate on the central fixation cross. The eye position was monitored using an eye tracker (EyeLink 1000, SR Research, Kanata, Ontario, Canada) and offline analysis confirmed that the subject maintained a fixation during the experiment. Data collected across 32 runs were combined and analyzed by the method of probits (Finney 1971), using a Generalized Linear Model regression function in Matlab. A threshold for each reference orientation at each meridian location, defined in degrees different from the reference orientation, was obtained by taking half the difference between the 2 orientations that respectively generated 25% and 75% correct responses on the psychometric curve.
Results
Revealing Orientation Selectivity of Single Voxels Using a Continuous and Periodic Stimulation Paradigm with a Differential Analysis Method
To study orientation-tuning properties of single voxels in the human V1, we used a continuous and periodic stimulation paradigm (Engel et al. 1994; Kalatsky and Stryker 2003; Wandell et al. 2007; Engel 2011) and a differential analysis method (Grinvald et al. 2000) (see Materials and Methods). The raw time course of a single voxel's BOLD response using this stimulation paradigm is shown in Figure 1A (black trace), which resembles what is observed typically with a blocked design, displaying periodic elevations of BOLD responses in between non-stimulated periods. The orientation modulation embedded in the raw time course was unveiled as follows. First, we used a deconvolution approach (Dale 1999) to extract estimated hemodynamic responses to the 2 orthogonal gratings, which exhibited typical BOLD response features (Fig. 1B). After the onset of stimulation, the BOLD response rose quickly, yielding a robust sustained (∼38–40 s) positive response with an overshoot, and after the cessation of stimulation, the response returned to the baseline gradually. Sitting on top of the sustained elevation, there were clear temporal modulations seen in both hemodynamic responses that followed the change in stimulus orientation, and importantly, the 2 orthogonal conditions resulted in almost opposite phases in the modulation (Fig. 1B, compare the blue and cyan curves in the shaded region). We then obtained a differential time course by subtracting the estimated hemodynamic response for the horizontal condition from the vertical condition. This procedure removed larger response components that were not directly related to orientation changes, such as the sustained response to the presence of a high-contrast grating, responses to the stimulus onset and offset, and the response decay as a consequence of neural adaptation (DC components), and resulted in an enhanced modulatory effect that was primarily caused by changes in stimulus orientation in the 2 conditions (AC components) (Fig. 1B, black trace).
Figure 1.
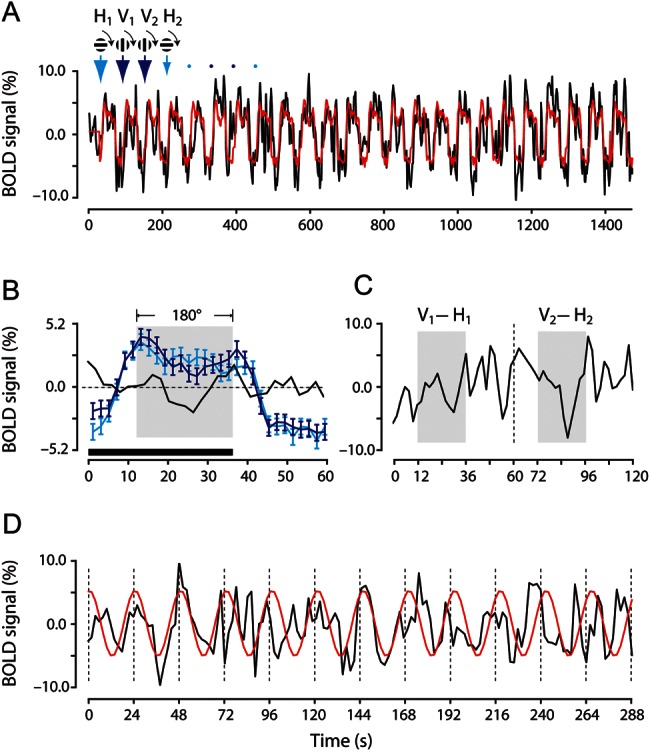
Orientation selectivity revealed by using a continuous and periodic stimulation paradigm and a differential analysis method. (A) The raw and estimated time courses from a representative V1 voxel. The BOLD response was measured, while the subject viewed a grating that started to rotate either in horizontal (indicated by cyan arrows) or in vertical (blue arrows) orientation. Each rotation lasted 1.5 cycles, and critically, was followed by a 24 s blank period. A full-cycle (0–180°) rotation took 24 s and there were 12 repeats for each rotation condition in a functional scan. The initial orientation and rotation direction of the grating are schematically indicated above the time courses and the arrows point at the start times of individual rotations. (B) Estimated hemodynamic responses of the voxel to the grating that started to rotate in the horizontal (cyan) and vertical (blue) orientations, respectively. The black curve shows the difference between the 2 estimated hemodynamic responses (blue minus cyan curve). The horizontal bar indicates the stimulation period and the shaded area indicates the final full-cycle stimulation between 12 and 36 s. (C) Time course showing the difference between BOLD responses to the grating that started rotation from the vertical orientation (e.g. V1 and V2) and that to the grating that started rotation from the horizontal orientation (e.g. H1 and H2) for the first 2 pairs of gratings. Shaded areas indicate differential responses in the final full-cycle of rotation between 12 and 36 s. (D) The differential time course constructed by concatenating 12 truncated differential responses obtained in the final full-cycle. The red curve is the sinusoidal fit to the differential time course.
Quantification of Orientation Selectivity
To quantify the orientation selectivity revealed by using our stimulation paradigm, we assessed the significance of single voxels’ overall responses to the stimulation and their selectivity for stimulus orientation by performing the following 2 analyses. We first asked how reliably individual voxels in retinotopically-defined regions responded to the visual stimulation, including the DC elevation of the BOLD response to the constant presence of the grating and the AC modulation of the BOLD response to the grating rotation. This was determined on a voxel-by-voxel basis using a procedure developed previously (Gardner et al. 2005). Briefly, we calculated the amount of variance in the raw time course (e.g. the black trace in Fig. 1A) that was accounted for by the time course constructed using the estimated hemodynamic responses (e.g. the red trace in Fig. 1A). This value, r2, ranging from 0.0 to 1.0, represents the goodness-of-fit. The smaller the residual difference between the raw time course and estimated hemodynamic responses is, the bigger the r2 value is. The statistical significance of r2 values was determined in a permutation procedure comparing the distribution of another set of r2 values calculated using the same data but randomly shuffled stimulus times. Because no particular shape for the BOLD response was assumed in the deconvolution, both positive and negative hemodynamic responses could have survived the above procedure. By setting threshold r2 values (P < 0.05) for individual subjects, we identified between 5675 and 12,578 voxels that exhibited significant BOLD responses from 6 subjects (Table 1, second column). In addition, we also introduced another criterion (estimated hemodynamic response >0.5%) typically used in our laboratory for studies employing similar visual stimuli to remove the voxels that were weak in response and tended to be located outside the gray matter (likely due to partial voluming). In total, between 3967 and 9069 voxels from 6 subjects survived and were regarded as visually responsive voxels in the present study (Table 1, third column).
Table 1.
Number of voxels after each selection criterion
| Subject | Number of voxels (%) after selection with r2 value, P< 0.05 | Number of voxels (%) after selection with estimated hemodynamic response <0.5% | Number of voxels (%) after selection with cc value, P < 0.05 |
|---|---|---|---|
| S1 | 10,864 (100) | 8950 (82.4) | 3955 (36.4) |
| S2 | 11,196 (100) | 8904 (79.5) | 3405 (30.4) |
| S3 | 8731 (100) | 7675 (87.9) | 3612 (41.4) |
| S4 | 12,578 (100) | 9069 (72.1) | 3794 (30.2) |
| S5 | 6851 (100) | 3967 (57.9) | 2946 (43.0) |
| S6 | 5675 (100) | 4569 (80.5) | 1727 (30.4) |
| Mean (%) | 100 | 76.7 | 35.3 |
We then determined the statistical significance of orientation modulation for the voxels that passed the above thresholds. For this purpose, we first constructed a differential time course from its original time course (the black trace in Fig. 1A) for each voxel. This differential time course was composed of 12 pair-wise subtractions between neighboring BOLD responses to the grating that started rotation from the vertical orientation (e.g. Fig. 1A, V1 and V2) and to the grating that started rotation from the horizontal orientation (e.g. Fig. 1A, H1 and H2). For each of 12 resultant subtracted BOLD responses (e.g. Fig. 1C, V1–H1 and V2–H2), the original 60 s time course was truncated to retain only the 24 s period corresponding to the final full-cycle (0–180°) orientation change (Fig. 1C, shaded ranges). All 12 truncated responses from the voxel were eventually appended to form a single differential time course, which reflected primarily the AC component that was repeatedly modulated by stimulus orientation (Fig. 1D, black trace). We applied the Fourier analysis to the differential time courses of these selected voxels and calculated their ccs. For a representative subject, these values for the voxels that responded significantly to overall visual stimulation, ranged from 0.01 to 0.75, with a mean of 0.15 (Fig. 2A; across all the 6 subjects, 0.16 ± 0.03, mean ± standard deviation [SD], Fig. 2B). Because a cc reflects the correlation between a sinusoidal function of a particular frequency and a voxel's differential time course (Engel et al. 1997), we estimated its significance based on the approximation that the cc follows an F-distribution in the null assumption, that is, zero coherence (Bandettini et al. 1993; Tootell, Hadjikhani, Hall, et al. 1998). We set the threshold for the cc at 0.23 (P < 0.05). On average, slightly more than a third of the voxels that exhibited significant BOLD responses passed this threshold (35.3%) and were regarded as orientation selective (see Table 1, fourth column, for numbers of selected voxels from individual subjects). It should be emphasized that the orientation preference determined using this approach did not depend on the settings of particular parameters (see Supplementary Results and Supplementary Fig. S1 for the results from control experiments).
Figure 2.

A voxel's orientation selectivity was assessed by its cc that reflects sinusoidal modulation at the stimulation frequency. (A) Distribution of ccs of all voxels that responded significantly to the visual stimulation for a representative subject. Left arrow indicates the mean of the distribution and right arrow indicates the value of cc at P < 0.05. (B) Averaged distributions of ccs obtained from 6 subjects.
Biased Orientation Representations in Human V1
Using the phase information derived from the Fourier analysis to estimate orientation preferences of activated voxels, we quantitatively investigated global distribution features of individual voxels' orientation preferences. Because the number of slices was limited in this high-resolution fMRI study, the results described below were from only 1 quadrant of V1 of each subject and were generalized across 6 subjects (see Table 2 for number of voxels and studied quadrants from individual subjects).
Table 2.
Number of voxels in the studied quadrant of V1
| Subject | Quadrant of V1 | Number of voxels (%) inside the quadrant | Number of voxels (%) not associated with large surface veins (estimated hemodynamic response <3%) |
|---|---|---|---|
| S1 | Right dorsal V1 | 661 (100) | 608 (92.0) |
| S2 | Right dorsal V1 | 402 (100) | 352 (87.6) |
| S3 | Right dorsal V1 | 499 (100) | 463 (92.8) |
| S4 | Right dorsal V1 | 616 (100) | 545 (88.5) |
| S5 | Right ventral V1 | 489 (100) | 489 (100) |
| S6 | Left ventral V1 | 308 (100) | 294 (95.5) |
| Mean (%) | 100 | 92.7 |
We first found that there are more voxels preferring horizontal and vertical (cardinal) orientations. Figure 3A illustrates these biases for a representative subject, from whom the data were acquired from the right dorsal V1, representing the left lower visual field in the parafoveal region (2–9° eccentricity). Across all 6 subjects, this tendency was significant (1-way analysis of variance (ANOVA), P < 0.001; Fig. 3C). Multiple-comparison tests also revealed that the voxels preferring cardinal orientations were significantly more (P < 0.05) than those preferring oblique orientations, whereas there was no significant difference between voxels preferring the 2 cardinal orientations or between those preferring the 2 oblique orientations. It should be emphasized that the biased population orientation selectivity observed here did not depend on the starting orientations in the pair of orthogonal conditions (see Supplementary Figs S1C,D). The biased selectivity did not depend on which stimulation period was chosen, either, as we obtained almost identical results (data not shown) when a sliding full-cycle time window was used, which was shifted gradually within the 1.5 cycles, after hemodynamic delay was adjusted. It has been well documented that both humans and animals have a greater behavioral sensitivity to the gratings of cardinal orientations than to the gratings of other oblique orientations, a phenomenon known as the oblique effect (see review in Appelle 1972) and alternative neural mechanisms underlying the oblique effect have been hypothesized, with one proposing that there are more neurons preferring cardinal orientations in the visual cortex (Maffei and Campbell 1970) and the other suggesting that the oblique effect may be related to greater responses of neurons tuned to cardinal orientations in the human visual cortex (Mansfield and Ronner 1978; Furmanski and Engel 2000). In our study, there was no evidence for the second mechanism. Although the averaged strength of BOLD responses (defined by the magnitude value from the Fourier analysis) of the voxels tuned to cardinal orientations tended to be larger than that of the voxels tuned to oblique orientations in some subjects (Fig. 3B), this trend was not significant across 6 subjects (1-way ANOVA, P = 0.41, Fig. 3D).
Figure 3.

Horizontal and vertical orientations are over-represented in human V1. (A) The number of orientation-selective voxels plotted against the preferred orientation for a representative subject. (B) The averaged percent BOLD responses of voxels plotted against their preferred orientations. (C) Proportion of orientation-selective voxels preferring cardinal (around 0° and 90°) and oblique (around 45° and 135°) orientations across 6 subjects. Each bar represents pooled orientation preferences of single voxels in a 30° range, centered at 0°, 45°, 90°, or 135°. Voxels with an estimated preferred orientation at the borders between cardinal and oblique orientations (e.g. 15°–30°) were excluded in the analysis to avoid the possible overlap between the populations. (D) The averaged percent BOLD responses of voxels tuned to cardinal and oblique orientations, averaged across all 6 subjects. Error bars in C–D indicate 1 SD. *P < 0.05.
We then examined the relationship between individual voxels' orientation preferences and their retinotopic polar angles, which is related to another global orientation bias (the radial bias) found in the early visual cortex, including V1 (Leventhal 1983; Leventhal et al. 1984; Schall et al. 1986; Sasaki et al. 2006; Freeman et al. 2011). Radial orientations are like wheel-spokes protruding from the central fixation point. The voxels showing the radial bias should have the orientation preferences that are consistent with their retinotopic polar angles, for example, the voxels located around 45° polar angle have dominant preferences for orientations near 45° and the voxels located around the horizontal/vertical meridian representations have preferences near the horizontal/vertical orientations. This relationship for a representative subject is depicted in Figure 4A. Examining Figure 4A, as well as Figure 4D, where the data from all 6 subjects are pooled, we found that there appeared to be over-representations for horizontal orientations (around 0° orientation) near the horizontal-meridian representation (around 0° polar angle) and vertical orientations (around 90° and −90° orientations) near the vertical-meridian representation (90° polar angle). To confirm this impression, we analyzed the relationship between a voxel's preferred orientation at a given polar angle and the radial orientation expected for the polar angle, and classified this relationship into 4 orientation categories, that is, the preferred orientation either matched the radial orientation (Radial) or differed from the radial orientation by +45° (Radial +45), −45° (Radial −45) or 90° (Tangential). By grouping the data into 3 ranges of polar angles (Fig. 4B for the representative subject and Fig. 4E for all 6 subjects), a 2-way ANOVA revealed a significant main effect (P < 0.0001) of orientation category and a significant interaction (P < 0.0001) between orientation category and the range of polar angles. Subsequent 1-way ANOVA and multiple-comparison tests for each of the 3 ranges of polar angles indicated that there were over-represented voxels preferring horizontal and vertical orientations at horizontal- and vertical-meridian representations (P < 0.0005 and P < 0.005, respectively). Away from the horizontal and vertical meridians, in the range of polar angles between 22.5° and 67.5°, only vertical orientations (Radial +45°, Fig. 4E) were found to be over-represented (P < 0.0001). There was a slight tendency for the radial bias (Radial > Tangential), but this difference was not significant (P = 0.95, Fig. 4E). These observations, thus, suggest that the radial bias indeed exists in V1, but the bias is spatially heterogeneous: It is very strong around horizontal and vertical meridians, but negligible around oblique meridians. These biases, however, were not observed in the strength of BOLD responses (2-way ANOVA, P = 0.82, P = 0.69, P = 0.24 for the orientation category, range of polar angles and their interaction, respectively; Figs 4C,F).
Figure 4.

The radial bias manifested by the relationship between individual voxel orientation preferences and their retinotopic polar angles. (A) Preferred orientations of the voxels from the same subject shown in Figure 3A plotted against their retinotopic polar angles. (B and C) Proportion and percent BOLD responses of the voxels classified into 1 of 4 categories of relationship between a voxel's preferred orientation at a given polar angle and the radial orientation expected for the polar angle, grouped in 3 ranges of polar angles. (D, E, and F) are the same as (A, B, and C), respectively, but are from the data pooled from all 6 subjects. Error bars in E and F indicate 1 SD. There were significant radial orientation biases for the voxels near horizontal- and vertical-meridians (E, see text for statistical details), but these biases were not significant in terms of percent BOLD responses (F).
Due to the limitation in brain coverage in this high-resolution fMRI experiment, we were not able to systematically investigate the dependency of the oblique effect and radial bias on spatial locations. It may be argued that these biases cannot be generalized across the entire visual field because the data were averaged across different visual quadrants; it is likely that some quadrant-dependent discrepancies exist (Van Essen et al. 1984). To examine the possible dependency on the eccentricity (Vandenbussche et al. 1986; Davey and Zanker 1998; Westheimer 2003), we have split the data into 2 halves with roughly the same number of voxels, and performed similar analyses on the 2 datasets. The results suggested that the oblique effect and radial bias were not different across different eccentricities (see Supplementary Figs S3 and S4).
To exclude the possibility that biased orientation representations observed in our study were due to the presence of spatially irregularly distributed macrostructures (Boynton 2005; Swisher et al. 2010), such as large surface veins, which may carry orientation-selective information (Gardner 2010; Kamitani and Sawahata 2010; Kriegeskorte et al. 2010; Op de Beeck 2010; Shmuel et al. 2010), we removed the voxels associated possibly with large surface veins by settings an upper threshold of the estimated hemodynamic response of 3%, which could reasonably well separate the voxels located in the brain tissue and those in the veins in our studies (Cheng et al. 2001; Sun et al. 2007). Across 6 subjects, we found that all the features described above retained for the voxels that were devoid of large surface veins (92.7% of total V1 voxels; see Table 2, third column): There were over-representations for cardinal orientations (1-way ANOVA, P < 0.005) and the voxels preferring cardinal orientations were more than those preferring oblique orientations (multiple-comparison tests, P < 0.05) (Fig. 5A), cardinal orientations were predominantly represented around respective meridian representations (Fig. 5C, see legends for details of statistical tests), and these biases were not reflected in the BOLD response strength (Fig. 5B,D).
Figure 5.

Preference for cardinal orientations and the radial bias are preserved after the removal of the voxels associated with large surface veins. The conventions in (A) and (B) are the same as in Figure 3C and D, respectively, and those in (C and D) are the same as in Figure 4E and F, respectively. In (C), a 2-way analysis of variance (ANOVA) revealed a main effect of orientation category and a significant interaction (P < 0.0001) between orientation category and polar angles. One-way ANOVA and multiple-comparison tests indicated that horizontal and vertical orientations were over-represented in horizontal- and vertical-meridians (P < 0.0005 and P < 0.005, respectively).
Biased Orientation Sensitivity Observed at the Behavioral Level
In an attempt to directly relate our findings regarding biased orientation representations to possible perceptual superiority for these orientations, we conducted a psychophysical experiment measuring the orientation sensitivity at various meridian locations (horizontal, vertical, and 2 principal oblique meridians) and eccentricities (4° and 8°, which fall within the size of the grating used in the fMRI experiment) (Fig. 6A). The 5 observers in this experiment were the subjects who had participated in the fMRI experiment. In contrast to the fMRI measurement, where individual results were obtained from single quadrants, the discrimination thresholds for line orientations were measured throughout the visual quadrants. Consistent with the fMRI results, we found a clear oblique effect behaviorally in our subjects. Across meridian locations and eccentricities, the discrimination thresholds for horizontal and vertical orientations were smaller than those for oblique orientations. To compare with the fMRI results directly, we analyzed the behavioral data in the same way as we did for the fMRI data. Similar to grouping fMRI data into 3 ranges of polar angles (Figs 4B,E, and 5C), we collapsed behavioral data from all measured locations into 3 meridian locations, namely the horizontal meridian, vertical meridian, and other principal oblique meridians and converted the relationship between preferred orientations and polar angles into 4 categories (Radial, Radial +45, Tangential, and Radial−45, see Fig. 6B,C). A 3-way ANOVA revealed significant main effects (P < 0.0001; P < 0.05; P < 0.01) of orientation category, the range of polar angles and the eccentricity, as well as a significant interaction (P < 0.0001) between orientation category and the range of polar angles. Subsequent 2-way ANOVA and multiple-comparison tests for each of the 3 ranges of polar angles indicated that the sensitivities for horizontal orientations were higher than other orientations at the horizontal meridian (P < 0.01) and vertical orientations were higher than other orientations at the vertical meridian (P < 0.05), respectively. In the oblique meridians away from horizontal and vertical meridians, we found that the sensitivities for both horizontal and vertical orientations (Radial −45° and Radial +45°) were significantly higher than those for oblique orientations (Radial and Tangential; P < 0.0001). The sensitivity for Radial orientations at oblique meridians appeared to be slightly higher than that for Tangential orientations, but this difference was statistically insignificant (P = 0.21). These behavioral results, resembling those reported previously (cf. Davey and Zanker 1998, their Fig. 1), thus, are grossly in agreement with the physiological findings revealed in our fMRI experiment, indicating the existence of perceptual superiority for cardinal orientations throughout the visual field, and in particular, near the horizontal and vertical meridians.
Figure 6.

Discrimination thresholds of line orientations measured from 5 of the subjects who participated in the fMRI experiment. (A) Schematic drawing depicting measurement locations along the horizontal, vertical, and other principal oblique meridian locations at 2 eccentricities (4° and 8°). (B and C) Perceptual superiority, expressed by the inverse of the orientation discrimination threshold, was found for horizontal and vertical orientations throughout measurement locations at the eccentricity of either 4° (B) or 8° (C). The high sensitivity was particularly striking for the horizontal orientation near the horizontal meridian and the vertical orientation near the vertical meridian. Error bars in B and C indicate 1 SD.
Discussion
Using high-resolution fMRI with a continuous and periodic stimulation paradigm and a differential analysis method, we reliably revealed orientation-tuning properties of single voxels in the human V1. At the population level, there was an overall trend for the voxels retinotopically located near horizontal- and vertical-meridian representations to respectively prefer horizontal and vertical orientations, thus supporting and refining both the oblique effect and radial bias.
Studying Single Voxels’ Orientation Selectivity Using the Continuous and Periodic Stimulation Paradigm
The continuous and periodic stimulation paradigm offers the advantages of exhaustive coverage of a given stimulus space and effective separation of the stimulus-evoked response from an intrinsic noise (Engel et al. 1994; Kalatsky and Stryker 2003; Wandell et al. 2007; Engel 2011). In our initial explorations, however, we found it difficult to reliably reveal single voxels' orientation preferences by using the original paradigm. As time went by, the BOLD response to the rotating grating either became weaker or lost its phase consistence with the stimulus orientation change. Two physiological mechanisms may account for this gradual deterioration. First, it is well documented that adaptation occurs in neural response (Movshon and Lennie 1979; Hammond et al. 1985) during prolonged stimulation, which is observable a few seconds after the stimulation onset. Secondly, the neurovascular coupling, through which the BOLD signal reflects underlying neural activity, may depend on the length of stimulation. Although it was initially believed that there is a tight coupling during prolonged stimulation (Bandettini et al. 1997), recent results (Mintun et al. 2002; Lin et al. 2009) indicate that the coupling may be time-dependent; the coupling in the latter period (5–6 min after the stimulation onset) may not be as tight as that at the beginning. In the current study, we found a simple and effective solution to these 2 problems. By repeatedly presenting a full range of stimulus orientations and sandwiching these presentations in between extended blank periods, our paradigm takes the advantage of covering a complete stimulus space over a relatively short period (several tens of seconds) and minimizing the problems of adaptation and possible loose neurovascular coupling.
Furthermore, as exemplified in Figure 1A, in comparison to the large elevation in the BOLD response to the grating, the fraction of the response modulated by the change in stimulus orientation was much smaller. The large elevation likely resulted from the mere presence of the grating and the spread of neurovascular responses. We then introduced a pair of orthogonal conditions, in which the identical grating was presented with 2 different phases, one starting its rotation from horizontal orientation and the other from vertical orientation. The 2 orthogonal rotating gratings, when compared directly, thus, created a stimulus condition where the 2 sets of orthogonal orientations changed continuously. Using the differential analysis method that makes a subtraction between the responses to the pair of orthogonal conditions, we removed the large elevation that was common to the 2 conditions and extracted the smaller response component that was modulated by the continuous change in stimulus orientation. Although the differential analysis method has been previously used in animal fMRI studies comparing a pair of orientations (e.g. 0° vs. 90° or 45° vs. 135°) with blocked designs (Duong et al. 2001; Fukuda et al. 2006; Moon et al. 2007; Serences et al. 2009), the present study provided the first evidence of its usefulness, when combined with blank periods, in studying orientation-tuning properties in the human visual cortex.
Oblique Effect and Radial Bias in Orientation Representations in Human V1
Orientation columns, as described for monkeys (Obermayer and Blasdel 1993), are spatially heterogeneous, consisting of several elements, including “linear zones”, where orientation preferences change linearly, roughly 180° every 0.5–1.0 mm, “singularities,” or point-like discontinuities, where orientation preferences change continuously through ±180° along any closed path around them, “fractures,” where orientation preferences change rapidly, and “saddle points,” where orientation preference remains roughly constant. Studies in monkey V1 using optical imaging have revealed close geometric relationships between the organizations of orientation preference and ocular dominance columns (Bartfeld and Grinvald 1992; Obermayer and Blasdel 1993). Because ocular dominance columns in humans are approximately twice as wide as those in monkeys (Horton et al. 1990; Adams et al. 2007), it may be assumed that the size of orientation hyper-columns in humans doubles that estimated for monkeys (0.5–1.0 mm, Blasdel 1992; Obermayer and Blasdel 1993), that is, orientation preferences change roughly 180° for every 1–2 mm in humans. Thus, it is expected that using fMRI with an in-plane resolution of 0.625 × 0.625 mm2, the voxels sampled around linear zones, which amount to ∼48% of area in V1 (Obermayer and Blasdel 1993, their Table 2), are likely to show orientation preferences. On the other hand, it would be difficult to reliably reveal orientation selectivity around other elements (occupying >50% of area in V1), such as singularities, where neurons contained within a single voxel can respond to all orientations. Across 6 subjects, we found that more than a third of voxels (35.3%) had significant ccs, and were therefore considered to be orientation selective. Considering other factors, such as the point spread function of the EPI approach we used (gradient-echo recalled EPI), which is ∼1.7–2 mm (e.g. Shmuel et al. 2007), and intrinsic blurring in EPI images due to T2* blurring, 35.3% was a very reasonable proportion. Because the in-plane resolution used in our study was still 1–2 orders of magnitude lower than that typically used in optical imaging, we refrained from using these voxels to construct spatial maps of orientation selectivity, which would require a extensive interpolation between identified orientation-selective voxels (Yacoub et al. 2008). Instead, we focused our analyses on global distribution features of individual voxel's orientation preferences.
At the population level, we found that there were more voxels showing preferences for cardinal orientations (Fig. 4C). It has been proposed that the behavioral superiority in cardinal orientation sensitivity (the oblique effect) originates from the differences in population size of neurons in the visual cortex (Maffei and Campbell 1970). Indeed, this anisotropy has been demonstrated in different species of animals using single-unit recording (e.g. Mansfield 1974; Li et al. 2003) and optical imaging (e.g. Chapman and Bonhoeffer 1998; Coppola, White et al. 1998; Wang et al. 2003). Our observation is in line with these findings in animals and provides direct evidence for the over-representations of cardinal orientations in the human V1. Alternatively, it has also been suggested that the behavioral superiority is linked to the difference in the amplitudes of neuronal responses tuned to cardinal and oblique orientations (Maffei and Campbell 1970; Mansfield and Ronner 1978; Bonds 1982; Furmanski and Engel 2000). In several fMRI studies, it is reported that the oblique effect is manifested by either stronger (Furmanski and Engel 2000) or reduced (Serences et al. 2009; Mannion et al. 2010; Swisher et al. 2010) responses to cardinal orientations. In our own data, we only observed slightly larger responses to cardinal orientations than oblique orientations (Fig. 3D), but this difference was not significant. It should be emphasized that our results were not affected by the fact that we only analyzed slightly more than a third of the voxels that showed significant orientation preferences. In additional analyses performed using all voxels in V1, we confirmed that enhanced response to particular orientations was not observed in the time course of BOLD response (see Supplementary Fig. S5) or the strength of BOLD response (see Supplementary Fig. S6). The difference between our results and previous findings, thus, may be caused by the differences in the stimulation paradigm, spatial resolution and analysis method. On the other hand, the previous observation that BOLD responses to cardinal orientations are lower than those to other orientations is less straightforward as far as interpretations are concerned. The reduced response to horizontal orientation, for example, was suggested to be a normalization mechanism to account for the fact that more cortical neurons respond to cardinal orientations than oblique orientations (Mannion et al. 2010). Future studies are warranted to elucidate these differences.
In addition to the oblique effect, a radial bias, which describes a biased representation of preferred orientations at particular angular positions, has also been shown in human psychophysics (Rovamo et al. 1982; Davey and Zanker 1998; Westheimer 2003, 2005; Sasaki et al. 2006), animal neurophysiology (Leventhal 1983; Leventhal et al. 1984; Schall et al. 1986; Bauer and Dow 1989; Rodionova et al. 2004; Durand et al. 2007), and both human (Sasaki et al. 2006; Mannion et al. 2009, 2010) and monkey (Sasaki et al. 2006) fMRI studies. One proposed neural mechanism for the radial bias is that the size of sub-regions representing different orientations in orientation columns changes depending on the retinotopic polar angle (Schall et al. 1986). The results obtained in our study, as well as those observed in several animal single-unit recording studies (Leventhal 1983; Leventhal et al. 1984; Schall et al. 1986; Bauer and Dow 1989) and a recent human fMRI study (Freeman et al. 2011), are in line with this hypothesis. By showing that horizontal and vertical orientations are predominantly represented around horizontal- and vertical-meridian representations, we also provided the first evidence that the radial bias was particularly striking for the cardinal orientations, suggesting that these portions of the cortex, at least in V1, are heavily engaged in processing cardinal orientations that are prevalent in the environment (Coppola, Purves et al. 1998; Hansen and Essock 2004; Girshick et al. 2011). Conversely, our results do not support an alternative mechanism, proposed based on the results obtained from fMRI studies (Sasaki et al. 2006; Mannion et al. 2009, 2010), that BOLD responses to the radial orientations are greater than those to the orientations orthogonal to them. Our results are consistent with the findings of Freeman et al. (2011), indicating that the decoding of stimulus orientations using multivariate pattern analysis (MVPA) approaches (e.g. Haynes and Rees 2005; Kamitani and Tong 2005) may in part rely on the radial bias. Moreover, if a spatial heterogeneity in the radial bias indeed exists, as suggested by our results, it may be predicted that the decoding performance using MVPA varies between test orientations and sub-regions of the visual field.
Conclusion
In the present high-resolution fMRI study, we have introduced a stimulation and analysis method for efficiently revealing individual voxel orientation preferences in human V1. The basic idea of the stimulation paradigm and analysis method can be easily extended to study other stimulus tuning properties, such as motion-direction preferences in medial temporal area (Albright et al. 1984; Zimmermann et al. 2011) and face identity and profile preferences in the inferotemporal cortex (Tanaka 2003), as well as certain types of modulatory effects, such as the contextual contrast modulation in early visual cortices (Tajima et al. 2010).
Supplementary Material
Supplementary material can be found at: http://www.cercor.oxfordjournals.org/.
Funding
This work was partially supported by the Japanese Ministry of Education, Culture, Sports, Science and Technology (MEXT) grants 18020033 (to K.C.) and 20020033 (to K.C.), and the Japan Society for the Promotion of Science (JSPS) grant 20300114 (to K.C.). Funding to pay the Open Access publication charges for this article was provided by the RIKEN Brain Science Institute.
Supplementary Material
Notes
We thank Valery Kalatsky for advice in the early stages of this study and J. Anthony Movshon for helpful discussions regarding the visual stimuli. We are indebted to our subjects for their time and efforts in participating in repeated experiments. Conflict of Interest: None declared.
References
- Adams DL, Sincich LC, Horton JC. Complete pattern of ocular dominance columns in human primary visual cortex. J Neurosci. 2007;27:10391–10403. doi: 10.1523/JNEUROSCI.2923-07.2007. [DOI] [PMC free article] [PubMed] [Google Scholar]
- Albright TD, Desimone R, Gross CG. Columnar organization of directionally selective cells in visual area MT of the macaque. J Neurophysiol. 1984;51:16–31. doi: 10.1152/jn.1984.51.1.16. [DOI] [PubMed] [Google Scholar]
- Appelle S. Perception and discrimination as a function of stimulus orientation: the “oblique effect” in man and animals. Psychol Bull. 1972;78:266–278. doi: 10.1037/h0033117. [DOI] [PubMed] [Google Scholar]
- Bandettini PA, Jesmanowicz A, Wong EC, Hyde JS. Processing strategies for time-course data sets in functional MRI of the human brain. Magn Reson Med. 1993;30:161–173. doi: 10.1002/mrm.1910300204. [DOI] [PubMed] [Google Scholar]
- Bandettini PA, Kwong KK, Davis TL, Tootell RB, Wong EC, Fox PT, Belliveau JW, Weisskoff RM, Rosen BR. Characterization of cerebral blood oxygenation and flow changes during prolonged brain activation. Hum Brain Mapp. 1997;5:93–109. [PubMed] [Google Scholar]
- Bartfeld E, Grinvald A. Relationships between orientation-preference pinwheels, cytochrome oxidase blobs, and ocular-dominance columns in primate striate cortex. Proc Natl Acad Sci USA. 1992;89:11905–11909. doi: 10.1073/pnas.89.24.11905. [DOI] [PMC free article] [PubMed] [Google Scholar]
- Bauer R, Dow BM. Complementary global maps for orientation coding in upper and lower layers of the monkey's foveal striate cortex. Exp Brain Res. 1989;76:503–509. doi: 10.1007/BF00248906. [DOI] [PubMed] [Google Scholar]
- Berens P. CircStat: a MATLAB Toolbox for Circular Statistics. J Stat Softw. 2009;31:1–21. [Google Scholar]
- Blasdel GG. Orientation selectivity, preference, and continuity in monkey striate cortex. J Neurosci. 1992;12:3139–3161. doi: 10.1523/JNEUROSCI.12-08-03139.1992. [DOI] [PMC free article] [PubMed] [Google Scholar]
- Blasdel GG, Salama G. Voltage-sensitive dyes reveal a modular organization in monkey striate cortex. Nature. 1986;321:579–585. doi: 10.1038/321579a0. [DOI] [PubMed] [Google Scholar]
- Bonds AB. An “oblique effect” in the visual evoked potential of the cat. Exp Brain Res. 1982;46:151–154. doi: 10.1007/BF00238110. [DOI] [PubMed] [Google Scholar]
- Boynton GM. Imaging orientation selectivity: decoding conscious perception in V1. Nat Neurosci. 2005;8:541–542. doi: 10.1038/nn0505-541. [DOI] [PubMed] [Google Scholar]
- Boynton GM, Engel SA, Glover GH, Heeger DJ. Linear systems analysis of functional magnetic resonance imaging in human V1. J Neurosci. 1996;16:4207–4221. doi: 10.1523/JNEUROSCI.16-13-04207.1996. [DOI] [PMC free article] [PubMed] [Google Scholar]
- Boynton GM, Finney EM. Orientation-specific adaptation in human visual cortex. J Neurosci. 2003;23:8781–8787. doi: 10.1523/JNEUROSCI.23-25-08781.2003. [DOI] [PMC free article] [PubMed] [Google Scholar]
- Brainard DH. The Psychophysics Toolbox. Spat Vis. 1997;10:433–436. [PubMed] [Google Scholar]
- Bruder H, Fischer H, Reinfelder HE, Schmitt F. Image reconstruction for echo planar imaging with nonequidistant k-space sampling. Magn Reson Med. 1992;23:311–323. doi: 10.1002/mrm.1910230211. [DOI] [PubMed] [Google Scholar]
- Chapman B, Bonhoeffer T. Overrepresentation of horizontal and vertical orientation preferences in developing ferret area 17. Proc Natl Acad Sci USA. 1998;95:2609–2614. doi: 10.1073/pnas.95.5.2609. [DOI] [PMC free article] [PubMed] [Google Scholar]
- Cheng K, Waggoner RA, Tanaka K. Human ocular dominance columns as revealed by high-field functional magnetic resonance imaging. Neuron. 2001;32:359–374. doi: 10.1016/s0896-6273(01)00477-9. [DOI] [PubMed] [Google Scholar]
- Coppola DM, Purves HR, McCoy AN, Purves D. The distribution of oriented contours in the real world. Proc Natl Acad Sci USA. 1998;95:4002–4006. doi: 10.1073/pnas.95.7.4002. [DOI] [PMC free article] [PubMed] [Google Scholar]
- Coppola DM, White LE, Fitzpatrick D, Purves D. Unequal representation of cardinal and oblique contours in ferret visual cortex. Proc Natl Acad Sci USA. 1998;95:2621–2623. doi: 10.1073/pnas.95.5.2621. [DOI] [PMC free article] [PubMed] [Google Scholar]
- Dale AM. Optimal experimental design for event-related fMRI. Hum Brain Mapp. 1999;8:109–114. doi: 10.1002/(SICI)1097-0193(1999)8:2/3<109::AID-HBM7>3.0.CO;2-W. [DOI] [PMC free article] [PubMed] [Google Scholar]
- Dale AM, Buckner RL. Selective averaging of rapidly presented individual trials using fMRI. Hum Brain Mapp. 1997;5:329–340. doi: 10.1002/(SICI)1097-0193(1997)5:5<329::AID-HBM1>3.0.CO;2-5. [DOI] [PubMed] [Google Scholar]
- Davey MP, Zanker JM. Detecting the orientation of short lines in the periphery. Aust N Z J Ophthalmol. 1998;26(Suppl. 1):S104–S107. doi: 10.1111/j.1442-9071.1998.tb01354.x. [DOI] [PubMed] [Google Scholar]
- Duong TQ, Kim DS, Ugurbil K, Kim SG. Localized cerebral blood flow response at submillimeter columnar resolution. Proc Natl Acad Sci USA. 2001;98:10904–10909. doi: 10.1073/pnas.191101098. [DOI] [PMC free article] [PubMed] [Google Scholar]
- Durand JB, Celebrini S, Trotter Y. Neural bases of stereopsis across visual field of the alert macaque monkey. Cereb Cortex. 2007;17:1260–1273. doi: 10.1093/cercor/bhl050. [DOI] [PubMed] [Google Scholar]
- Engel SA. The development and use of phase-encoded functional MRI designs. Neuroimage. 2011 doi: 10.1016/j.neuroimage.2011.09.059. doi:10.1016/j.neuroimage.2011.09.059. [DOI] [PubMed] [Google Scholar]
- Engel SA, Glover GH, Wandell BA. Retinotopic organization in human visual cortex and the spatial precision of functional MRI. Cereb Cortex. 1997;7:181–192. doi: 10.1093/cercor/7.2.181. [DOI] [PubMed] [Google Scholar]
- Engel SA, Rumelhart DE, Wandell BA, Lee AT, Glover GH, Chichilnisky EJ, Shadlen MN. fMRI of human visual cortex. Nature. 1994;369:525. doi: 10.1038/369525a0. [DOI] [PubMed] [Google Scholar]
- Fang F, Murray SO, Kersten D, He S. Orientation-tuned FMRI adaptation in human visual cortex. J Neurophysiol. 2005;94:4188–4195. doi: 10.1152/jn.00378.2005. [DOI] [PubMed] [Google Scholar]
- Finney DJ. Probit analysis. Cambridge (UK): University Press; 1971. [Google Scholar]
- Freeman J, Brouwer GJ, Heeger DJ, Merriam EP. Orientation decoding depends on maps, not columns. J Neurosci. 2011;31:4792–4804. doi: 10.1523/JNEUROSCI.5160-10.2011. [DOI] [PMC free article] [PubMed] [Google Scholar]
- Fukuda M, Moon CH, Wang P, Kim SG. Mapping iso-orientation columns by contrast agent-enhanced functional magnetic resonance imaging: reproducibility, specificity, and evaluation by optical imaging of intrinsic signal. J Neurosci. 2006;26:11821–11832. doi: 10.1523/JNEUROSCI.3098-06.2006. [DOI] [PMC free article] [PubMed] [Google Scholar]
- Furmanski CS, Engel SA. An oblique effect in human primary visual cortex. Nat Neurosci. 2000;3:535–536. doi: 10.1038/75702. [DOI] [PubMed] [Google Scholar]
- Gardner JL. Is cortical vasculature functionally organized? Neuroimage. 2010;49:1953–1956. doi: 10.1016/j.neuroimage.2009.07.004. [DOI] [PubMed] [Google Scholar]
- Gardner JL, Sun P, Waggoner RA, Ueno K, Tanaka K, Cheng K. Contrast adaptation and representation in human early visual cortex. Neuron. 2005;47:607–620. doi: 10.1016/j.neuron.2005.07.016. [DOI] [PMC free article] [PubMed] [Google Scholar]
- Girshick AR, Landy MS, Simoncelli EP. Cardinal rules: visual orientation perception reflects knowledge of environmental statistics. Nat Neurosci. 2011;14:926–932. doi: 10.1038/nn.2831. [DOI] [PMC free article] [PubMed] [Google Scholar]
- Grinvald A, Lieke E, Frostig RD, Gilbert CD, Wiesel TN. Functional architecture of cortex revealed by optical imaging of intrinsic signals. Nature. 1986;324:361–364. doi: 10.1038/324361a0. [DOI] [PubMed] [Google Scholar]
- Grinvald A, Slovin H, Vanzetta I. Non-invasive visualization of cortical columns by fMRI. Nat Neurosci. 2000;3:105–107. doi: 10.1038/72045. [DOI] [PubMed] [Google Scholar]
- Hammond P, Mouat GS, Smith AT. Motion after-effects in cat striate cortex elicited by moving gratings. Exp Brain Res. 1985;60:411–416. doi: 10.1007/BF00235938. [DOI] [PubMed] [Google Scholar]
- Hansen BC, Essock EA. A horizontal bias in human visual processing of orientation and its correspondence to the structural components of natural scenes. J Vis. 2004;4:1044–1060. doi: 10.1167/4.12.5. [DOI] [PubMed] [Google Scholar]
- Harrison SA, Tong F. Decoding reveals the contents of visual working memory in early visual areas. Nature. 2009;458:632–635. doi: 10.1038/nature07832. [DOI] [PMC free article] [PubMed] [Google Scholar]
- Haynes JD, Rees G. Predicting the orientation of invisible stimuli from activity in human primary visual cortex. Nat Neurosci. 2005;8:686–691. doi: 10.1038/nn1445. [DOI] [PubMed] [Google Scholar]
- Horton JC, Dagi LR, McCrane EP, de Monasterio FM. Arrangement of ocular dominance columns in human visual cortex. Arch Ophthalmol. 1990;108:1025–1031. doi: 10.1001/archopht.1990.01070090127054. [DOI] [PubMed] [Google Scholar]
- Hu X, Le TH, Parrish T, Erhard P. Retrospective estimation and correction of physiological fluctuation in functional MRI. Magn Reson Med. 1995;34:201–212. doi: 10.1002/mrm.1910340211. [DOI] [PubMed] [Google Scholar]
- Hubel DH, Wiesel TN. Receptive fields and functional architecture of monkey striate cortex. J Physiol. 1968;195:215–243. doi: 10.1113/jphysiol.1968.sp008455. [DOI] [PMC free article] [PubMed] [Google Scholar]
- Hubel DH, Wiesel TN. Receptive fields, binocular interaction and functional architecture in the cat's visual cortex. J Physiol. 1962;160:106–154. doi: 10.1113/jphysiol.1962.sp006837. [DOI] [PMC free article] [PubMed] [Google Scholar]
- Kalatsky VA, Stryker MP. New paradigm for optical imaging: temporally encoded maps of intrinsic signal. Neuron. 2003;38:529–545. doi: 10.1016/s0896-6273(03)00286-1. [DOI] [PubMed] [Google Scholar]
- Kamitani Y, Sawahata Y. Spatial smoothing hurts localization but not information: Pitfalls for brain mappers. Neuroimage. 2010;49:1949–1952. doi: 10.1016/j.neuroimage.2009.06.040. [DOI] [PubMed] [Google Scholar]
- Kamitani Y, Tong F. Decoding the visual and subjective contents of the human brain. Nat Neurosci. 2005;8:679–685. doi: 10.1038/nn1444. [DOI] [PMC free article] [PubMed] [Google Scholar]
- Kim DS, Duong TQ, Kim SG. High-resolution mapping of iso-orientation columns by fMRI. Nat Neurosci. 2000;3:164–169. doi: 10.1038/72109. [DOI] [PubMed] [Google Scholar]
- Kim SG, Hu X, Adriany G, Ugurbil K. Fast interleaved echo-planar imaging with navigator: high resolution anatomic and functional images at 5 Tesla. Magn Reson Med. 1996;35:895–902. doi: 10.1002/mrm.1910350618. [DOI] [PubMed] [Google Scholar]
- Kriegeskorte N, Cusack R, Bandettini P. How does an fMRI voxel sample the neuronal activity pattern: compact-kernel or complex spatiotemporal filter? Neuroimage. 2010;49:1965–1976. doi: 10.1016/j.neuroimage.2009.09.059. [DOI] [PMC free article] [PubMed] [Google Scholar]
- Leventhal AG. Relationship between preferred orientation and receptive field position of neurons in cat striate cortex. J Comp Neurol. 1983;220:476–483. doi: 10.1002/cne.902200409. [DOI] [PubMed] [Google Scholar]
- Leventhal AG, Schall JD, Wallace W. Relationship between preferred orientation and receptive field position of neurons in extrastriate cortex (area 19) in the cat. J Comp Neurol. 1984;222:445–451. doi: 10.1002/cne.902220309. [DOI] [PubMed] [Google Scholar]
- Li B, Peterson MR, Freeman RD. Oblique effect: a neural basis in the visual cortex. J Neurophysiol. 2003;90:204–217. doi: 10.1152/jn.00954.2002. [DOI] [PubMed] [Google Scholar]
- Lin A, Fox P, Yang Y, Lu H, Tan L, Gao J. Time-dependent correlation of cerebral blood flow with oxygen metabolism in activated human visual cortex as measured by fMRI. Neuroimage. 2009;44:16–22. doi: 10.1016/j.neuroimage.2008.08.029. [DOI] [PubMed] [Google Scholar]
- Liu JV, Ashida H, Smith AT, Wandell BA. Assessment of stimulus-induced changes in human V1 visual field maps. J Neurophysiol. 2006;96:3398–3408. doi: 10.1152/jn.00556.2006. [DOI] [PubMed] [Google Scholar]
- Maas LC, Frederick BD, Renshaw PF. Decoupled automated rotational and translational registration for functional MRI time series data: the DART registration algorithm. Magn Reson Med. 1997;37:131–139. doi: 10.1002/mrm.1910370119. [DOI] [PubMed] [Google Scholar]
- Maffei L, Campbell FW. Neurophysiological localization of the vertical and horizontal visual coordinates in man. Science. 1970;167:386–387. doi: 10.1126/science.167.3917.386. [DOI] [PubMed] [Google Scholar]
- Mannion DJ, McDonald JS, Clifford CW. Discrimination of the local orientation structure of spiral Glass patterns early in human visual cortex. Neuroimage. 2009;46:511–515. doi: 10.1016/j.neuroimage.2009.01.052. [DOI] [PubMed] [Google Scholar]
- Mannion DJ, McDonald JS, Clifford CW. Orientation anisotropies in human visual cortex. J Neurophysiol. 2010;103:3465–3471. doi: 10.1152/jn.00190.2010. [DOI] [PubMed] [Google Scholar]
- Mansfield RJ. Neural basis of orientation perception in primate vision. Science. 1974;186:1133–1135. doi: 10.1126/science.186.4169.1133. [DOI] [PubMed] [Google Scholar]
- Mansfield RJ, Ronner SF. Orientation anistropy in monkey visual cortex. Brain Res. 1978;149:229–234. doi: 10.1016/0006-8993(78)90603-0. [DOI] [PubMed] [Google Scholar]
- Mintun MA, Vlassenko AG, Shulman GL, Snyder AZ. Time-related increase of oxygen utilization in continuously activated human visual cortex. Neuroimage. 2002;16:531–537. doi: 10.1006/nimg.2002.1114. [DOI] [PubMed] [Google Scholar]
- Moon CH, Fukuda M, Park SH, Kim SG. Neural interpretation of blood oxygenation level-dependent fMRI maps at submillimeter columnar resolution. J Neurosci. 2007;27:6892–6902. doi: 10.1523/JNEUROSCI.0445-07.2007. [DOI] [PMC free article] [PubMed] [Google Scholar]
- Movshon JA, Lennie P. Pattern-selective adaptation in visual cortical neurones. Nature. 1979;278:850–852. doi: 10.1038/278850a0. [DOI] [PubMed] [Google Scholar]
- Obermayer K, Blasdel GG. Geometry of orientation and ocular dominance columns in monkey striate cortex. J Neurosci. 1993;13:4114–4129. doi: 10.1523/JNEUROSCI.13-10-04114.1993. [DOI] [PMC free article] [PubMed] [Google Scholar]
- Op de Beeck HP. Against hyperacuity in brain reading: spatial smoothing does not hurt multivariate fMRI analyses? Neuroimage. 2010;49:1943–1948. doi: 10.1016/j.neuroimage.2009.02.047. [DOI] [PubMed] [Google Scholar]
- Pelli DG. The VideoToolbox software for visual psychophysics: transforming numbers into movies. Spat Vis. 1997;10:437–442. [PubMed] [Google Scholar]
- Rodionova EI, Revishchin AV, Pigarev IN. Distant cortical locations of the upper and lower quadrants of the visual field represented by neurons with elongated and radially oriented receptive fields. Exp Brain Res. 2004;158:373–377. doi: 10.1007/s00221-004-1967-1. [DOI] [PubMed] [Google Scholar]
- Rovamo J, Virsu V, Laurinen P, Hyvarinen L. Resolution of gratings oriented along and across meridians in peripheral vision. Invest Ophthalmol Vis Sci. 1982;23:666–670. [PubMed] [Google Scholar]
- Sasaki Y, Rajimehr R, Kim B, Ekstrom L, Vanduffel W, Tootell R. The radial bias: a different slant on visual orientation sensitivity in human and nonhuman primates. Neuron. 2006;51:661–670. doi: 10.1016/j.neuron.2006.07.021. [DOI] [PubMed] [Google Scholar]
- Schall JD, Vitek DJ, Leventhal AG. Retinal constraints on orientation specificity in cat visual cortex. J Neurosci. 1986;6:823–836. doi: 10.1523/JNEUROSCI.06-03-00823.1986. [DOI] [PMC free article] [PubMed] [Google Scholar]
- Serences J, Saproo S, Scolari M, Ho T, Muftuler L. Estimating the influence of attention on population codes in human visual cortex using voxel-based tuning functions. Neuroimage. 2009;44:223–231. doi: 10.1016/j.neuroimage.2008.07.043. [DOI] [PubMed] [Google Scholar]
- Shmuel A, Chaimow D, Raddatz G, Ugurbil K, Yacoub E. Mechanisms underlying decoding at 7 T: ocular dominance columns, broad structures, and macroscopic blood vessels in V1 convey information on the stimulated eye. Neuroimage. 2010;49:1957–1964. doi: 10.1016/j.neuroimage.2009.08.040. [DOI] [PMC free article] [PubMed] [Google Scholar]
- Shmuel A, Yacoub E, Chaimow D, Logothetis NK, Ugurbil K. Spatio-temporal point-spread function of fMRI signal in human gray matter at 7 Tesla. Neuroimage. 2007;35:539–552. doi: 10.1016/j.neuroimage.2006.12.030. [DOI] [PMC free article] [PubMed] [Google Scholar]
- Sun P, Ueno K, Waggoner RA, Gardner JL, Tanaka K, Cheng K. A temporal frequency-dependent functional architecture in human V1 revealed by high-resolution fMRI. Nat Neurosci. 2007;10:1404–1406. doi: 10.1038/nn1983. [DOI] [PubMed] [Google Scholar]
- Swisher JD, Gatenby JC, Gore JC, Wolfe BA, Moon CH, Kim SG, Tong F. Multiscale pattern analysis of orientation-selective activity in the primary visual cortex. J Neurosci. 2010;30:325–330. doi: 10.1523/JNEUROSCI.4811-09.2010. [DOI] [PMC free article] [PubMed] [Google Scholar]
- Tajima S, Watanabe M, Imai C, Ueno K, Asamizuya T, Sun P, Tanaka K, Cheng K. Opposing effects of contextual surround in human early visual cortex revealed by functional magnetic resonance imaging with continuously modulated visual stimuli. J Neurosci. 2010;30:3264–3270. doi: 10.1523/JNEUROSCI.4473-09.2010. [DOI] [PMC free article] [PubMed] [Google Scholar]
- Tanaka K. Columns for complex visual object features in the inferotemporal cortex: clustering of cells with similar but slightly different stimulus selectivities. Cereb Cortex. 2003;13:90–99. doi: 10.1093/cercor/13.1.90. [DOI] [PubMed] [Google Scholar]
- Tootell RB, Hadjikhani N, Hall EK, Marrett S, Vanduffel W, Vaughan JT, Dale AM. The retinotopy of visual spatial attention. Neuron. 1998;21:1409–1422. doi: 10.1016/s0896-6273(00)80659-5. [DOI] [PubMed] [Google Scholar]
- Tootell RB, Hadjikhani NK, Vanduffel W, Liu AK, Mendola JD, Sereno MI, Dale AM. Functional analysis of primary visual cortex (V1) in humans. Proc Natl Acad Sci USA. 1998;95:811–817. doi: 10.1073/pnas.95.3.811. [DOI] [PMC free article] [PubMed] [Google Scholar]
- Vandenbussche E, Vogels R, Orban GA. Human orientation discrimination: changes with eccentricity in normal and amblyopic vision. Invest Ophthalmol Vis Sci. 1986;27:237–245. [PubMed] [Google Scholar]
- Van Essen DC, Newsome WT, Maunsell JH. The visual field representation in striate cortex of the macaque monkey: asymmetries, anisotropies, and individual variability. Vision Res. 1984;24:429–448. doi: 10.1016/0042-6989(84)90041-5. [DOI] [PubMed] [Google Scholar]
- Wandell BA, Dumoulin SO, Brewer AA. Visual field maps in human cortex. Neuron. 2007;56:366–383. doi: 10.1016/j.neuron.2007.10.012. [DOI] [PubMed] [Google Scholar]
- Wang G, Ding S, Yunokuchi K. Difference in the representation of cardinal and oblique contours in cat visual cortex. Neurosci Lett. 2003;338:77–81. doi: 10.1016/s0304-3940(02)01355-1. [DOI] [PubMed] [Google Scholar]
- Weigelt S, Limbach K, Singer W, Kohler A. Orientation-selective functional magnetic resonance imaging adaptation in primary visual cortex revisited. Human Brain Mapp. 2011;33:707–714. doi: 10.1002/hbm.21244. [DOI] [PMC free article] [PubMed] [Google Scholar]
- Westheimer G. Anisotropies in peripheral vernier acuity. Spat Vis. 2005;18:159–167. doi: 10.1163/1568568053320611. [DOI] [PubMed] [Google Scholar]
- Westheimer G. The distribution of preferred orientations in the peripheral visual field. Vis Res. 2003;43:53–57. doi: 10.1016/s0042-6989(02)00398-x. [DOI] [PubMed] [Google Scholar]
- Yacoub E, Harel N, Ugurbil K. High-field fMRI unveils orientation columns in humans. Proc Natl Acad Sci. 2008;105:10607–10612. doi: 10.1073/pnas.0804110105. [DOI] [PMC free article] [PubMed] [Google Scholar]
- Zimmermann J, Goebel R, De Martino F, van de Moortele PF, Feinberg D, Adriany G, Chaimow D, Shmuel A, Ugurbil K, Yacoub E. Mapping the organization of axis of motion selective features in human area MT using high-field fMRI. PLoS One. 2011;6:e28716. doi: 10.1371/journal.pone.0028716. [DOI] [PMC free article] [PubMed] [Google Scholar]
Associated Data
This section collects any data citations, data availability statements, or supplementary materials included in this article.