

Abstract
Natural selection is a significant force that shapes the architecture of the human genome and introduces diversity across global populations. The question of whether advantageous mutations have arisen in the human genome as a result of single or multiple mutation events remains unanswered except for the fact that there exist a handful of genes such as those that confer lactase persistence, affect skin pigmentation, or cause sickle cell anemia. We have developed a long-range-haplotype method for identifying genomic signatures of positive selection to complement existing methods, such as the integrated haplotype score (iHS) or cross-population extended haplotype homozygosity (XP-EHH), for locating signals across the entire allele frequency spectrum. Our method also locates the founder haplotypes that carry the advantageous variants and infers their corresponding population frequencies. This presents an opportunity to systematically interrogate the whole human genome whether a selection signal shared across different populations is the consequence of a single mutation process followed subsequently by gene flow between populations or of convergent evolution due to the occurrence of multiple independent mutation events either at the same variant or within the same gene. The application of our method to data from 14 populations across the world revealed that positive-selection events tend to cluster in populations of the same ancestry. Comparing the founder haplotypes for events that are present across different populations revealed that convergent evolution is a rare occurrence and that the majority of shared signals stem from the same evolutionary event.
Introduction
The process of positive natural selection leaves informative imprints in the human genome. Bioinformatics strategies designed to discover evidence of local adaption predominantly focus on identifying the following two genomic features that accompany the introduction of an evolutionarily advantageous allele: (1) the presence of a long-range haplotype (LRH) on which the selected allele resides, given that this variant increases in frequency very rapidly and brings along neighboring variants (on the same haplotype) that recombination does not have sufficient time to break down; (2) stretches in the human genome that are highly differentiated between populations as a result of positive selection’s exerting a stronger force on the genetic backgrounds associated with the beneficial alleles to dominate above neutrally evolving regions. Metrics relying on detecting these two genomic features have jointly discovered that hundreds of regions in the human genome exhibit evidence of positive selection, and most of these are attributed to adaptations due to changes in environmental or dietary exposures or to the emergence of infectious diseases.1,2 A recent composite method combines the evidence across several metrics and exhibits a remarkable ability to localize the functional variants responsible for these selective sweeps.3
Except in a handful of genes, it remains unanswered whether advantageous alleles that are shared across several populations (1) have arisen in the human genome as a result of a single mutation event subsequently followed by gene flow between these populations or (2) present evidence of convergent evolution where multiple independent mutation events, either at the same location or at different locations in the same gene, have occurred in these populations as a result of exposure to the same adaptive pressure. For example, the sickle cell allele that confers a 10-fold protection against malaria is a classic case of convergent evolution of the same variant, given that malaria endemicity in different parts of Africa exerted the same evolutionary force at the adenine allele on the genomic variant rs334 and caused it to arise independently in these populations.4 Another well-known example of convergent evolution is the lactase-encoding gene that confers lactase persistence in northern European populations5 and certain nomadic African tribes,6 in which different functional variants have arisen in the same gene to enable lactase persistence in the different populations.
Every mutation event that introduces a new allele happens against a specific haplotype background, which we define as the founder haplotype. For an allele that confers a survival or reproductive advantage, the haplotype on which the beneficial allele resides tends to be significantly longer than the other haplotypes at the same frequency in the population when adjusted for the recombination background. LRH methods, such as the integrated haplotype score (iHS) and cross-population extended haplotype homozygosity (XP-EHH), probabilistically model the likelihood that the decay of this haplotype is due to recombination but do not formally identify the actual haplotype that carries the advantageous allele.
There are at least two sources of information that can be relied on to locate these selection signals: (1) given a specific frequency, we can search for the longest haplotype around a focal site in the genome, and by searching across a range of frequencies in a monotonically decreasing fashion, we expect the haplotype length to increase significantly when the haplotype frequency is first below the frequency of the selected allele in the data—given that the identified haplotype will switch from that carrying the wild-type allele to the haplotype carrying the beneficial allele; and (2) at a frequency that is lower than the population frequency of the selected allele, the longest haplotype around a positively selected site is likely to be significantly longer than haplotypes around neutrally evolving sites in the rest of the human genome. The first source of information is local and compares the length of the longest haplotypes found at different frequencies around the same focal site, whereas the second source of information is global and is obtained by a comparison of the length of the longest haplotype at a particular frequency to all other haplotypes across the genome at the same frequency.
Here, we developed haploPS, an approach that leverages on these two sources of information to discover genomic regions that are positively selected and to locate the haplotype patterns on which the selected alleles reside. The construction of the method naturally allows the frequency of a selected allele to be estimated, as well as identifies the haplotype form that is carrying the selected allele (we refer to this haplotype as the founder haplotype here). The power of haploPS was compared against those of iHS and XP-EHH in a series of simulations designed to mimic the genetic architecture present in Africa. We subsequently ran haploPS across 14 populations from Phase III of the International HapMap Project7 and the Singapore Genome Variation Project (SGVP)8 to discover genomic signatures of positive selection in these worldwide populations. The method also presents an opportunity to investigate across the genome whether a selection signal that is present in multiple populations is the result of a single mutation event or the consequence of multiple mutation events located within the same locus.
Material and Methods
Construction of HaploPS
The development of haploPS follows that of HapFinder, introduced by Ong and colleagues.9 Given phased haplotype data for multiple samples of a particular population, such as those from the International HapMap Project and the SGVP, one can query what constitutes the longest haplotype pattern around a focal SNP at a specific frequency, hereafter defined as the core frequency. If the core frequency is higher than the major allele frequency at the focal SNP, then there will not be any haplotype pattern that satisfies this definition. However, if the core frequency is lower than the major allele frequency at the focal SNP, then the alleles of neighboring SNPs can be appended to the haplotype carrying either allele until the frequency of this haplotype form is first below the core frequency.
Mathematically, in searching for the longest haplotype given a core haplotype frequency f, we first determine out of a total of N chromosomes the required critical number of chromosomes c to attain a core haplotype frequency of f, such that c = floor[f × N]. When the major allele frequency of the focal SNP is less than f, there is no haplotype form that is generated and the algorithm moves on to the next successive SNP. When the number of chromosomes carrying the major allele is at least c, the next ten SNPs immediately to the right of the focal SNP are included, the most common haplotype form is identified, and the number of chromosomes carrying this haplotype form is calculated. If this number remains higher than c, the next ten SNPs immediately to the right of the last SNP are appended. This process continues until the frequency of the most common haplotype first falls below f or effectively until the number of chromosomes carrying the most common haplotype form first falls below c. When this happens, the set of ten SNPs that were most recently appended is removed, the ten SNPs that are immediately to the left of the focal SNP are now appended, and the frequency of the most common haplotype form is evaluated. This process of adding ten SNPs to the left continues until the frequency of the most common haplotype first falls below f, at which point the set of ten SNPs most recently appended is removed. One SNP at a time is then added to the right of this haplotype form until the frequency of the most common haplotype first falls below f, when the most recently appended SNP is then removed. The final step is to add one SNP at a time to the left of the haplotype form until the frequency of the most common haplotype first falls below f, when the most recently appended SNP is then removed. This procedure thus identifies the longest haplotype form around a focal SNP with a population frequency no smaller than f (Figure 1). When f is higher than the frequency of the minor allele but below (or exactly at) the frequency of the major allele, the longest haplotype must be carrying the major allele. However, when f is less than or equal to the frequency of the minor allele, the procedure will search for the longest haplotype that might carry either the minor or the major allele.
Figure 1.
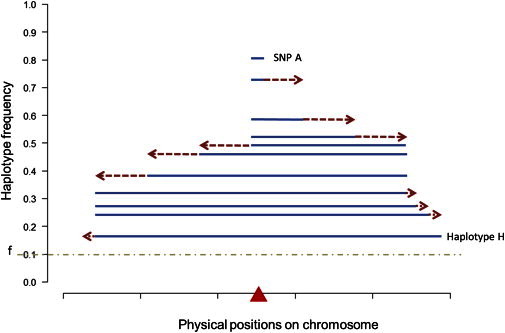
Illustration of the HaploPS Method
Steps that haploPS takes to search for the longest haplotype around a focal SNP (red triangle) at a given core frequency f, which is set to 0.1 in this illustration. Suppose the major allele frequency at the focal SNP is 82%; then, haploPS first extends to the right ten SNPs a time. The new haplotype consists of 11 SNPs, and the most common haplotype form has a frequency of 73%. Because this is higher than 10%, the haplotype is continued to be extended to the right ten SNPs each time until it spans 41 SNPs, when the frequency of the haplotype first falls below 10%, and the last set of ten SNPs is removed; this leaves 31 SNPs. The haplotype is next extended to the left by ten SNPs until it contains 71 SNPs and the frequency first falls below 10%, at which point the last set of ten SNPs appended to the haplotype is removed. Subsequently, SNPs are added to the haplotype one at a time to the right until the haplotype frequency is lower than 10%, when the last SNP is removed. Finally SNPs are added to the left one at a time until the frequency is lower than 10%, and the last appended SNP is removed. This then yields the longest haplotype H. Although this figure illustrates the situation when the major allele is positively selected, haploPS actually performs the search on both alleles of the focal SNP. When f is above the minor allele frequency at the focal SNP, the longest haplotype must be carrying the major allele (unless f is above the major allele frequency); however when f falls below the minor allele frequency, the algorithm searches for the longest haplotype that might carry either the minor or the major allele.
For a genomic site that is under positive selection, the haplotype on which the advantageous allele resides tends to be significantly longer than other haplotypes at the same frequency in the population when adjusted for the recombination background. As such, haplotypes that are uncharacteristically long for a given core haplotype frequency, relative to what can be seen across the whole genome, are indicative of the presence of a positive-selection signature. However, long haplotypes tend to occur in regions with low recombination, and these can be confused with genuine genomic signals of positive selection. To account for the confounding effects of low recombination, haploPS thus uses the genetic distance to quantify the length of the haplotype rather than the physical distance. Another potential source of bias is the number of SNPs that form the longest haplotype. A long haplotype carrying significantly fewer SNPs is less informative and indicative than a long haplotype that spans considerably more SNPs. Given a core haplotype frequency, haploPS thus searches for long stretches of haplotypes that span significant genetic distances and across large numbers of SNPs.
Each haplotype identified by haploPS at a particular core frequency is compared against the rest of the haplotypes generated by haploPS at the same frequency in terms of both the genetic distance spanned and the number of SNPs carried by the haplotype. We calculate a haploPS score metric that is defined as
The numerators denote (1) the number of regions that carry more SNPs than that observed in the target haplotype and (2) the number of regions spanning a larger genetic distance than that observed in the target haplotype. The denominator represents the total number of regions identified across the genome at that particular core frequency. To account for the number of regions surveyed, we calculate an adjusted score that is defined as Shap × total number of regions, and haploPS considers a region to be positively selected if the adjusted score is less than 0.05 (Table 1).
Table 1.
The Criteria for Identifying Positively Selected Regions by HaploPS, iHS, and XP-EHH in the Simulations and in the Analyses of the HapMap2, HapMap3, and SGVP Populations
| Method | Simulations (Neutral) | Simulations (Selection) | HapMap2 | HapMap3 |
|---|---|---|---|---|
| HaploPS | the distribution of haploPS scores generated from 2,000 iterations at each core frequency is used for deriving the corresponding haploPS score threshold S∗ at the bottom 1% of the distribution | for the respective core frequency, a simulated region with haploPS score < S∗ is considered to be positively selected | adjusted haploPS score for each core frequency < 0.05 | adjusted haploPS score for each core frequency < 0.05 |
| iHS | the distribution of |standardized iHS| generated from 2,000 iterations is used for deriving the threshold at the top 1% of the distribution T∗ | when the |standardized iHS| in each simulated region is larger than T∗, the region is considered to be positively selected | extracted from Frazer et al.7 and Sabeti et al.10 | not performed |
| XP-EHH | the distribution of standardized XP-EHH scores generated from 2,000 iterations is used for deriving the threshold at the top 1% of the distribution U∗ | when the standardized XP-EHH in each simulated region is larger than U∗, the region is considered to be positively selected | extracted from Frazer et al.7 and Sabeti et al.10 | not performed |
The analysis of haploPS is performed at core frequencies ranging from 0.05 to 0.95 in step sizes of 0.05. At each frequency, a set of positive-selection signals will be identified. By combining signals observed across a range of frequencies, we observe that signals occur around the same position across multiple frequencies once the core frequency decreases below the frequency of the selected allele. By stacking the significant haplotypes around the same core SNP across different frequencies, we expect the functional allele to reside on all these stacked haplotypes. Thus, we can obtain an estimate for the population frequency of the selected allele as the highest core frequency with a significant haplotype at the locus. HaploPS thus uses the significant haplotype found at the highest core frequency of each stack to represent the selection signal at that locus.
Long haplotypes carrying the advantageous allele are observed at or below the derived allele frequency. Haplotypes carrying this advantageous allele would not be present above this frequency. Therefore, an estimate of the frequency of the selected allele can be obtained as the frequency that coincides with a sudden increase in the haplotype length as the core frequency is decreased. Also, the haplotype form on which the unknown functional allele resides can also be identified by haploPS. As a result of imperfect SNP coverage from HapMap and SGVP, the functional variant might not necessarily be present in these databases. However, haploPS does not require the functional variant to be present in order to locate the selection signal, given that it leverages on the haplotype pattern that carries the functional allele.
A C++ executable version of the haploPS software is available for public download online (see Web Resources).
Running iHS and XP-EHH
In order to calculate the iHS, we need to measure the extended haplotype homozygosity (EHH), which is defined as the probability of identity by descent for two randomly chosen haplotypes carrying a core haplotype of interest in an interval around a prespecified focal SNP.10 The EHH is measured at each SNP, and the iHS integrates the EHH score up to the SNP exhibiting an EHH score of 0.05 unless there exists a gap of more than 200 kb between adjacent SNPs. A scaling factor described by Voight and colleagues was implemented to correct for artificial inflation of the iHS statistic in the presence of gaps between 20 and 200 kb between adjacent SNPs.2 No iHS is assigned for a SNP if any of the following conditions is true: (1) minor allele frequency < 5%; (2) the derived allele is not known or does not agree with either of the two possible alleles that have been observed; or (3) the EHH does not decrease below 0.05 after an interval of 2.5 Mb. We used the definitions of the derived alleles from Haplotter. The population-averaged recombination rates were used for calculating the iHS statistic, and these rates refer to the average of the HapMap Phase II population-specific recombination rates. The iHS statistics that were calculated were subsequently normalized within 20 bins according to the derived allele frequency; each bin spanned 5%. Candidate regions of positive selection were defined as genomic regions containing an uncharacteristic clustering of SNPs with high iHS statistics. This was quantified as the proportion of SNPs with |iHS| > 2.0 in 100 kb nonoverlapping windows. Candidate regions of positive selection were identified as windows with the top 1% density of high iHS SNPs, except that we excluded windows with fewer than ten SNPs.
The XP-EHH metric contrasts the evidence of positive selection between two populations at a focal SNP for a predefined direction. At each focal SNP and direction of analysis, the XP-EHH metric considers SNPs that are present in both populations and located within 1 Mb of the focal SNP, and it specifically requires at least one SNP in this region to possess an EHH between 0.03 and 0.05. When there is at least one SNP that satisfies this criterion, the SNP with the EHH score that is nearest to 0.04 is identified, and within each population, the integral of the EHH across all the SNPs between the focal SNP and the identified SNP is calculated. The XP-EHH metric is effectively the logarithm of the ratio of this integral value in the two populations, and the genome-wide distribution of the XP-EHH metric is standardized to yield a zero mean and unit variance. Genomic regions that carry an unusually high density of SNPs with extremely positive values of the standardized scores suggest that a selection event is likely to have occurred in one population, but not the other, whereas clustering of extremely negative values suggest a selection event in the latter population, but not the former. To locate the clustering of SNPs, we divided each chromosome into nonoverlapping windows of 100 kb, and we calculated the proportion of SNPs with XP-EHH > 2.5. Candidate regions of positive selection were identified as windows with the top 1% density of high XP-EHH SNPs, except for windows with fewer than ten SNPs. We specifically focused on only the extremely positive values in our analyses of the HapMap Phase II populations, given that we used YRI (Yoruba in Ibadan, Nigeria) as a reference population when searching for positive-selection signals in CEU (Utah residents with ancestry from northern and western Europe from the CEPH collection) and JPT+CHB (Japanese in Tokyo, Japan, and Han Chinese in Beijing, China) and used CEU as the reference population when searching for positive-selection signals in YRI.
In performing the iHS and XP-EHH analyses, we utilized the C++ software that is publicly available (see Web Resources).
Simulation Framework for Power Calculations
In order to compare the performance of haploPS to those of iHS and XP-EHH, we performed a series of simulations to first generate distributions of haploPS, iHS, and XP-EHH signals under a setting of neutral selection before simulating SNPs under positive-selection pressure. The neutral simulations were performed with simulation package cosi11 under the assumption of a neutral demographic model characterized by two bottlenecks experienced by non-African populations. We simulated 2,000 iterations meant to mimic the data from each of CEU, JPT+CHB, and YRI.
Selection was modeled with the program SelSim,12 which assumes a constant population size, and we modeled the YRI population in the same fashion as did Voight and colleagues.2 An advantageous mutation was introduced at a specific location with constant selection pressure. Samples of size 120 were drawn when the derived allele reached a predefined allele frequency. The advantageous allele frequencies were fixed at increments of 10% from 10% to 100%. The effective population size, Ne, was set to 17,469, and the selection coefficient was 0.01. The mutation rate was set to 3 × 10⁻⁸ per base per generation, and the recombination rate was generated by cosi with a baseline rate of 1 cM/Mb. SNPs were thinned randomly to match the HapMap SNP density.
A total of 2,000 regions, each spanning 100 kb, were simulated for YRI with SelSim, and the simulated data were analyzed with haploPS, iHS, and XP-EHH (the iHS and XP-EHH metrics used the |standardized iHS| and the standardized XP-EHH score, respectively). The power for iHS (and XP-EHH) is calculated as the fraction of the 2,000 iterations in which the iHS (and XP-EHH) statistic for each iteration exceeds the 99th percentile of the distribution obtained from the 2,000 iterations under the assumption of the neutral model without selection (Table 1). For haploPS, the power is quantified as the fraction of 2,000 iterations where the haploPS score obtained for each iteration is less than the first percentile of the distribution of haploPS scores obtained from the 2,000 iterations under the null model (Table 1). In calculating the haploPS score in each iteration, the identified haplotype is first compared against the 2,000 haplotypes obtained from the null simulations for the calculation of the respective empirical p values for the number of SNPs and genetic distance, and the haploPS score is obtained as described previously as the product of the two empirical p values.
Haplotype Entropy and Genome-wide Distribution
In order to assess the diversity and specificity of haplotypes between populations, we implemented a metric that effectively assessed the entropy of the conditional probabilities of each haplotype across a set of populations. A haplotype-entropy score was calculated for nonoverlapping windows of 100 kb in the human genome. In the situation in which there are K populations, we first identify and collate the set of unique haplotypes that are present in any population with a frequency of at least 2% within each 100 kb region; this set is defined as {h1, h2, …, hL}. The frequency of each of these haplotypes is tabulated in each of the K populations for obtaining population-specific frequencies fij for haplotype hi in the jth population. We quantify the conditional probability of haplotype hi in population j as Fij = fij / (Σjfij) and subsequently calculate the relative mutual information (RMI) for haplotype hi as RMI(hi) = 1 + Σj(Fij log Fij) / log(K). We can quantify the haplotype entropy for each genomic window as the overall frequency-weighted sum of the individual RMI estimates, or Σi[(Σifi⋅) RMI(hi)] / (Σifi⋅), such that fi⋅ represents the combined frequency of haplotype hi when the chromosomes from all K populations are considered. The haplotype entropy provides a measure of the degree of population specificity of the observed haplotypes across all the populations and yields a score from 0 to 1. Larger values of the haplotype entropy indicate that there are specific haplotypes that are at a relatively high frequency in some populations but that are either absent or at low frequencies in the remaining populations, and they are thus reflective of a greater degree of haplotype diversity across the populations. In the context of the positive-selection survey, if there is a positively selected allele that exists at a considerably high frequency in some populations as a result of the selection sweep but that is absolutely absent from the other populations, we expect that the haplotype form carrying the advantageous variant will similarly be at a high frequency, and this haplotype form is likely to be absent entirely from the populations that are not carrying the selected variant.
For a specific combination of K populations, we can obtain the genome-wide distribution of the haplotype entropy by considering nonoverlapping windows of 100 kb across every autosomal chromosome. This allows an empirical p value (pent) to be calculated for a specific window, such as one that overlaps with a putative signal of positive selection, and the empirical p value can be quantified as the proportion of windows (across the genome) that exhibit a haplotype-entropy score less than or equal to the one observed for the specific window. Genomic regions exhibiting low empirical p values thus correspond to the regions where there is considerably less haplotype diversity across the populations.
Quantifying Similarity of Selected Haplotypes
We aimed to investigate whether a selection signal present in multiple populations is likely to stem from the same mutation event. Under the assumption that the beneficial allele will reside on a founder haplotype that is significantly longer than the background haplotypes of the same frequency, we can thus compare the degree of similarity in the haplotype forms that emerged from the haploPS analyses in the different populations. If the same mutation event is responsible for the selection signal observed across multiple populations, we expect a significant degree of similarity in the selected haplotype forms of these populations. We thus introduce a similarity index that quantifies this degree of haplotype similarity across multiple populations.
For a region that is found to be positively selected in K populations by haploPS, we extract these populations’ K selected haplotype forms found at the maximum frequencies according to the threshold of discovery and identify the common set of L SNPs that are present in all K haplotypes. We calculate the K × K similarity matrix M, in which the leading diagonals are all ones and the (i, j)th entry of the matrix corresponds to the scaled Manhattan distance between the selected haplotypes for populations i and j; this matrix is defined as M(i, j) = 1 − , where l represents the number of sites (out of L) in which the two haplotypes carry different alleles.
An eigen decomposition is performed on matrix M, and the haplotype similarity index (HSI) is defined as the amount of variance explained by the first principal component, or , where λ1 is the leading eigenvalue. Intuitively, if the haplotypes are all extremely similar, the leading eigenvalue will explain a significant portion of the matrix variance given that all the elements in M will be close to 1. However, if there is at least one population where the selected haplotype form is different from the rest, then the leading eigenvalue will not explain a significant portion of the matrix variance. We restrict the HSI calculation to selection signals for which L ≥ 20. Owing to the possibility of genotyping or haplotype-phasing errors, we define regions where the HSI is at least 0.98 as being likely to be selected as a result of a single mutation event and regions with a HSI less than 0.9 as being likely to be selected as a result of multiple mutation events at the same locus.
Simulation of Single-Origin versus Convergent-Evolution Selection Events
In order to assess the ability of haploPS to infer whether a shared selection signal is the result of a single evolutionary event or due to convergent evolution at the same locus in different populations, we performed two sets of 2,000 simulations with the program msms.13 We first simulated a population split at 2,000 generations ago, which resembled the split between non-African populations, to form the modern European and Asian populations. For single-origin selection events, the selection started 2,000 generations before the populations split. For the convergent-evolution events, selection started 1,000 generations after the populations split. The recombination-rate and mutation-rate parameters were set according to recommended values that mimic human demographic history.13 For each of the 2,000 simulations under each of the two scenarios, the advantageous allele was set at position 0.5 and was included in subsequent analyses, and the selection strengths (2NS) for homozygotes and heterozygotes were 1,000 and 900, respectively. Because the selected locus and its derived allele frequency were known, haploPS was applied to these simulated populations to locate the selected haplotypes at the known derived allele frequency and to calculate the HSI for the two selected haplotypes.
Principal-Component Analysis of Positive-Selection Signals
A total of 405 regions in the human genome have been identified in the 14 populations in HapMap3 and SGVP to be positively selected by haploPS. We thus constructed a 14 × 405 matrix in which the (i, j)th element of the matrix takes value 1 if the jth region is found to be positively selected in population i and takes the value of 0 otherwise. On the basis of this matrix, we can derive a 14 × 14 correlation matrix indicating the degree of similarity in the selection signals that were present between every pair of populations. The principal components of this correlation matrix can be obtained via eigen decomposition of the correlation matrix, and the corresponding eigenvectors can be used for calculating the amount of variance explained by the principal components. The proportion of variance explained by the kth principal component can be calculated as λk/Σi(λi), where λi represents the ith eigenvalue.
Additional information about the Material and Methods can be found in the Supplemental Data, available online. All coordinates reported here are referenced against NCBI Genome browser build 36. Simulated data sets and simulation scripts, as well as haploPS analysis scripts, are available at the haploPS website.
Results
Power Comparison with iHS and XP-EHH
We benchmarked the performance of haploPS against iHS and XP-EHH via a series of simulations to evaluate the sensitivity of all three methods. We simulated a total of 2,000 regions, each spanning 100 kb, with the genetic backgrounds of west Africans and introduced a selection sweep with constant selection pressure (see Material and Methods). The simulations were performed across a range of frequencies for the derived allele from 10% to 100% in increments of 10%, and 200 regions were simulated for each frequency. The sensitivity of each method at each frequency was then defined as the proportion of simulations that satisfy the conditions to be successfully identified as being positively selected at a false-discovery rate of 1%, defined against the empirical distributions of the respective metrics calculated from 2,000 iterations.
When haploPS is used to search for selection signals present between 10% and 100% in frequency, it tends to achieve higher sensitivity than both iHS and XP-EHH throughout the frequency spectrum except at fixation, where XP-EHH outperforms both haploPS and iHS (Figure 2). In particular, haploPS is able to identify signals present at lower frequencies (<30%) in the population, even though locating these has been shown to be difficult with existing methods. For example, haploPS achieves 46% power to locate a signal present at 10% in YRI, whereas iHS and XP-EHH only achieve power estimates of 11% and 5%, respectively. When we stratified the true discoveries by the derived allele frequencies and looked at the degree of overlap among the three methods (Figure 3A), we observed that haploPS serves as a valuable complement to both iHS and XP-EHH because it can successfully identify selection signals at low frequencies where neither iHS nor XP-EHH can detect.
Figure 2.
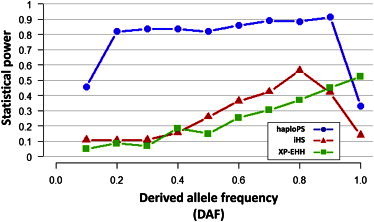
Assessment of Statistical Power of Different Positive-Selection Metrics
The statistical power of haploPS (blue line with circles), iHS (red line with triangles), and XP-EHH (green line with squares) was assessed via simulations of Yoruba Africans (YRI). Power was derived on the basis of 2,000 simulations and was assessed at each derived allele frequency from 10% to 100% at a false-discovery rate of 1%, defined against the empirical distributions of the respective metrics.
Figure 3.
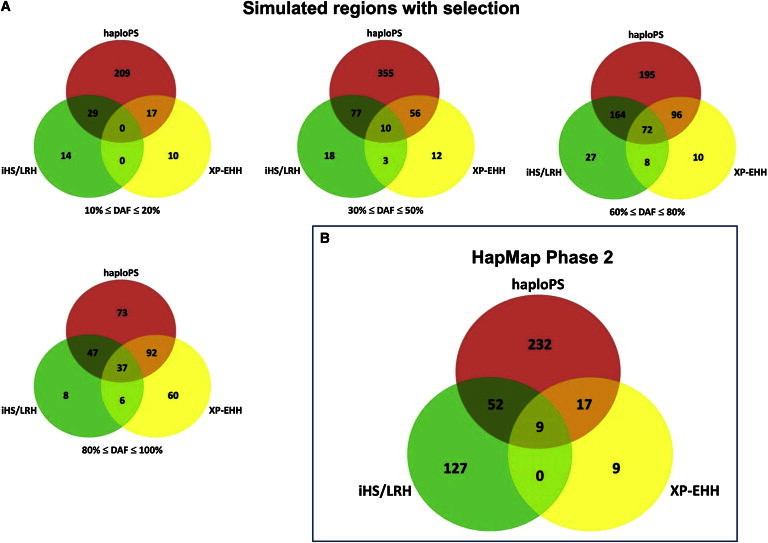
Degree of Overlapping Signals by HaploPS, iHS, and XP-EHH
Positive-selection signals observed by haploPS, iHS, and XP-EHH in (A) the simulation of 2,000 positively selected regions in a population with African ancestry (the results of this simulation are stratified into four frequency bins at 10%–20%, 30%–50%, 60%–80%, and 90%–100%) and (B) the three population panels from Phase II of the International HapMap Project. The numbers found in the overlapping segments of the circles indicate the number of signals that were jointly observed by at least two of the corresponding methods.
In addition to the power simulations, we also performed an empirical comparison among the findings of haploPS, iHS, and XP-EHH when all three methods were used to identify selected regions in the three population panels in Phase II of the HapMap.10 This presents a setting with real data for evaluating the three methods for consistency in the findings and for comparing the number of regions identified by each method.
We observed that the numbers of regions identified by haploPS and iHS were similar (310 and 188, respectively), whereas XP-EHH, a method that purportedly possesses higher power to locate selection signals at a higher frequency spectrum, located only 35 regions (Figure 3B). Of the 35 discoveries made by XP-EHH, 26 were also identified by haploPS, and all nine regions that were identified by both iHS and XP-EHH were found by haploPS. Surprisingly, iHS and haploPS shared only a small fraction of their findings (52 regions) despite the fact that both approaches leverage on LRHs.
Identifying the Founder Haplotype and Predicting Advantageous Allele Frequency
Although haploPS similarly relies on locating genomic evidence of long haplotypes, the construction of the methodology allows the frequency of the selected allele to be estimated, as well as the identification of the founder haplotype form that carries the selected allele. At each locus, haploPS searches for the longest haplotype extended at the position given a haplotype frequency. When the targeted haplotype frequency is above the frequency at which the advantageous allele is found, the longest haplotype identified will be carrying the neutral variant instead. However, once the targeted haplotype frequency drops below the frequency of the advantageous allele, the longest haplotype will be carrying the advantageous allele, and this is expected to be uncharacteristically long compared to other haplotypes that are identified at the same frequency but that are not carrying any advantageous alleles. Therefore, the frequency at which a significant change in the haplotype length occurs is postulated to be an estimate of the frequency of the advantageous allele in the population.
To explore this empirically, we investigated three loci that have been consistently established to be positively selected. Reports on the lactase-encoding gene (LCT [MIM 603202]) suggest a high prevalence of the functional mutation that allows lactase production to persist into adulthood in European populations,5 and the thymine allele associated with lactose persistence at rs4988235 is at a frequency of 75.8% in the Europeans (CEU) in the International HapMap Project. Using haploPS, we observed the presence of an uncharacteristically long haplotype at a frequency of 75% around LCT in CEU (Figure 4A). Similarly, at the ectodysplasin A receptor (EDAR [MIM 604095]) locus in the HapMap East Asians (JPT+CHB), unusually long haplotypes were observed at frequencies of 80% and below (Figure 4B), which suggests that the functional mutation driving the selection signal is expected to be at a frequency of at least 80%. The haemoglobin beta (HBB [MIM 141900]) locus encompasses the sickle cell variant at rs334 in the HapMap west Africans (YRI) with a frequency of 12.5%. We observed that the lengths of the longest haplotypes increased significantly when the core haplotype frequency decreased from 15% to 10%. This suggests that the functional allele driving the selection signal at this region possesses a frequency between 10% and 15% (Figure 4C).
Figure 4.
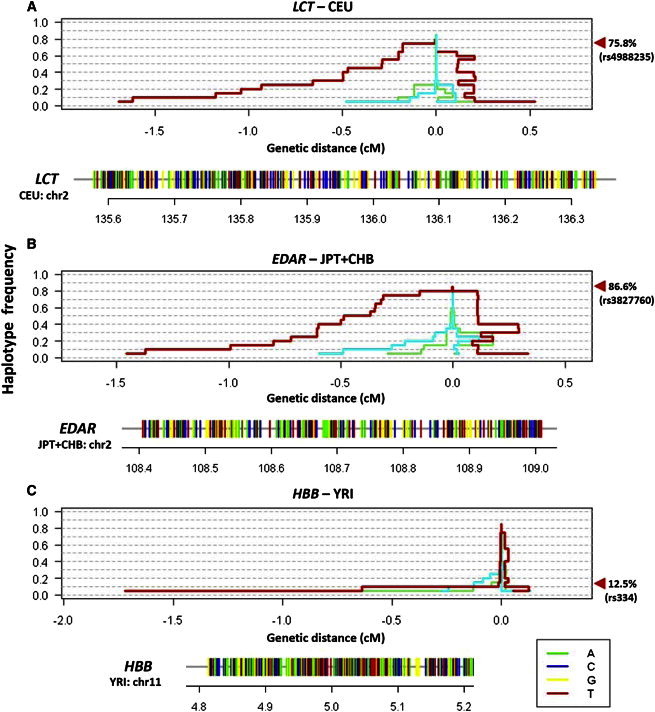
Application of HaploPS at Three Well-Known Positively Selected Loci
HaploPS located positive-selection signals at (A) LCT in Europeans (CEU), (B) EDAR, implicated in hair-follicle development, in East Asians (JPT and CHB), and (C) HBB, containing the sickle cell polymorphism, in Nigerians in West Africa (YRI). For each locus, haploPS additionally located the haplotype form on which the advantageous allele is likely to reside; these haplotypes are represented below each panel as horizontal bars with alleles colored green (adenine), blue (cytosine), yellow (guanine), and red (thymine). HaploPS also provided an estimate for the frequency of the selected allele in its respective population, effectively by locating the frequency that coincides with a significant increase in haplotype length. The red line in each windowed panel illustrates the span of the haplotype around the selected locus at each core frequency, and the other two lines (cyan and lime green) show two examples of the haplotypes spanned at two randomly chosen regions in the genome. The estimated frequencies, with a frequency step size of 5%, for the three loci concurred with those of the derived alleles at the functional polymorphisms (rs4988235 for LCT: estimated 75%, actual 75.8%; rs3822760 for EDAR: estimated 80%, actual 86.6%; and rs334 for YRI: estimated 10%, actual 12.5%).
We also assessed the ability of haploPS to correctly infer the frequency of the advantageous allele by using the regions produced in the power simulations (Figure S1). Here, we evaluated whether a simulated region carrying a functional allele of a particular derived allele frequency was successfully identified by haploPS within a maximum difference of 0.1 in the haplotype frequency (0.1 corresponds to the step size used in the power simulations). We observed that the inference accuracy exceeded 80% at derived allele frequencies between 10% and 50% and that there was a general negative trend whereby the accuracy decreased with increasing frequency of the advantageous allele. The accuracy was considerably lower as the frequency of the advantageous allele went beyond 80%, and most of the errors were attributed to underestimating the actual frequencies (Figure S2).
Characteristics of Positive-Selection Signals in Global Populations
We proceeded to survey the positive-selection landscape with haploPS in 11 populations from Phase III of HapMap14 and three populations from the SGVP,8 and we identified a total of 405 regions across all 14 populations (Table S1). When we investigated the frequency spectrum of these signals, we observed a striking trend whereby a greater proportion of the selection signatures were found at lower frequencies (less than 30%) in populations with at least partial African ancestry (ASW [African ancestry in southwest USA], LWK [Luhya in Webuye, Kenya], MKK [Maasai in Kinyawa, Kenya], and YRI), whereas populations of East or Southeast Asian ancestry were likely to possess more high-frequency signals (at least 80%) (Figure 5A). Populations of European and South Asian ancestries tended to carry more signals of moderate frequency between 30% and 80%. This trend of increasing proportion of low-frequency signals corresponded with populations of increasing genetic diversity as assessed by FST. Although there appeared to be fewer selection signals in African populations than in non-African populations, those that were identified tended to be mostly population specific and of lower frequencies (Figure 5B). In contrast, selection signals found in non-African populations tended to be shared across multiple populations and were of higher frequencies. The only exception appeared to be Mexican Ancestry in Los Angeles, CA, USA (MXL), which carried a significant proportion of low-frequency and population-specific signals.
Figure 5.
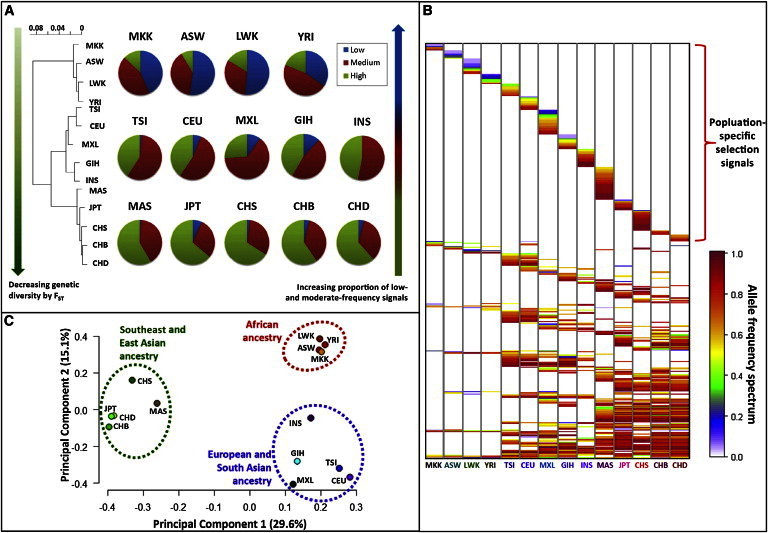
Segregation of Positive-Selection Signals in Global Populations
HaploPS was used to identify positive-selection signals in 14 populations of African (ASW, LWK, MKK, and YRI), European and South Asian (CEU, TSI [Toscani in Italia], MXL [Mexican Ancestry in Los Angeles, CA, USA], GIH [Gujarati Indians in Houston, TX, USA], and INS [Indians in Singapore]), and East and Southeast Asian (CHB, CHD [Chinese in Metropolitan Denver, CO, USA], CHS [Chinese in Singapore], JPT, and MAS [Malays in Singapore]) ancestries.
(A) When the selection signals are grouped according to the estimated frequencies of the derived alleles (low: ≤30%; medium: 30%–80%; and high: ≥80%), populations with African ancestry are likely to possess proportionally more low-frequency signals, whereas East and Southeast Asian populations are likely to possess more high-frequency signals. This matches the segregation of the populations according to genetic diversity as quantified by FST.
(B) Of the 405 signals (as represented in the vertical axis), those that are unique to African populations tend to be lower in frequency, whereas signals that are shared across multiple non-African populations tend to be more common in the populations.
(C) A principal-component analysis (PCA) on the degree of sharing of the selection signals segregated the 14 populations according to major ancestry groups.
Given that, across 14 populations, a total of 405 regions in the human genome were identified by haploPS to be positively selected, a natural question is how many of these are unique to specific populations and how many are shared by multiple populations. To investigate this, we performed a principal-component analysis (PCA) on the degree of sharing of the 405 selected regions across all 14 populations by using a 14 × 14 correlation matrix in which each element quantifies the proportion of the 405 signals that are present in the respective pair of populations. The first two leading principal components of the PCA revealed distinct clustering of the populations according to major ancestry groups (Figure 5C), indicating that populations located within the same geographical region or of similar ancestry are more likely to share the same selection signals.
Although it is unsurprising that populations in the same ancestral clades are more likely to share similar selection signals, a natural extension that haploPS allows is the interrogation of selection sweeps that are likely to stem from a single mutation event versus those where separate mutation events have introduced either the same or different functional alleles at the same locus in different populations. For example, the EDAR locus, which affects hair morphology in East Asians, is one of the most prominent selection signals that has consistently emerged from selection surveys by a variety of metrics. HaploPS located this signature in all four East Asian populations and with estimated derived allele frequencies of 70% in Japanese, 90% in Chinese in Beijing and Denver, and 90% in southern Chinese. The haplotype forms identified by haploPS for these four populations were perfectly concordant at the common sites (Figure 6), suggesting that these populations most likely carry the same functional allele that arose in a single mutation event prior to the time to the most recent common ancestor (TMRCA) of these populations.
Figure 6.
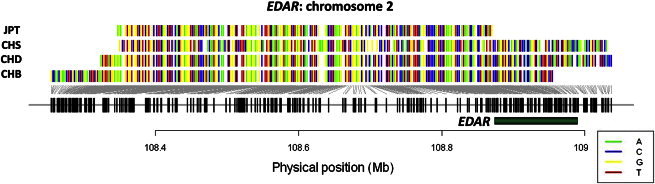
Selected Haplotype Forms at EDAR in East Asians
HaploPS-identified haplotype forms that correspond to the identification of a signal of positive selection at EDAR (green horizontal bar). In all four East Asian populations we surveyed, uncharacteristically long haplotypes were found to span EDAR, and these long haplotypes were observed at frequencies of 70% (JPT) and 90% (CHB, CHD, and CHS). These long haplotypes are exactly identical across the common sites, suggesting that any advantageous mutation that is responsible for the presence of the long haplotypes is likely to have arisen in the same mutation event prior to the time of the most recent common ancestor (TMRCA) of these populations. This will thus explain the occurrence of the beneficial allele against an identical haplotype background in the four populations.
Local adaptation due to diet constitutes one of the strongest evolutionary forces in nature. The persistence of lactase development in adulthood stems from a dairy-centric diet in northern Europe (CEU [adjusted Shap = 0.013]) and drove a selection sweep of the thymine variant at rs4988235 in LCT. A selection signature at LCT was similarly observed by haploPS in the Maasai (MKK [adjusted Shap = 3.0 × 10⁻³]), although the selected haplotype in the Maasai was significantly different from that identified in the northern Europeans and instead carried the cytosine variant at rs4988235 (Figure 7A). This suggests that the cattle-rearing Maasai have evolved different mutations independently from the northern European variant, a finding that concurred with a landmark survey of polymorphisms in LCT by Tishkoff and colleagues.6 This selection signature is not observed in TSI (Toscani in Italia), nor in another three African groups (ASW, LWK, and YRI) that traditionally adopt a starch-based diet.
Figure 7.
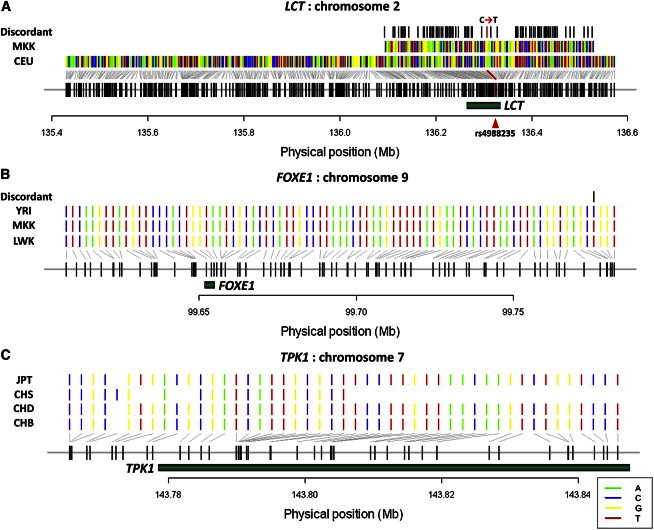
Selected Haplotype Forms at Three Loci Positively Selected in Multiple Populations
Selected haplotypes identified by haploPS at three genes (green horizontal bars) exhibiting evidence of positive selection as a result of diet-induced evolutionary pressure.
(A) The selection of the lactase-encoding gene (LCT) in northern Europeans (CEU) and the seminormadic Maasai people from Kenya (MKK) most likely stems from different mutation events, given the significant discordance in the selected haplotype forms. Moreover, at one of the functional polymorphisms (rs4988235) responsible for an amino acid change, the CEU haplotype correctly carries the functional thymine allele and the MKK haplotype carries the wild-type cytosine allele.
(B) The FOXE1 locus, which has been implicated in thyroid disorders and iodine deficiency, is positively selected in three African populations (LWK, MKK, and YRI), and the selected haplotype forms are remarkably similar (especially among three African populations), suggesting that the selection signals are likely to be the result of the same evolutionary event.
(C) The TPK1 locus is positively selected in East Asia (CHB, CHD, CHS, and JPT), and haploPS located identical haplotype forms, which might have been driven by the same survival pressure due to thiamine deficiency in Asiatic populations as a consequence of traditional rice consumption.
Convergent evolution explains the development of lactase persistence in northern Europe and in eastern Africa, but most diet-driven adaptations conform to similar geography and are most likely the results of gene flow from singular mutation events. HaploPS revealed a selection signal that is present across east and west African populations (LWK, MKK, and YRI [adjusted Shap ≤ 0.042]) and spans the forkhead box E1 (FOXE1 [MIM 602617]) locus (Figure 7B). Mutations in FOXE1 have been associated with thyroid disorders,15 and thyroid maladies have constituted a significant public health problem across the African continent primarily as a result of a deficiency in dietary iodine. Because severe iodine deficiency can also result in infertility in women and a higher chance of miscarriages, mutations that improve iodine synthesis or metabolism are likely to confer strong survival and reproductive advantages. Another selection signature discovered by haploPS in the South and East Asian populations (GIH [Gujarati Indians in Houston, TX, USA], CHB, CHD [Chinese in Metropolitan Denver, CO, USA], CHS [Chinese in Singapore], and JPT [adjusted Shap ≤ 0.041]) spans thiamine pyrophosphokinase 1 (TPK1 [MIM 606370]), which catalyzes the conversion of thiamine to thiamine pyrophosphate (TPP) (Figure 7C). Inadequate levels of TPP cause thiamine deficiency, which is prevalent in Asiatic populations where rice has traditionally been the principal food. In both FOXE1 and TPK1, the functional mutations are expected to have arisen only once given the high concordance in the selected haplotype forms across African (haplotype entropy pent = 0.041 [see Material and Methods]) and Asian (pent = 0.034) populations, respectively.
Pigmentation-related genes, such as SLC24A5 (MIM 609802), KITLG (MIM 184745), and HERC2 (MIM 605837), have classically been used as positive controls for metrics designed to identify selection signals,16 and haploPS similarly discovered these in non-African populations (KITLG) and populations with at least partial European ancestry (HERC2 and SLC24A5) (Table S1). The selected haplotypes at KITLG across all non-African populations are perfectly identical (Figure 8A), and this concurs with previous suggestions of a single selective sweep that happened outside Africa and that led to fairer skin pigmentation.17 Interestingly, the selected haplotype at SLC24A5 in GIH matches the haplotypes in northern (CEU) and southern (TSI) Europeans (Figure 8B), and there is significantly less haplotype diversity around SLC24A5 among these three populations than in the rest of the human genome (pent = 0.003). This suggests that the occurrence of gene flow from Europe into northern India produced the fairer complexions seen in Gujarati Indians, a finding that concurs with migration and expansion of Indo-Europeans into northern India between 1,700 and 1,300 BC, as revealed with paternal lineage analyses.18
Figure 8.
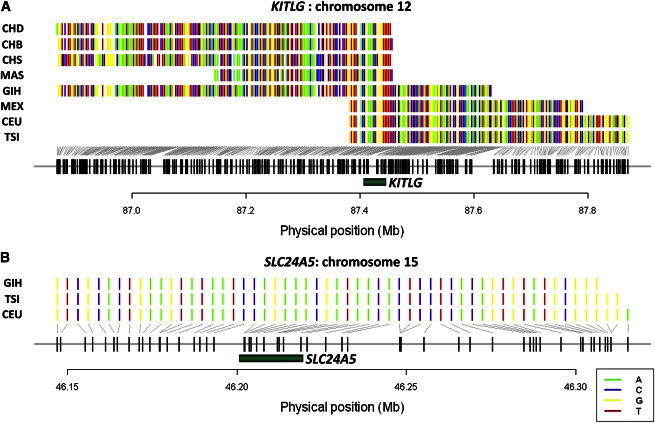
Selected Haplotype Forms at Two Skin-Pigmentation Gene Loci
Haplotypes identified by haploPS to carry the selected alleles at two pigmentation genes, KITLG (A) and SLC24A5 (B) (green horizontal bars).
(A) The KITLG locus has been consistently identified in non-African populations to be positively selected, and the genomic region that is common across all the haploPS haplotypes is perfectly identical, suggesting that the selection sweep most likely happened prior to the TMRCA of these populations.
(B) Similarly, the selected haplotypes at SLC24A5 for Europeans (CEU and TSI) and Gujarati Indians (GIH) are perfectly identical, suggesting that the gene flow between Gujarati Indians and Europeans partly accounts for the lighter skin pigmentation seen across these populations.
Evaluating Origins of Shared Signals by Quantifying Haplotype Similarity
The HSI provides a quantitative method for evaluating whether a selection signal that is observed in multiple populations is likely to have originated from a single mutation event or from multiple independent mutation events either at the same variant or across multiple variants in the same vicinity (see Material and Methods). Under the assumption that the beneficial allele will reside on a founder haplotype that is significantly longer than the background haplotypes of the same frequency, we can thus compare the degree of similarity in the haplotype forms that emerged from the haploPS analysis in the different populations. If the same mutation event is responsible for the selection signal observed across multiple populations, then we expect a significant degree of similarity in the selected haplotype forms of these populations. A HSI of at least 0.98 is interpreted to suggest a single mutation event, owing to the fact that the same founder haplotype is present in multiple populations, whereas a HSI less than 0.9 suggests that different haplotypes are carrying the selected variants, and as such, separate mutation events are expected to have occurred on different haplotype backgrounds (in at least one population) to result in the significant dissimilarity in the haplotype forms.
To evaluate the performance of the HSI, we simulated 2,000 iterations under each of two scenarios that generated either convergent evolutionary events or single-origin events. The two simulated populations mimic the evolutionary history of Europeans and East Asians, who diverged around 2,000 generations ago but shared the same recombination background. For convergent-evolution events, the advantageous allele was introduced 1,000 generations after the populations diverged. For single-origin events, the advantageous allele was introduced 2,000 generations before the populations diverged. By applying the HSI criteria on the selected haplotypes identified by haploPS, we were able to correctly identify 50% of the simulated convergent evolution (10% of the simulations were incorrectly classified as single-origin events). Conversely, for the simulations that mimicked single-origin events, we were able to correctly classify 94% as stemming from the same evolutionary event (none of the simulations were misclassified as convergent-evolution events).
For the selection signals that were presented above, the LCT locus had a HSI of 0.75 for the selected haplotypes identified in the Kenyan Maasai (MKK) and in northern Europeans (CEU), whereas the hair morphology gene, EDAR, had a HSI of 1.00 across the four East Asian populations (CHB, CHD, CHS, and JPT). The examples of diet-driven adaptations at FOXE1 and TPK1 also exhibited HSIs of 1.00 across the three east and west African populations (LWK, MKK, and YRI) and the four East Asian populations, respectively. The pigmentation gene KITLG also displayed a HSI of 1.00, despite the fact that the selection signal was observed in diverse non-African populations of European and East and South Asian ancestries. Similarly, a HSI of 1.00 was observed for the selection signal at SLC24A5 for Europeans (CEU and TSI) and Gujarati Indians (GIH).
Out of the 405 regions identified by haploPS to be positively selected in at least one of the 14 populations, 212 regions were shared by at least two populations, although only 139 regions carried at least 20 SNPs that were shared across multiple populations. We observed that 121 regions had HSIs of at least 0.98 and that ten regions had HSIs of less than 0.90, suggesting that the bulk of the selection signals shared across multiple populations are likely to have stemmed from the same evolutionary event instead of separate mutation events occurring at either the same variant or multiple variants in the same genomic region. However, because our approach only has 50% power to detect convergent evolutionary events, there might be other such events that were not successfully detected. Other than the region encompassing LCT, the remaining nine regions with a HSI less than 0.90 unsurprisingly included an additional six regions found to be selected in CHB, JPT, and TSI: five regions in the human leukocyte antigen (HLA) segment of the major histocompatibility complex on chromosome 6 and a chromosome 12 region encompassing aldehyde dehydrogenase 2 family (ALDH2 [MIM 100650]) (Table 2).
Table 2.
The Ten Regions Identified by HaploPS to Be under Convergent Evolution in Identified Populations
| Chr | Start | End | HSI | Populations | Genesa |
|---|---|---|---|---|---|
| 1 | 35,157,192 | 35,852,095 | 0.85 | CEU, GIH, INS, TSI | ZMYM6, ZNF258, ZMYM1, SFPQ, ZMYM4, NCDN, PSMB2, TFAP2E |
| 1 | 75,238,998 | 75,889,193 | 0.77 | CHB, CHD, CHS, JPT, MAS | LHX8, SLC44A5 |
| 2 | 135,318,981 | 137,528,542 | 0.75 | CEU, MKK | ACMSD, CCNT2, YSK4, RAB3GAP1, ZRANB3, R3HDM1, UBXN4, UBXD2, LCT, MCM6, DARS, CXCR4, THSD7B |
| 6 | 29,388,715 | 31,065,597 | 0.78 | ASW, CEU, CHB, CHD, CHS, GIH, JPT, LWK, TSI, YRI | OR5V1, OR12D3, OR12D2, OR11A1, OR10C1, OR2H1, MAS1L, UBD, GABBR1, SNORD32B, OR2H2, MOG, ZFP57, HLA-F, HLA-G, HLA-A, HLA-H, IFITM4P, HCG4, HCG2P7, HCG4P6, C6orf12, C6orf134, C6orf136, C6orf214, ZNRD1, PPP1R11, PPP1R10, RNF39, TRIM31, TRIM40, TRIM10, TRIM15, TRIM26, TRIM39, GNL1, PRR3, CAT53, MRPS18B, DHX16, NRM, NRM29, MDC1, TUBB, FLOT1, IER3, DDR1, GTF2H4, TFIIH, VARS2, SFTA2, DPCR1, MUC21 |
| 6 | 31,296,179 | 31,556,632 | 0.84 | ASW, CEU, YRI | HLA-C, HLA-B, MICA, HCP5, HCG26 |
| 6 | 33,066,663 | 33,839,447 | 0.89 | ASW, JPT, LWK, MXL, YRI | HLA-DOA, HLA-DPA1, HLA-DPB1, HLA-DPB2, COL11A2, RXRB, SLC39A7, HSD17B8, RING1, VPS52, RPS18, B3GALT4, FP221, WDR46, PFDN6, RGL2, TAPBP, ZBTB22, DAXX, LYPLA2P1, KIFC1, PHF1, CUTA, SYNGAP1, ZBTB9, BAK1, BAK, C6orf227, C6orf125, ITPR3, SBP1, IP6K3 |
| 6 | 65,850,800 | 70,137,233 | 0.84 | MAS, LWK | EYS, UNQ9424, BAI3, BAI |
| 7 | 118,321,619 | 118,579,454 | 0.86 | GIH, INS, MKK | - |
| 12 | 109,915,688 | 111,589,168 | 0.82 | CHB, JPT, TSI | CUX2, FAM109A, SH2B3, ATXN2, BRAP, ACAD10, ALDH2, PNAS1, MAPKAPK5, TMEM116, ERP29, C12orf30, C12orf51, NAP1, TRAFD1, RPL6, PTPN11 |
| 14 | 62,796,468 | 62,834,923 | 0.86 | ASW, INS, MXL | RHOJ |
The ten positive-selection signals were found in multiple populations, and the HSI for each region is less than 0.90. This means that the haplotypes carrying the advantageous variants at each of these ten regions in the different populations is significantly different and thus suggestive of convergent evolution of multiple mutation events, either at the same variant or at different variants in the same genomic region. Abbreviations are as follows: Chr, chromosome; HSI, haplotype similarity index; ASW, African ancestry in southwest USA; CEU, Utah residents with ancestry from northern and western Europe from the CEPH collection; CHB, Han Chinese in Beijing, China; CHD, Chinese in Metropolitan Denver, CO, USA; CHS, Chinese in Singapore; GIH, Gujarati Indians in Houston, TX, USA; INS, Indians in Singapore; JPT, Japanese in Toyko, Japan; LWK, Luhya in Webuye, Kenya; MAS, Malays in Singapore; MKK, Maasai in Kinyawa, Kenya; MXL, Mexican ancestry in Los Angeles, CA, USA; TSI, Toscani in Italia; and YRI, Yoruba in Ibadan, Nigera.
MIM numbers for these genes can be found in Table S2.
Discussion
We have introduced haploPS, a method of locating genomic evidence of positive selection by using the phased haplotypes of multiple samples in a population. It is similar to several currently available approaches, such as EHH, iHS, and XP-EHH, except that haploPS conveniently estimates the population frequency of the allele under selection and identifies the haplotype sequence on which the selected allele sits. The power of haploPS has also been shown to be higher than that of existing methods across a range of selected allele frequencies between 10% and 90% via a series of simulations. When we used haploPS to survey 14 populations from HapMap and SGVP, the 405 selection signals that emerged had a tendency to cluster in populations within ancestral clades, and comparing the degree of similarity in the founder haplotypes allowed us to infer the origins of selection signals shared across multiple populations. We believe haploPS presents a significant advancement as a metric for characterizing positive selection, particularly because it also provides a systematic and quantitative approach for surveying across the whole genome for evidence of convergent evolution versus gene flow to multiple populations from a single mutation event.
In illustrating the performance and utility of haploPS, we have relied on well-known examples of positive selection, such as HBB in Ibadan Yoruba, LCT in Europeans and Kenyan Maasai, and EDAR in East Asians. This was deliberate because these loci have been well characterized, and in the case of HBB and LCT, the actual functional polymorphisms are known; therefore, we could calculate the frequencies of the selected alleles at these loci in the HapMap data and compare them to the haploPS estimates. In the two examples here, haploPS produced estimates comparable to the empirical frequencies. LCT is also a well-studied example by Tishkoff and colleagues6 of convergent evolution in northern Europe and certain cattle-rearing tribes in Africa, and haploPS conferred an in silico approach to correctly infer that the detected selection signals in CEU and MKK stem from different evolutionary processes. The performance of haploPS at these three different loci is thus reassuring, given that in the absence of any established methods for performing in silico and quantitative inference of selection frequency and shared origins, genomic regions with established functional polymorphisms under selection pressure provide useful surrogates for validating the method.
Our results suggest that convergent evolution is generally a rare phenomenon, given that only 10 out of 405 regions located by haploPS were inferred to be undergoing convergent evolution. Other than the lactase-encoding region, five other regions are located in the HLA, and one encompasses a gene in the aldehyde dehydrogenase family. The identification of convergent evolution at the HLA is reassuring because the HLA regions are known to possess LRHs19 and because the HLA is one of the most polymorphic and diverse segments of the human genome and can differ even between seemingly homogeneous populations such as northern and southern Han Chinese.20
In our inference of the 405 signals present across the HapMap and SGVP populations, we saw an enrichment of low-frequency signals in Africans when compared to non-Africans, whereas for East Asians, there was an enrichment of high-frequency signals. There are at least two possible explanations for this observation. First, this might simply be an artifact introduced as a natural consequence of population bottlenecks in the Out-of-Africa migratory process. Non-African populations are believed to have propagated from a relatively small number of individuals who left the Africa continent, thus restricting the extent of genetic diversity that can be present outside Africa and effectively increasing the degree of genetic similarity. Each subsequent migratory process that happened outside Africa to populate the rest of the continents most likely involved individuals with an even smaller amount of genetic diversity, and thus populations with a more recent common ancestor, such as the East Asians, are expected to exhibit a greater degree of genetic sharing within populations. This means that an advantageous mutation that had arisen before the migratory processes but happened to be carried by most of the migrants most likely ended up at a higher frequency in the more recent populations as compared to the founding population. Second, the enrichment of low-frequency signals in Africans might be indicative of the fact that adaptive pressure continues to be significant in African populations without adequate modern healthcare, either as a response to emerging infectious diseases or as a result of changing environments and diets, thus resulting in the discovery of recently introduced advantageous variants found at lower frequencies into the human genome. Modern healthcare can lower the incidence of infant and childhood mortality and attenuate the evolutionary pressure for a population to adapt naturally.
The use of genetic distance has featured prominently in several metrics for the detection of positive selection. Metrics such as EHH, iHS, and XP-EHH rely on genetic distance as a surrogate measure of the extent of recombination in the local genomic region. Fundamentally, LRH-based metrics for positive selection aim to identify uncharacteristically long stretches of haplotypes, after accounting for the background recombination that ought to break down the haplotypes. However, the genetic distance used in such calculations is always the version that averages across the population-specific rates from the HapMap 2 CEU, JPT+CHB, and YRI populations and never the population-specific rates. The rationale for this is simple: in a genomic region harboring a high-frequency advantageous mutation in a specific population, most of the chromosomes in this region are likely to be exactly of the same form, which implies that there is remarkably low haplotype and SNP diversity in this region. This means that the amount of recombination in this region is artificially suppressed, given that there is insufficient diversity in this region to reflect the breakdown of haplotypes via recombination. Because of the artificially lowered recombination rates, the genetic distance is much smaller, and this region will thus not emerge from the positive selection scans if the population-specific recombination rates are used.
Calculating the population-averaged recombination rates and genetic distance is meant to hedge against the impact of positive selection in one or two of the populations in underestimating the recombination rates. However, this does inadvertently bias the sensitivity of these metrics in discovering signals of positive selection in populations of different ancestries. For example, in African populations where linkage disequilibrium is considerably shorter, the genetic distance between two SNPs tends to be higher than in non-African populations. The average of the genetic distance across all the populations thus tends to underestimate the true genetic distance in African populations while potentially overestimating the distance in non-African populations. This results in different outcomes for metrics like iHS and XP-EHH, which use genetic distance to quantify the probability of haplotype switches, and for haploPS, which relies on genetic distance directly to quantify the strength of the positive-selection evidence. Metrics like iHS and XP-EHH will actually overestimate the evidence in African populations, resulting in a higher sensitivity as compared to that for non-African populations,16 whereas haploPS will have a lower power to discover selection signals in African populations as compared to non-African populations. This also means that metrics that rely on genetic distance (including haploPS) will have almost no power to identify a selection signal that exists in all the populations used for estimating the genetic distance (see additional results in the Supplemental Data).
The haploPS algorithm explicitly adjusts for the number of test statistics that have been generated for each core haplotype frequency in a manner akin to Bonferroni correction, even though the haploPS score is not strictly a significance value. Although this might appear to be overly conservative when applied to high-density SNP data where a larger number of regions ought to be tested, in practice we did not observe a significant difference in the findings between Phases II and III of the HapMap CEU data. This is because haploPS considers contiguous stretches of haplotypes and, using a denser SNP database, will mostly identify haplotypes that span the same physical locations in the genome, except that each haplotype will now cover more SNPs in a manner that is relatively consistent across the genome. Empirically, we did not observe a significant difference in the number of regions when we analyzed the CEU data from HapMap2 and HapMap3 (for example, 21,416 and 18,855 regions, respectively, tested at a core frequency of 10%), even though the former contained around 2.6 million SNPs and the latter only contained about 1.5 million SNPs. However, one practical scenario in which a denser SNP database might result in the testing of more regions is due to errors in the phasing of haplotypes, and this might be caused by wrong genotypes from the unsupervised genotype calling process or the presence of more low-frequency and rare SNPs. These two factors can increase the number of switch errors in the phased haplotypes,21,22 and switch errors affect the performance of most LRH-based methods for detecting positive selection. The implication of switch errors to the performance of haploPS is to increase the number of regions tested, given that haploPS is explicitly searching for contiguous stretches of long haplotypes that are found at a particular frequency in the population. This can thus reduce the power of haploPS.
Recent evidence by Hernandez and colleagues has suggested that classic selective sweeps that leave distinctive imprints of long haplotypes in the human genome are likely to be rare in recent human evolution,23 and polygenic selection or selection on standing variation might explain existing interpopulation genomic diversity. It is important to note that our findings here are not in conflict with this report. Classic selective sweeps achieve fixation that most LRH methods applied to singular populations are not designed to identify anyway. In addition, Hernandez and colleagues estimated that fewer than 10% (which corresponds to about 1,000) of the nonsynonymous SNPs are likely to be advantageous, and our discovery of 405 selected loci across 14 populations is in line with this expectation. Although it was suggested that classic selective sweeps are rare, we emphasize that there is no dispute to the legitimacy of local adaptation at genes such as LCT, HBB, EDAR, and SLC24A5, as well as others related to diet, the environment, or emerging infectious diseases.
That haploPS can potentially identify the haplotype form on which the selected allele resides is exciting, given that the comparisons of these haplotype forms across populations carrying the selection signals can shed light on the commonality of the selection event through the identification of founder haplotypes. Even for the positive-selection signals that have been successfully detected by a variety of metrics, the origin and segregation of most of these signals remain unexplored. HaploPS provides a unique opportunity to investigate these issues. As a complement to existing strategies for locating and fine mapping genomic signatures of positive selection, haploPS presents an addition to the arsenal of methods for understanding the nature and the impetus behind the diversity of human populations.
Acknowledgments
X.L., R.T.H.O., and Y.Y.T. acknowledge support from the Saw Swee Hock School of Public Health from the National University of Singapore and the National Research Foundation Singapore (NRF-RF-2010-05). E.N.P. and Y.Y.T. also acknowledge the support from the Life Sciences Institute, National University of Singapore. A.M.E., K.S.S., T.G.C., D.P.K., and Y.Y.T. acknowledge support from the MalariaGEN Consortium. The MalariaGEN Consortium is supported by grants from the Wellcome Trust (WT00383/Z/05/Z) and the Bill and Melinda Gates Foundation through the Foundation for the National Institutes of Health (566) as part of the Grand Challenges in Global Health Initiative. The Wellcome Trust also provided core awards to the Wellcome Trust Centre for Human Genetics (090532/Z/09/Z) and the Wellcome Trust Sanger Institute (098051). D.P.K. also acknowledges support from the Medical Research Council UK (G0600718) and the Wellcome Trust (090770/Z/09/Z).
Supplemental Data
Web Resources
The URLs for data presented herein are as follows:
HapFinder, http://www.statgen.nus.edu.sg/∼SGVP/software/hapfinder.html
iHS and XP-EHH, http://hgdp.uchicago.edu/Software/
International HapMap Project, http://hapmap.ncbi.nlm.nih.gov/
NCBI Genome browser, http://www.ncbi.nlm.nih.gov/genome
Online Mendelian Inheritance in Man (OMIM), http://www.omim.org
Singapore Genome Variation Project (SGVP), http://www.statgen.nus.edu.sg/∼SGVP
References
- 1.Sabeti P.C., Schaffner S.F., Fry B., Lohmueller J., Varilly P., Shamovsky O., Palma A., Mikkelsen T.S., Altshuler D., Lander E.S. Positive natural selection in the human lineage. Science. 2006;312:1614–1620. doi: 10.1126/science.1124309. [DOI] [PubMed] [Google Scholar]
- 2.Voight B.F., Kudaravalli S., Wen X., Pritchard J.K. A map of recent positive selection in the human genome. PLoS Biol. 2006;4:e72. doi: 10.1371/journal.pbio.0040072. [DOI] [PMC free article] [PubMed] [Google Scholar]
- 3.Grossman S.R., Shlyakhter I., Karlsson E.K., Byrne E.H., Morales S., Frieden G., Hostetter E., Angelino E., Garber M., Zuk O. A composite of multiple signals distinguishes causal variants in regions of positive selection. Science. 2010;327:883–886. doi: 10.1126/science.1183863. [DOI] [PubMed] [Google Scholar]
- 4.Hanchard N., Elzein A., Trafford C., Rockett K., Pinder M., Jallow M., Harding R., Kwiatkowski D., McKenzie C. Classical sickle beta-globin haplotypes exhibit a high degree of long-range haplotype similarity in African and Afro-Caribbean populations. BMC Genet. 2007;8:52. doi: 10.1186/1471-2156-8-52. [DOI] [PMC free article] [PubMed] [Google Scholar]
- 5.Bersaglieri T., Sabeti P.C., Patterson N., Vanderploeg T., Schaffner S.F., Drake J.A., Rhodes M., Reich D.E., Hirschhorn J.N. Genetic signatures of strong recent positive selection at the lactase gene. Am. J. Hum. Genet. 2004;74:1111–1120. doi: 10.1086/421051. [DOI] [PMC free article] [PubMed] [Google Scholar]
- 6.Tishkoff S.A., Reed F.A., Ranciaro A., Voight B.F., Babbitt C.C., Silverman J.S., Powell K., Mortensen H.M., Hirbo J.B., Osman M. Convergent adaptation of human lactase persistence in Africa and Europe. Nat. Genet. 2007;39:31–40. doi: 10.1038/ng1946. [DOI] [PMC free article] [PubMed] [Google Scholar]
- 7.Frazer K.A., Ballinger D.G., Cox D.R., Hinds D.A., Stuve L.L., Gibbs R.A., Belmont J.W., Boudreau A., Hardenbol P., Leal S.M., International HapMap Consortium A second generation human haplotype map of over 3.1 million SNPs. Nature. 2007;449:851–861. doi: 10.1038/nature06258. [DOI] [PMC free article] [PubMed] [Google Scholar]
- 8.Teo Y.Y., Sim X., Ong R.T., Tan A.K., Chen J., Tantoso E., Small K.S., Ku C.S., Lee E.J., Seielstad M., Chia K.S. Singapore Genome Variation Project: a haplotype map of three Southeast Asian populations. Genome Res. 2009;19:2154–2162. doi: 10.1101/gr.095000.109. [DOI] [PMC free article] [PubMed] [Google Scholar]
- 9.Ong R.T., Liu X., Poh W.T., Sim X., Chia K.S., Teo Y.Y. A method for identifying haplotypes carrying the causative allele in positive natural selection and genome-wide association studies. Bioinformatics. 2011;27:822–828. doi: 10.1093/bioinformatics/btr007. [DOI] [PubMed] [Google Scholar]
- 10.Sabeti P.C., Varilly P., Fry B., Lohmueller J., Hostetter E., Cotsapas C., Xie X., Byrne E.H., McCarroll S.A., Gaudet R., International HapMap Consortium Genome-wide detection and characterization of positive selection in human populations. Nature. 2007;449:913–918. doi: 10.1038/nature06250. [DOI] [PMC free article] [PubMed] [Google Scholar]
- 11.Schaffner S.F., Foo C., Gabriel S., Reich D., Daly M.J., Altshuler D. Calibrating a coalescent simulation of human genome sequence variation. Genome Res. 2005;15:1576–1583. doi: 10.1101/gr.3709305. [DOI] [PMC free article] [PubMed] [Google Scholar]
- 12.Spencer C.C., Coop G. SelSim: a program to simulate population genetic data with natural selection and recombination. Bioinformatics. 2004;20:3673–3675. doi: 10.1093/bioinformatics/bth417. [DOI] [PubMed] [Google Scholar]
- 13.Ewing G., Hermisson J. MSMS: a coalescent simulation program including recombination, demographic structure and selection at a single locus. Bioinformatics. 2010;26:2064–2065. doi: 10.1093/bioinformatics/btq322. [DOI] [PMC free article] [PubMed] [Google Scholar]
- 14.Altshuler D.M., Gibbs R.A., Peltonen L., Altshuler D.M., Gibbs R.A., Peltonen L., Dermitzakis E., Schaffner S.F., Yu F., Peltonen L., International HapMap 3 Consortium Integrating common and rare genetic variation in diverse human populations. Nature. 2010;467:52–58. doi: 10.1038/nature09298. [DOI] [PMC free article] [PubMed] [Google Scholar]
- 15.Denny J.C., Crawford D.C., Ritchie M.D., Bielinski S.J., Basford M.A., Bradford Y., Chai H.S., Bastarache L., Zuvich R., Peissig P. Variants near FOXE1 are associated with hypothyroidism and other thyroid conditions: using electronic medical records for genome- and phenome-wide studies. Am. J. Hum. Genet. 2011;89:529–542. doi: 10.1016/j.ajhg.2011.09.008. [DOI] [PMC free article] [PubMed] [Google Scholar]
- 16.Pickrell J.K., Coop G., Novembre J., Kudaravalli S., Li J.Z., Absher D., Srinivasan B.S., Barsh G.S., Myers R.M., Feldman M.W., Pritchard J.K. Signals of recent positive selection in a worldwide sample of human populations. Genome Res. 2009;19:826–837. doi: 10.1101/gr.087577.108. [DOI] [PMC free article] [PubMed] [Google Scholar]
- 17.Coop G., Pickrell J.K., Novembre J., Kudaravalli S., Li J., Absher D., Myers R.M., Cavalli-Sforza L.L., Feldman M.W., Pritchard J.K. The role of geography in human adaptation. PLoS Genet. 2009;5:e1000500. doi: 10.1371/journal.pgen.1000500. [DOI] [PMC free article] [PubMed] [Google Scholar]
- 18.Zhao Z., Khan F., Borkar M., Herrera R., Agrawal S. Presence of three different paternal lineages among North Indians: a study of 560 Y chromosomes. Ann. Hum. Biol. 2009;36:46–59. doi: 10.1080/03014460802558522. [DOI] [PMC free article] [PubMed] [Google Scholar]
- 19.de Bakker P.I., McVean G., Sabeti P.C., Miretti M.M., Green T., Marchini J., Ke X., Monsuur A.J., Whittaker P., Delgado M. A high-resolution HLA and SNP haplotype map for disease association studies in the extended human MHC. Nat. Genet. 2006;38:1166–1172. doi: 10.1038/ng1885. [DOI] [PMC free article] [PubMed] [Google Scholar]
- 20.Suo C., Xu H., Khor C.C., Ong R.T., Sim X., Chen J., Tay W.T., Sim K.S., Zeng Y.X., Zhang X. Natural positive selection and north-south genetic diversity in East Asia. Eur. J. Hum. Genet. 2012;20:102–110. doi: 10.1038/ejhg.2011.139. [DOI] [PMC free article] [PubMed] [Google Scholar]
- 21.Chen W., Li B., Zeng Z., Sanna S., Sidore C., Busonero F., Kang H.M., Li Y., Abecasis G.R. Genotype calling and haplotyping in parent-offspring trios. Genome Res. 2013;23:142–151. doi: 10.1101/gr.142455.112. [DOI] [PMC free article] [PubMed] [Google Scholar]
- 22.Menelaou A., Marchini J. Genotype calling and phasing using next-generation sequencing reads and a haplotype scaffold. Bioinformatics. 2013;29:84–91. doi: 10.1093/bioinformatics/bts632. [DOI] [PubMed] [Google Scholar]
- 23.Hernandez R.D., Kelley J.L., Elyashiv E., Melton S.C., Auton A., McVean G., Sella G., Przeworski M., 1000 Genomes Project Classic selective sweeps were rare in recent human evolution. Science. 2011;331:920–924. doi: 10.1126/science.1198878. [DOI] [PMC free article] [PubMed] [Google Scholar]
Associated Data
This section collects any data citations, data availability statements, or supplementary materials included in this article.