

Background: The ubiquitously expressed high mobility group N (HMGN) protein variants affect chromatin structure and transcription.
Results: Hmgntm1/tm1 mice, which may express mutant proteins defective in nucleosome binding, display variant-specific phenotypes and tissue-specific altered transcription profiles.
Conclusion: HMGN variants fine tune the fidelity of the cellular transcription profile.
Significance: HMGN proteins impact the cellular phenotype by modulating the transcription levels of numerous genes.
Keywords: Chromatin, Chromosomes/Non-histone Chromosomal Proteins, Gene Regulation, Transcriptomics, Transgenic Mice, HMG Proteins, Mouse Physiology
Abstract
The nuclei of most vertebrate cells contain members of the high mobility group N (HMGN) protein family, which bind specifically to nucleosome core particles and affect chromatin structure and function, including transcription. Here, we study the biological role of this protein family by systematic analysis of phenotypes and tissue transcription profiles in mice lacking functional HMGN variants. Phenotypic analysis of Hmgn1tm1/tm1, Hmgn3tm1/tm1, and Hmgn5tm1/tm1 mice and their wild type littermates with a battery of standardized tests uncovered variant-specific abnormalities. Gene expression analysis of four different tissues in each of the Hmgntm1/tm1 lines reveals very little overlap between genes affected by specific variants in different tissues. Pathway analysis reveals that loss of an HMGN variant subtly affects expression of numerous genes in specific biological processes. We conclude that within the biological framework of an entire organism, HMGNs modulate the fidelity of the cellular transcriptional profile in a tissue- and HMGN variant-specific manner.
Introduction
The structure and function of chromatin are regulated by the action of numerous nuclear proteins, including that of nucleosome-binding proteins, such as the linker histone H1, and of the various members of the high mobility group (HMG)4 protein superfamily. Histone H1 is a family of closely related proteins each encoded by a distinct gene, which are expressed in a species- and tissue-specific manner (1–3). The HMG protein superfamily consists of three distinct families denoted HMGA, HMGB, and HMGN, each of which consists of several protein variants (4–7). As a group, H1 and HMG variants are chromatin architectural proteins; all are intrinsically disordered structural proteins that bind to nucleosomes without any known specificity for the underlying DNA sequence and affect chromatin functions by altering either the global or local chromatin structure.
Numerous studies revealed that H1 and HMG protein variants affect gene regulation and impact the cellular phenotype (1, 5, 8–10), yet the cellular function and mechanism of action of these proteins remains one of the least understood aspects of chromatin biology. A major unanswered question is the extent of functional specificity of the various H1 and HMG variants. This question is particularly complicated because all HMGs affect the chromatin binding of all the H1 variants, and within each protein family, the various members compete with each other for nucleosome-binding sites (11, 12). Thus, all these architectural proteins function within a dynamic network in which changes in the levels of any protein trigger compensatory adjustments, perhaps aimed at minimizing deleterious biological effects (12, 13). Nevertheless, the presence of the proteins in most vertebrate cells, and a variety of studies, including analysis of genetically altered mice, suggest that most HMG variants have specific biological functions (5, 14). Here, we focus on the HMGN protein family, and we use genetically altered mice to examine whether HMGN variants have specific effects on the transcription profile in the biological context of an entire organism.
The HMGN protein family consists of five members, named HMGN1–5, which are encoded by distinct genes that have been detected only in vertebrates (15). Each HMGN is composed of the same basic structure as follows: a bipartite nuclear localization signal, an evolutionarily conserved nucleosome binding domain, and a divergent C-terminal region. HMGNs specifically recognize the generic structure of the nucleosome core particle: they do not bind specifically to either purified DNA or isolated histones. All HMGNs contain a highly conserved region through which they bind specifically to an acidic patch formed by the H2A and H2B dimer when it is folded into its nucleosomal conformation (16, 17).
Studies on the cellular function and mechanism of action of HMGN proteins indicate that these proteins affect the cellular transcription profile and cellular differentiation and enhance the ability of a cell to repair damaged DNA (5). The ability of HMGN to affect these processes is contingent on their binding to chromatin; mutants that do not bind to nucleosomes do not affect chromatin structure and function. Significantly, genome-wide analysis reveals that HMGN1 preferentially binds to chromatin regulatory sites such as DNase I-hypersensitive sites, enhancers, and promoters (18). The interaction of HMGN with chromatin has been shown to affect chromatin “compaction” and the levels of histone modifications, two processes that play a major role in epigenetic regulation (15). Taken together, the emerging data indicate that HMGN proteins bind dynamically to chromatin, compete among themselves and with other nuclear proteins for chromatin-binding sites, and affect chromatin function, including transcription chromatin compaction and histone modifications.
Although several types of experiments provided insights into the mechanisms whereby HMGN proteins can affect chromatin functions, the extent of functional redundancy among the HMGN variants is still not fully understood. The structural similarities of all HMGNs, taken together with the similarity in their nucleosomal binding constants and their competition for nucleosome-binding sites, raised the possibility that the HMGN variants are fully functionally redundant. However, the presence of all HMGN variants in most tissues, and the phenotypes seen in Hmgntm1/tm1 mice, argues for functional specificity. Thus, Hmgn1tm1/tm1 mice exhibit behavioral abnormalities (19) and impaired repair of damaged DNA (20, 21), whereas Hmgn3tm1/tm1 mice are mildly diabetic (22). Likewise, transcriptional analysis of mouse embryonic fibroblasts derived from Hmgn1tm1/tm1, Hmgn3tm1/tm1, and Hmgn5tm1/tm1 mice revealed that in these cells HMGN variants are not fully redundant (8).
Experiments with cells grown in tissue culture do not always reflect the true biological function of a protein. To gain insights into the function of HMGN variants in the biological setting of an entire organism, we first subjected Hmgn1tm1/tm1, Hmgn3tm1/tm1, and Hmgn5tm1/tm1 mice and their wild type littermate controls to a battery of standardized tests designed to reveal abnormalities in several physiological properties (23, 24). The various tests identified specific abnormalities in each of the mouse lines, reinforcing the general notion that HMGN variants are not fully redundant and raising the possibility that each variant has specific effects on the transcription profile of a tissue. To examine this possibility, we analyzed the expression profile of four different tissues in each of the Hmgntm1/tm1 lines. We find that each HMGN variant significantly affects the expression of a limited number of genes, with minimal overlap between the genes affected, and that each tissue analyzed had a distinct set of genes affected by each HMGN. Furthermore, examination of the effect of HMGN loss on whole biological pathways, rather than focusing on the changes in expression levels of individual genes, reveals that each HMGN variant has distinct and significant effects on specific biological processes, perhaps rendering them prone to further disruption by subsequent genetic events or extracellular stress. Our studies demonstrate that within the framework of an entire organism, HMGNs modulate the fidelity of the cellular transcription profile, in a tissue- and variant-specific manner.
EXPERIMENTAL PROCEDURES
Mice
All HMGN mutants derived thus far are targeted mutations of their nucleosomal binding domain and are denoted as “tm1” mutants by the mouse nomenclature committee of The Jackson Laboratory. The generation of Hmgn1tm1/tm1 (21) and conditional Hmgn3tm1/tm1 (22), in which the native gene was replaced with a genomic fragment that lacks the exons coding for the nucleosomal binding domain of these proteins (Fig. 1), was previously described. The same strategy was used to derive Hmgn5tm1/tm1 mice.5 Mice were bred in a specific pathogen-free facility with food and water ad libitum.
FIGURE 1.
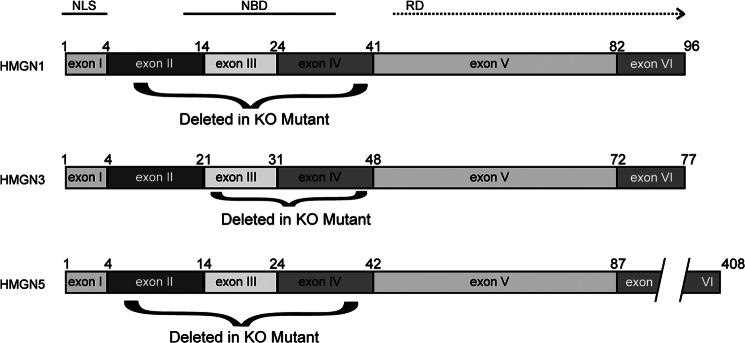
Overview of the genotype of Hmgntm1/tm1 mice. Diagrams detailing structural domains of HMGN proteins and the mutations in them used in this study are shown. Each rectangle represents an exon from the coding sequence of the gene in question; the amino acids at the boundaries of the exons are marked above the diagrams. The exons deleted in creating the functional knock-outs for each HMGN variant are denoted by the black curved line below the diagrams, and the amino acid positions at the boundary of the excised domains, which are missing in the respective Hmgntm1/tm1 mouse, are marked on either side of the curved line. NLS, nuclear localization sequence; NBD, nucleosome binding domain. RD, regulatory domain.
Phenotype Analysis
A battery of tests was used to analyze the phenotype of the Hmgntm1/tm1 mice at the German Mouse Clinic (24) for the study. A detailed description of the methods can be found on line, at the German Mouse Clinic website.
RNA Isolation
Eight mice (four mutants and four controls) for each HMGN at 17 weeks of age were killed and organs prepared as described recently (25). Total RNA of brain, liver, spleen, and thymus was prepared according to the manufacturer's protocol using RNeasy mini kits (Qiagen). RNA integrity was controlled on a formaldehyde-agarose gel, and the concentration was calculated from A260/280 measurements. 500 ng of this high quality total RNA was amplified using the Illumina TotalPrep RNA amplification kit (Ambion).
IIlumina Bead Arrays
The amplified cRNA was hybridized to MouseRef-8 Version 2 Expression BeadChips (Illumina, San Diego) and after a 16-h incubation, staining and scanning were done according to the Illumina expression protocol. Data were normalized using the GenomeStudio Version 2011.1 software and processed using the quantile normalization, background subtraction option, and introduction of an offset to remove remaining negative expression values.
Identification of Up- and Down-regulated Genes
The identification of differentially expressed genes was performed using significant analysis of microarrays (25, 26) included in the TM4 software package (27). To estimate the false discovery rate, nonsense genes were identified using 1000 permutations of the measurements. Top differentially expressed genes were selected using the false discovery rate of 0.1 and fold change of >1.4. Array data are available in the GEO database under accession number GSE39062.
In addition, based on gene expression profiles in mutant and wild type mice, we identified significantly up- and down-regulated genes in mutant mice across the panel of available tissues. With four tissues under consideration (i.e. brain, liver, spleen, and thymus) and three HMGN variants (i.e. HMGN1, HMGN3, and HMGN5), we generated 12 differentially expressed gene lists, each list being specific to a tissue and protein variant. The gene lists contain from 17 to 97 genes. Five gene lists (HMGN3tm1/tm1 brain and liver tissues, HMGN1tm1/tm1 liver and spleen tissues, and HMGN5tm1/tm1 thymus) do not contain any up-regulated genes.
Principal Component Analysis of Gene Expression
Principal component analysis, which is a popular tool for dimension reduction and data visualization, linearly transforms a set of correlated features into a set of orthogonal features, known as principal components, so that they optimally describe data variability (28, 29).
To visualize gene expression data in a reliable manner, we focused on the genes featuring large expression changes, because small expression changes may be caused by experimental noise. Only the genes with the S.D./μ ratio higher than 0.1 (where S.D. and μ are the standard deviation and average level of gene expression, respectively) were selected for the study, and the expression of these genes was normalized so that the expression of each gene has the unit standard deviation and zero mean. Based on the normalized data, we then evaluated the discriminating capability of each gene by using an unpaired Student's t test. We used the top 100 genes with the largest discriminating capabilities for Principal component analysis.
Functional Analysis of Gene Lists
To evaluate the function of a gene list, we used gene functional annotations from the Gene Ontology (GO) database (30, 31). The enrichment of a gene annotation category in a given gene list was estimated according to Equation 1,
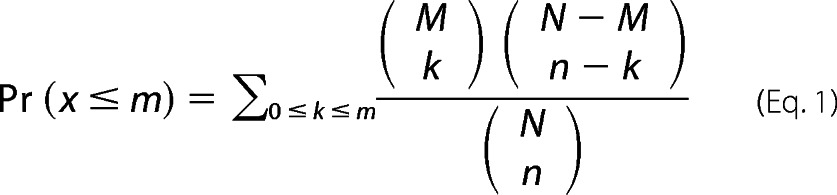 |
where n is the number of genes in the tested gene list, and m is the number of genes in the tested gene list that have the investigated function. Furthermore, M is the number of all genes in the investigated functional category, and N is the number of all mouse genes. To account for multiple testing, we adopted the method of Benjamini and Hochberg (32) with the adjusted p value <0.05.
Pathway Analysis Based on Gene Expression
Using a set of pathways (each being represented by a group of the genes comprising it) and genome-wide gene expression profiles from samples belonging to two classes (labeled as wild type and mutation in this study) as input, we used a computational method. In contrast to traditional pathway analysis methods, such as gene set enrichment analysis (33) and significant analysis of microarray-GS (34), our significant pathway analysis method evaluates the activity of all pathways in each given sample. More specifically, significant pathway analysis includes three main steps as follows: normalization of gene expression, evaluation of the expression significance of each pathway, and estimation of the significance of the difference of pathway expression between wild type and mutation samples.
Given gene gi, we normalized its expression in sample j as fold change relative to the expression in wild type samples, i.e. the expression of gi in sample j, zij, is normalized as xij = zij/zi,0, where zij is the original expression of gi in sample j, and zi,0 is the average expression of gi in the wild type samples. Based on the normalized gene expressions (xi), we measured the expression significance of the pathway pwi in sample j as shown in Equation 2,
where mij and mj are the expression median of the genes in the pathway pwi and among all genes in sample j, respectively. sig(pwi,j), the expression significance p value of pwi in sample j, is evaluated through comparing the expression levels of the genes in pwi with the entire gene expression profile under Wilcoxon rank-sum test, the nonparametric alternative to the two-sample t test. The positive/negative eij indicates that the pathway pwi is up-/down-regulated in the sample j. The greater the absolute value of eij, the significantly higher pwi is expressed in sample j. Also, based on the normalized gene expression, we estimate the significance of the difference of the expression of pwi between wild type and mutation samples. Wilcoxon rank-sum test is used for this purpose. pwi is considered as up-regulated after mutation when the median of the expression of the genes in pwi in all mutation samples is larger than that in wild type samples, otherwise pwi is considered as down-regulated after mutation.
RESULTS
Genetically Altered HMGN Mice
All the members of the HMGN protein family contain distinct functional domains, encoded by six distinct exons (Fig. 1). Exon 1, which is absolutely conserved among all the variants, encodes for the N-terminal segment of a bipartite nuclear localization signal (35). Exon 2 codes for a variable region; its function has not yet been clearly defined. Exon 3 codes for the most highly conserved protein region, an 11-amino acid segment with the sequence P(X)RRSARLSAK, which is the signature of the HMGN protein family and is responsible for the specific binding of the HMGNs to nucleosome core particles (16, 17). This domain, together with the domain encoded by exon 4, constitutes the main nucleosome binding domain of the protein. Exons 5 and 6 encode a negatively charged region that has very little sequence conservation. This region is considered to be the “regulatory domain” of the proteins, because through this domain HMGNs affect chromatin compaction and levels of histone modification (36–39). These epigenetic activities of HMGN are absolutely dependent on the ability of the protein to bind to nucleosome core particles. Mutants that do not bind to nucleosomes do not affect the levels of histone modification, do not decompact chromatin, and do not noticeably affect chromatin related activities such as the repair of damaged DNA (21, 36–39).
The mouse genome encodes four HMGN proteins as follows: HMGN1, HMGN2, HMGN3, and HMGN5 (14). We generated genetically altered mice for Hmgn1, Hmgn3, and Hmgn5; genetically altered Hmgn2 mice are not yet available. We aimed to elucidate the biological significance of the interaction of each HMGN with chromatin; therefore, in all the Hmgntm1/tm1 mice, we deleted only the nucleosome binding domain of the respective HMGN variant, thereby abolishing its ability to bind specifically to chromatin. In Hmgn1tm1/tm1 (21), Hmgn3tm1/tm1 (22), and Hmgn5tm1/tm1 mice we deleted, respectively, exons II–IV, III–IV, and II–IV (Fig. 1). Immunofluorescence and Western analysis of Hmgn1tm1/tm1 (21) and Hmgn3tm1/tm1 (22) indicate that the wild type proteins are not expressed in these mutants; however, we note that Western analysis of cellular extracts prepared from Hmgntm1/tm1 cells occasionally reveals the presence of a truncated protein, an indication that the mutated genes can be transcribed.
All the Hmgntm1/tm1 mice survived and did not display an obvious gross phenotype. However, upon more detailed analysis, the Hmgn1tm1/tm1 mice showed behavioral abnormalities, increased tumorigenicity, and impaired repair of damaged DNA (19–21). HMGN3 is highly expressed in pancreatic beta cells, and the Hmgn3tm1/tm1 mice are mildly diabetic (22). These studies suggest that loss of even a single HMGN variant can result in a phenotype detectable at the level of an entire organism.
To gain additional insights into the biological function of the HMGN variants in the context of a whole organism, we subjected the three HMGN knock-out mouse strains to a standardized battery of tests performed at the German Mouse Clinic (24, 41). For these tests, we bred sufficient heterozygous mice to obtain 20 males and 20 females from both wild type and Hmgn knock-out mice. Thus, for each strain a total of 80 mice, born within 1 week, were shipped for analysis from the National Institutes of Health, Bethesda, to the German Mouse Clinic. Table 1 summarizes the phenotypes detected in the mice, i.e. the tests that show distinct differences between the cohort of wild type mice and the cohort of their knock-out littermates, which lack the nucleosomal domain of a specific HMGN variant. Additional information, including the tests that do not show differences between wild type and mutant mice, is available at the German Mouse Clinic website.
TABLE 1.
Phenotypes observed in Hmgntm1/tm1 mice
The abbreviations used are as follows: IpGTT, intraperitoneal glucose tolerance test; IC, inspiratory capacity; ERV, expiratory reserve volume; VC, vital capacity; TLC, total lung capacity; FVC, forced vital capacity.
| Screens | Test | Phenotypea |
||
|---|---|---|---|---|
| Hmgn1tm1/tm1 | Hmgn3tm1/tm1 | Hmgn5tm1/tm1 | ||
| Behavior | Open field | Decreased rearing activity | No | No |
| Acoustic startle and prepulse inhibition | Lower acoustic startle activity | Decreased PPI | Decreased PPI | |
| Neurology | Modified SHIRPA protocol | No | No | No |
| Grip strength | No | Reduced | No | |
| Nociception | Hot plate assay | No | Hypoalgesia | No |
| Clinical chemistry and hematology | Clinical chemistry | No | See website | See website |
| Hematology | No | No | Changes in the red blood cell count | |
| Simplified IpGTT | No | Increased fasting-induced body mass loss, increased peak glucose | Sex-specific effects on basal glucose level and glucose tolerance | |
| Steroid metabolism | Corticosterone level | Decreased in females | Decreased in females | No |
| Testosterone level | No | Increased in males | No | |
| Immunology | FACS, leukocyte proportions | No | No | Higher frequency of CD8+ T cells and lower frequency of granulocytes |
| Bioplex: immunoglobulin levels | No | No | Higher IgA | |
| Allergy | IgE level | No | No | Low IgE |
| Lung function | Pulmonary function test | No | No | Sign differences in lung volumes (IC, ERV, VC, TLC, and FVC), flow rates (FEV100), mechanical properties (Cchord); emphysema-like phenotype |
| Molecular phenotyping | Genome-wide transcriptome analysis | Differential gene expression in liver, spleen, thymus and brain | ||
a See the Mouse Clinic website for additional data.
The phenotypic screen of the three Hmgntm1/tm1 lines identified specific abnormalities in each of the mouse lines; however, the various phenotypes detected did not represent a major functional loss of any of the properties investigated (Table 1). Nevertheless, taken together with the previous studies on Hmgn1tm1/tm1 and Hmgn3tm1/tm1 mice (14, 19–21, 42, 43), the data presented in Table 1 indicate that loss of a specific HMGN variant leads to distinct phenotypes, an indication that the proteins are not fully functionally redundant.
HMGN Variant-specific Effects on Transcription
The phenotypes seen in the Hmgntm1/tm1 mice suggest HMGN variant-specific effects on transcription. To test this possibility and to examine effects of HMGN variants on the transcription profile of a tissue, we compared the transcription profiles in the brain, liver, thymus, and spleen of wild type mice and their Hmgntm1/tm1 littermates. RNA was prepared from tissues that were isolated from four male knock-out mice and four littermate controls for each HMGN variant and analyzed using Illumina bead arrays.
We found only small differences between the HMGN variants in their effect on the total number of genes whose expression was significantly changed in the four tissues examined; it ranged from 134 genes in the tissues taken from Hmgn1tm1/tm1 mice to 236 genes changed in Hmgn5tm1/tm1 tissues (Fig. 2A). Significantly more genes were down-regulated than up-regulated as a result of HMGN loss; 76% of genes regulated by HMGN1, 94% of genes regulated by HMGN3, and 81% of genes regulated by HMGN5 were down-regulated upon loss of the respective HMGN variant (Fig. 2B). Notably, there was little overlap between the genes affected by the deletion of a specific HMGN variant. Within the genes up-regulated in the four tissues, there was no overlap at all, and within the down-regulated genes, only two genes, Csn2, an isoform of β-casein (44), and Azgp1, zinc-α2-glycoprotein, a tumor suppressor involved in obesity and metabolism (45), were targets of all three HMGN variants. Within the cohort of the down-regulated genes, just 21 targets, i.e. only 6% of the total down-regulated genes, were altered by the loss of two HMGN variants (Fig. 2B). The genes whose expression was altered by the loss of more than one HMGN variant are listed in Table 2. GO analysis failed to reveal specific pathways associated with these genes (Table 3). These results indicate that HMGN proteins affect the transcription profile in a variant-specific manner. Our finding that most of the genes affected were down-regulated is consistent with the general notion that HMGNs localize to chromatin regulatory regions and reduce chromatin compaction, perhaps enhancing the ability of positive regulators to access their cognate binding sites.
FIGURE 2.

Effects of HMGN variant loss on global gene expression in mouse tissues. A, number of genes affected by each HMGN variant. B, HMGN variant-specific effects on the transcription profile of mouse tissues. C, principal component analysis of HMGN variant-specific transcriptional profile changes in mouse tissues.
TABLE 2.
Overlapping genes regulated by HMGN1, HMGN3, and/or HMGN5
| HMGN variants | Gene | Function |
|---|---|---|
| HMGN1 and HMGN3 | Mup2 | Regulator of glucose and lipid metabolism |
| Acaa1b | Acetyl-coenzyme A acyltransferase 1B | |
| H2-M2 | Histocompatibility 2, M region locus 2 | |
| Fga | Fibrinogen α-chain | |
| Kng1 | Kininogen 1, essential for blood coagulation and assembly of the kallikrein-kinin system | |
| Ttr | Transthyretin, a carrier protein for thyroid hormone | |
| HMGN1 and HMGN5 | Sfrs5 | Serine/arginine-rich splicing factor 5, part of the spliceosome |
| Shisa2 | Protein controlling head formation during development | |
| Sumo1 | Small ubiquitin-like molecule 1, a signal for protein trafficking | |
| Uchl5 | Ubiquitin C-terminal hydrolase L5 | |
| Atp6ap2 | Lysosomal ATPase H+ transporter | |
| Csf2rb2 | Colony-stimulating factor 2 receptor, β2 | |
| Ccl21a | Chemokine (C-C motif) ligand 21A | |
| Gp2 | Pancreatic zymogen granule membrane-associated protein | |
| Il4i1 | Involved in catalysis and binding of flavin adenine dinucleotide (FAD) cofactor | |
| HMGN3 and HMGN5 | PomC | Polypeptide hormone precursor |
| Tank | Blocks TNF signaling | |
| Mup1 | Regulator of glucose and lipid metabolism | |
| Abl1 | Nonreceptor tyrosine kinase involved in cell division | |
| Abpb | Androgen binding protein β | |
| Mup5 | Regulator of glucose and lipid metabolism | |
| HMGN1, HMGN3, and HMGN5 | Csn2 | β-Casein |
| Azgp1 | Tumor suppressor, involved in obesity and metabolism |
TABLE 3.
GO functional categories affected by Hmgn knockdown
The table lists the two GO categories most affected in the various tissues by the functional loss of an HMGN variant. Full list of all the GO categories is presented in supplemental Table 2. Tissues not listed contained no significant GO categories.
| HMGN variant/tissue/regulation | GO ID | GO category, biological process | Total no. of genes in GO category | No. of hits | p | q | Genes |
|---|---|---|---|---|---|---|---|
| Hmgn3tm1/tm1 brain down | GO:0016486 | Peptide_hormone _processing | 20 | 5 | 1.28E-10 | 6.31E-07 | Tshb, Lhb, Cga, Pomc, Fshb |
| GO:0051604 | Protein_maturation | 75 | 6 | 2.60E-09 | 6.41E-06 | Tshb, Fshb, Serpinh1, Lhb, Cga, Pomc | |
| Hmgn3tm1/tm1 spleen down | GO:0051346 | Negative_regulation_of_ hydrolase_activity | 241 | 8 | 2.50E-11 | 1.23E-07 | Serpina1e, Apoa1, Ambp, Kng1, Apoc3, Apoa2, Serpina1c, Ahsg |
| GO:0043086 | Negative_regulation_of_ catalytic_activity | 540 | 8 | 1.16E-08 | 2.85E-05 | Ahsg, Apoa1, Ambp, Kng1, Apoc3, Serpina1c, Apoa2, Serpina1e | |
| Hmgn5tm1/tm1 spleen down | GO:0006397 | mRNA_processing | 284 | 6 | 2.88E-06 | 7.10E-03 | Sfrs5, Hnrnpk, Ddx20, Celf1, Dhx15, Hnrnpa2b1 |
| GO:0008380 | RNA_splicing | 269 | 6 | 2.11E-06 | 1.04E-02 | Sfrs5, Hnrnpk, Ddx20, Celf1, Dhx15, Hnrnpa2b1, | |
| Hmgn5tm1/tm1 thymus down | GO:0003012 | Muscle_system_process | 121 | 7 | 8.94E-08 | 4.41E-04 | Tnnc2, Myl3, Tpm2, Acta1, Tnni2, Tnnt3, Atp2a1 |
| GO:0003009 | Skeletal_muscle_ contraction | 9 | 3 | 2.29E-06 | 5.65E-03 | Tnnt3, Tnni2, Tnnc2 |
Effects of HMGN Variant Loss on the Transcriptional Profiles of Specific Tissues
To examine the effect of HMGN variants on tissue-specific gene expression, we organized all the genes that were affected by HMGNs into 24 variant- and tissue-specific lists as follows: one per tissue (i.e. total of 4), per HMGN variant (i.e. total of 3), and per either up- or down-regulation of the genes in question. Principal component analysis of these gene lists (Fig. 2C) revealed that the tissues themselves tended to cluster according to tissue type, regardless of genotype. However, within each tissue, the four wild type mice clustered separately from the four knock-out mice (Fig. 2C). These results are consistent with the relatively small number of genes affected by each HMGN variant; in addition, they also indicate that functional loss of an HMGN variant does not alter the tissue-specific pattern of gene expression. Thus, HMGNs do not act as specific regulators of gene expression; they fine tune the pre-existing tissue-specific transcription profile.
Examining the overall trends in gene regulation in HMGN knock-out mouse tissues, we observed that the largest number of genes changed in liver (186 down-regulated and 21 up-regulated), and the smallest number of genes (a total of 89) changed in brain tissues (Fig. 3, A and B). In all tissues, the majority of changed genes were down-regulated; the largest effect of a single variant was observed in the liver of Hmgn3tm1/tm1 mice where the expression of 91 genes was down-regulated (Fig. 3A). The highest percentage of up-regulated genes, 37%, was in the brain (Fig. 3, A and B). Whether up- or down-regulated, there was very little overlap between the genes affected in the various tissues by all the HMGN variants, as a group (Fig. 3B). Thus, only two genes overlapped between tissues among the up-regulated genes, and 14 genes among the down-regulated genes, i.e. 3% of the genes so regulated in either case (Fig. 3B). Spleen tissue had the highest amount of overlapping genes as follows: six genes were down-regulated in both Hmgn1tm1/tm1 and Hmgn3tm1/tm1 spleens, and another set of four genes were down-regulated in both Hmgn1tm1/tm1 and Hmgn5tm1/tm1 spleens, for a total of 10% overlap in spleen-specific genes. These data indicate that each tissue has a unique set of HMGN target genes.
FIGURE 3.

HMGN variants affect the transcription profile in a tissue specific-manner. A, number of genes affected in various tissues. B, Venn diagrams depicting the number of overlapping genes up- or down-regulated in various tissues from HMGN knock-out mice. C, Venn diagrams depicting the number of overlapping genes regulated by a specific HMGN variant in various tissues from HMGN knock-out mice.
Analysis of the effects of a single HMGN variant on the tissue-specific transcription profiles reveals very little overlap among the four tissues examined (Fig. 3C). None of the genes affected by any of the three HMGN variants are shared among all the four tissues examined. Only six of the 134 genes affected by the loss of HMGN1, i.e. 4.5%, are shared among two tissues. In Hmgn3tm1/tm1 and Hmgn5tm1/tm1 mice, respectively, only 4.8 and 1.2% of their target genes are shared among more than one tissue (Fig. 3C). Thus, each set of target genes is essentially both HMGN variant-specific and tissue-specific.
The magnitude of the changes in transcript levels does not vary significantly among the tissues or among the HMGN variants (Table 4). Interestingly, the effects seen in the various tissues obtained from the mice are smaller than those previously detected in mouse embryonic fibroblasts (8), cells which are not yet fully differentiated, and are grown in tissue culture. It is also possible that the effects are smaller due to the more stringent guidelines used to analyze the tissues as compared with the ones used for the mouse embryonic fibroblasts (8). It remains to be determined whether these differences reflect the changes in cellular differentiation stage or differences between cells grown in tissue culture and whole tissues obtained directly from the mice.
TABLE 4.
Magnitude of transcriptional changes in tissues and mouse embryonic fibroblasts from Hmgntm1/tm1 mice
| Genotype | Tissue | Magnitude of fold change | Total no. of genes changed | |
|---|---|---|---|---|
| Tissues | N1 KO vs. WT | Brain | −1.79 to 1.82 | 30 |
| N1 KO vs. WT | Liver | −4.01 to −1.55 | 19 | |
| N1 KO vs. WT | Thymus | −5.48 to 3.24 | 47 | |
| N1 KO vs. WT | Spleen | −2.63 to −1.34 | 38 | |
| N3 KO vs. WT | Brain | −8.07 to −1.48 | 34 | |
| N3 KO vs. WT | Liver | −8.24 to −1.50 | 91 | |
| N3 KO vs. WT | Thymus | −2.73 to 2.43 | 17 | |
| N3 KO vs. WT | Spleen | −7.24 to 1.71 | 23 | |
| N5 KO vs. WT | Brain | −7.81 to 2.27 | 25 | |
| N5 KO vs. WT | Liver | −4.06 to 3.35 | 97 | |
| N5 KO vs. WT | Thymus | −10.11 to −1.70 | 68 | |
| N5 KO vs. WT | Spleen | −2.14 to 3.01 | 43 | |
| Mouse embryonic fibroblastsa | N1 KO vs. WT | −11.22 to 47.86a | 47a | |
| N3 KO vs. WT | −28.8 to 59.24a | 82a | ||
| N5 KO vs. WT | −12.88 to 43.95a | 16a |
a See Ref. 8.
Further demonstrating the unique effects of each HMGN variant on the transcription profile of a specific tissue, we note that these effects form clear variant-dependent patterns (Fig. 4 and supplemental Table S1). Within each tissue, the target genes can be organized into distinct groups according to which HMGN variant is functionally deleted. In brain tissue, there are five distinct groups defined by HMGN variant loss as follows: genes down-regulated by HMGN5 loss (group A); genes down-regulated by HMGN3 loss (group B); genes down-regulated by HMGN1 loss (group C); genes up-regulated by HMGN1 loss (group D), and genes up-regulated by HMGN5 loss (group E) (Fig. 4A). In liver tissue, there are eight distinct groups defined by HMGN variant loss as follows: genes down-regulated by HMGN3 and HMGN5 loss and slightly up-regulated by HMGN1 loss (group F); genes down-regulated by HMGN1 loss (group G); genes down-regulated by HMGN1 loss and up-regulated by HMGN3 or HMGN5 loss (group H); genes very mildly up-regulated by HMGN3 loss or HMGN5 loss (group I); genes up-regulated by HMGN5 loss (group J); genes down-regulated by HMGN3 loss or HMGN5 loss (group K); genes down-regulated only by HMGN3 loss (group L), and genes down-regulated only by HMGN5 loss (group M) (Fig. 4B). In spleen tissue, there are three distinct groups defined by HMGN variant loss as follows: genes up-regulated by HMGN1 loss and HMGN3 loss (group N); genes down-regulated by HMGN1 loss and HMGN3 loss (group O), and genes down-regulated only by HMGN1 loss (group P) (Fig. 4C). In thymus tissue, there are five distinct groups defined by HMGN variant loss as follows: genes up-regulated by HMGN5 loss (group Q); genes down-regulated by HMGN1 loss (group R); genes down-regulated by HMGN3 loss (group S); genes up-regulated by HMGN1 loss (group T), and genes down-regulated by HMGN5 loss (group U) (Fig. 4D).
FIGURE 4.

Heat plots describing general trends of changes in the transcription profile of mouse tissues obtained from mice lacking specific HMGN variants. A, brain. B, liver. C, spleen. D, thymus. Fold change, represented by the blue-yellow color scale, was calculated by dividing the signal intensity of an individual mutant mouse by the average signal intensity of the four appropriate control mice (mutant/over mean control) for the HMGN variant in question. The expression values used to generate the heat maps are available in the eight worksheets presented in supplemental Table 1.
Notably, most of the genes in brain, liver, and thymus tissues respond specifically to the functional loss of a specific HMGN variant and remain relatively unchanged in response to the loss of another HMGN variant (groups A–E, Fig. 4A; groups G, J, L, and M, Fig. 4B; and groups Q–U, Fig. 4D; also group P in Fig. 4C). Interestingly, group H in the liver consists of genes that are down-regulated by HMGN1 loss but up-regulated by HMGN3 loss as well as HMGN5 loss (Fig. 4B). Spleen tissue is unique, as the effects of HMGN1 and HMGN3 loss appear the same in all groupings, although HMGN5 loss appears to have very little effect (groups N–P, Fig. 4C); similar groupings can be seen in liver groups F, I, and K, where HMGN3 and HMGN5 loss appears to have comparable effects (Fig. 4B). Nevertheless, the majority of the groupings remain HMGN variant-specific, reinforcing the principle that each HMGN variant affects the expression of a distinct set of genes, and in some cases may regulate any shared targets in opposing ways.
HMGN Variants Fine Tune the Fidelity of the Cellular Transcription Profile
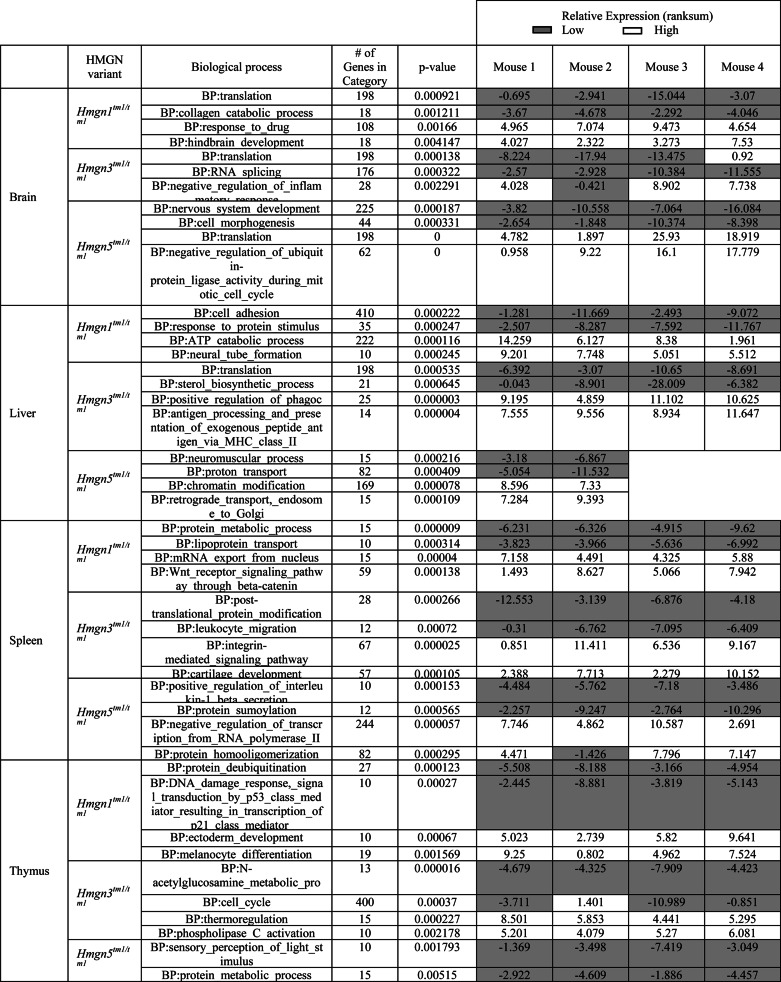
In addition to examining the genes with significant changes in expression level, we investigated the effect of HMGN variant loss on the entire transcriptional pathways, regardless of the magnitude of change in individual gene expression levels. Using a form of gene set enrichment analysis for pathway analysis of each sample (see “Experimental Procedures”), biological pathways were identified, in which an expression change was observed for the most of the associated genes (with potentially small expression changes of individual genes comprising the pathway) in each of the four mice examined in the three Hmgntm1/tm1 mice lines (Table 5 and supplemental Table S3). In total, we identified 282 biological pathways that were significantly affected by the loss of an HMGN variant (supplemental Table S3). The two pathways that were either most up- or down-regulated in the four tissues of the three mice lines examined are listed in Table 5. In each of these pathways, the majority of the involved genes are expressed coordinately (up- or down-regulated at the same time). Although the expression level of the individual genes comprising these pathways did not change significantly, the number of differentially expressed genes is significant, and as a group, the entire biological pathway is affected in each of the four Hmgntm1/tm1 mice in the three mouse lines. These results indicate that the loss of any HMGN variant affects the fidelity to the transcriptional program in a subtle but significant manner in each of the tissues examined. The small changes in the fidelity to the transcriptional program do not lead to drastic phenotypes under normal conditions (Table 1); however, when the mice are placed under stress, the lack of fidelity takes its toll, and the mice develop symptoms (22). Such a mechanism would explain why HMGNs have been conserved and are present in all vertebrate cells. It is likely that their presence enhances the fidelity of the cellular transcription profile and the subtle changes resulting from their loss are evolutionarily unfavorable, especially when the organism is exposed to environmental stress.
TABLE 5.
Transcriptional effects of HMGN variant loss on biological processes
Functional Relevance of Transcriptional Changes in Hmgntm1/tm1 Mice
Although small changes in the expression of many genes within a pathway can affect an entire biological process, we note that the individual genes that were significantly affected by the loss of more than one HMGN variant do not fall into any one particular functional category (Table 2), indicating that as a protein family the HMGN variants do not target specific biological processes. GO analysis of the effects of single HMGN variants on genes expressed in the various tissues (Table 3 and supplemental Table 2) reveals that affected genes associated with specific biological processes were overrepresented in only four cases; the loss of HMGN3 affected several processes in the brain and in the spleen, whereas the loss of HMGN5 affected biological processes in the spleen and thymus. Examination of the genes listed revealed a significant overlap between the GO categories identified. The five genes from the GO category 0016486 in the brains of Hmgn3tm1/tm1 mice are also part of the three other GO categories affected in the brains of Hmgn3tm1/tm1 mice (Table 3 and supplemental Table 2). Likewise, all the sets of genes down-regulated in the Hmgn3tm1/tm1 spleen contain Apa1, -2, or -3 genes, and in the spleen of Hmgn5tm1/tm1 an identical set of genes is affected in all the three categories listed.
Thus, our analyses do not reveal unique biological pathways that are markedly affected by the three HMGN variants in the tissues studied here when analyzed using only significantly changed genes, and they suggest that the phenotypes observed so far in the Hmgntm1/tm1 mice are the consequence of the effects of HMGN variants on the expression levels of a few genes within a tissue. However, as elaborated below, some of these affected genes are indeed linked to the phenotypes observed in Hmgntm1/tm1 mice and could provide insights into the molecular mechanisms leading to these phenotypes.
The gene coding for HMGN1 is located in the Down syndrome critical region (46); HMGN1 protein is overexpressed in patients suffering from this syndrome, and mice with altered HMGN1 expression display behavioral abnormalities (19). Several of the HMGN1 targets identified here are consistent with these phenotypes. Ttc3, an E3 ubiquitin ligase, prevents proper neuronal differentiation when up-regulated in Down syndrome (47) and is accordingly down-regulated upon loss of HMGN1 function. Overexpression of the transcription factor Neurod1, which we detected in Hmgn1tm1/tm1 brain, could lead to increased neuronal survival at the expense of proper patterning (48). The transcription factor Egfl7 inhibits Notch signaling and thus neuronal differentiation (49); the up-regulation of Egfl7 in Hmgn1tm1/tm1 brain tissue therefore might lead to the differentiation of fewer neurons than normal. The potentially altered neuronal differentiation could be directly connected to the behavioral phenotype of the Hmgn1tm1/tm1 mice shown in Table 1. It has recently been demonstrated that modified levels of neuronal progenitor differentiation can be associated with modified levels of exploratory activity akin to the rearing/exploration phenotype observed here (50). Both alterations, up-regulation of transcription factors involved in neuronal differentiation and the altered rearing phenotype, are only present in Hmgn1tm1/tm1 mice and not in Hmgn3tm1/tm1 or Hmgn5tm1/tm1 mice.
In addition, Hmgn1tm1/tm1 mice are deficient in the repair of damaged DNA leading to hypersensitivity to both UV and ionizing radiation and to an increased incidence of certain tumors (20, 21). Several of the HMGN1 targets we found here could be involved in these processes. Chtf8, a component of the Ctf18 replication factor C complex, is down-regulated in Hmgn1tm1/tm1 spleen tissue; similar down-regulation has been observed in prostate and renal tumors (51). Cbr3, a member of the carbonyl reductase family, which is known to increase cellular sensitivity to ionizing radiation (52), is up-regulated in Hmgn1tm1/tm1 thymus tissue. Likewise, down-regulation of Slfn1, a regulatory gene affecting thymocyte development (53) in the thymus of Hmgn1tm1/tm1 mice, up-regulation of Fosb, a subunit of the AP1 transcription factor complex (54) in Hmgn1tm1/tm1 brain, and down-regulation of G0s2, a protein expressed during the G0/G1 switch in mitosis (55) in Hmgn1tm1/tm1 liver provide hints for future research on the possible role of HMGN1 in carcinogenesis.
HMGN3 is strongly expressed in brain (56, 57) and in pancreatic beta cells, and Hmgn3tm1/tm1 mice are mildly diabetic (22). HMGN3 is indirectly regulated by thyroid hormone and interacts with it during frog metamorphosis (58). Several of the HMGN3 targets identified in this study provide support for the known phenotypes and suggest additional genes of interest. Thus, the thyroid hormone receptor Tshr and PomC, a polypeptide hormone precursor that controls feeding and body weight (59), are down-regulated in Hmgn3tm1/tm1 brain tissue, and Trib3, a putative protein kinase, implicated in hyperglycemia and glucose intolerance (60, 61) is down-regulated in the Hmgn3tm1/tm1 liver. Muscle tissues were not analyzed in Hmgn3tm1/tm1 mice in this study, and only weak expression was previously reported in skeletal muscle (50). The reduced grip strength detected only in Hmgn3tm1/tm1 mouse mutants could therefore be a secondary effect to differences in energy metabolism found in these mutants and not in Hmgn1tm1/tm1 or Hmgn5tm1/tm1 mice.
The newly characterized HMGN variant, HMGN5, has not yet been implicated in any published phenotypes. Targets of potential biological interest include the members of the Lce3 family, which are involved in the etiology of autoimmune disease (62); the mitogens Eapp and Abl1 (63, 64), which are up-regulated in Hmgn5tm1/tm1 liver; and centrosomal protein Cep57, which is down-regulated in the Hmgn5tm1/tm1 spleen, and this suggests that HMGN5 mutant cells might be prone to aneuploidy (65).
DISCUSSION
Elucidation of the role of HMGN proteins in transcriptional regulation is central to understanding their biological function and mechanism of action. This study aims to provide insights into this question by systematic analysis of phenotypes in mice lacking functional HMGN variants and through the biological context of whole tissue transcription profile analysis. In some cases the transcriptional effects may be also due to the expression of the HMGN mutant proteins that further impact the HMGN-regulated gene expression. Analysis of the transcription profiles of the four different tissues derived from each of the three Hmgntm1/tm1 mouse lines provides several new insights into their effect on transcription.
First, phenotypic analysis of the mice indicates that each HMGN variant affects specific cellular functions, suggesting specific effects on gene expression. Second, each HMGN variant significantly affects the expression of a limited number of genes in a variant-specific manner. Third, each variant affects gene expression in a tissue-specific manner. Fourth, functional loss of HMGN variants preferentially leads to down-regulation of gene expression levels. Fifth, HMGN variant loss leads to small changes in the expression levels of numerous genes in a particular pathway, thereby affecting of the transcriptional program in a cell type-specific manner.
In considering possible mechanisms involved in the transcriptional specificity, we note that although the nucleosome binding domains of all HMGNs are quite similar, their C-terminal domains are variable, and thus may interact with different regulators to enact their transcriptional effects (15). Furthermore, previous studies demonstrated that all HMGN proteins bind to nucleosomes and that this interaction affects the higher order chromatin structure and the levels of histone modification, in some cases in a variant-specific manner. Thus, HMGN1 and HMGN2 form specific complexes with nucleosome core particles, in which either two molecules of HMGN1 or two molecules of HMGN2 are associated with one core particle; nucleosome complexes with one molecule of each type of HMGN variant have not been detected (66). Likewise, it has been demonstrated that HMGN1 and HMGN2 affect the acetylation and phosphorylation of histone H3 in a variant-specific manner (38). In addition, both HMGN1 and HMGN2 form several types of multiprotein complexes and can associate with specific protein partners (67, 68). Recent work suggests that classic transcription factors may display cell type-specific behavior (40); whether HMGNs contribute to this specificity or may themselves be affected by it remains to be seen. As HMGN proteins bind to DNA in a nonsequence-specific manner, they may rely on specific protein partners to guide them to their appropriate sites. We note that our studies do not exclude the remote possibility that in some cases the expression of mutant proteins, lacking the nucleosome binding domain may also impact the cellular transcription profile.
Our findings do not exclude the possibility of functional redundancy among HMGN variants. It is still possible that by and large HMGN variants are functionally redundant for most cellular genes, but that each variant has a more pronounced effect on a subset of genes.
Acknowledgments
We thank Reinhard Seeliger, Anke Bettenbrock, Jan Einicke, Michael Färberböck, Ralf Fischer, Corinne Graf, Christine Hollauer, Elfi Holupirek, Maria Kugler, Sören Kundt, Simon Orth, Florian Schleicher, Ann-Elisabeth Schwarz, Nadine Senger, Yvonne Sonntag, Bettina Sperling, Alida Theil, and Anja Wohlbier, as well as the mouse embryonic fibroblasts animal caretaker team for expert technical assistance. The German Mouse Clinic was supported by National Genome Research Network-Plus Grants 01GS0850, 01GS0851, 01GS0852, 01GS0853, 01GS0854, and GS0868.
This work was supported, in whole or in part, by National Institutes of Health grants from the Center for Cancer Research, NCI. This work was also supported by the Research Program of the National Library of Medicine; Grant 2009326 from the United States-Israeli Binational Foundation; German Federal Ministry of Education and Research to the German Center for Diabetes Research; German Center for Vertigo and Balance Disorders Grant 01 EO 0901, Infrafrontier Grant 01KX1012, and Initiative and Networking Fund of the Helmholtz Association in the framework of the Helmholtz Alliance for Mental Research in an Aging Society Grant HA-21.

This article contains supplemental Tables 1–3.
M. Rochman, T. Furusawa, and M. Bustin, unpublished data.
- HMG
- high mobility group
- HMGN
- high mobility group N
- GO
- Gene Ontology.
REFERENCES
- 1. Happel N., Doenecke D. (2009) Histone H1 and its isoforms: contribution to chromatin structure and function. Gene 431, 1–12 [DOI] [PubMed] [Google Scholar]
- 2. Catez F., Ueda T., Bustin M. (2006) Determinants of histone H1 mobility and chromatin binding in living cells. Nat. Struct. Mol. Biol. 13, 305–310 [DOI] [PMC free article] [PubMed] [Google Scholar]
- 3. Khochbin S. (2001) Histone H1 diversity: bridging regulatory signals to linker histone function. Gene 271, 1–12 [DOI] [PubMed] [Google Scholar]
- 4. Bianchi M. E., Agresti A. (2005) HMG proteins: dynamic players in gene regulation and differentiation. Curr. Opin. Genet. Dev. 15, 496–506 [DOI] [PubMed] [Google Scholar]
- 5. Hock R., Furusawa T., Ueda T., Bustin M. (2007) HMG chromosomal proteins in development and disease. Trends Cell Biol. 17, 72–79 [DOI] [PMC free article] [PubMed] [Google Scholar]
- 6. Bustin M. (2001) Revised nomenclature for high mobility group (HMG) chromosomal proteins. Trends Biochem. Sci. 26, 152–153 [DOI] [PubMed] [Google Scholar]
- 7. Bustin M. (1999) Regulation of DNA-dependent activities by the functional motifs of the high-mobility-group chromosomal proteins. Mol. Cell. Biol. 19, 5237–5246 [DOI] [PMC free article] [PubMed] [Google Scholar]
- 8. Rochman M., Taher L., Kurahashi T., Cherukuri S., Uversky V. N., Landsman D., Ovcharenko I., Bustin M. (2011) Effects of HMGN variants on the cellular transcription profile. Nucleic Acids Res. 39, 4076–4087 [DOI] [PMC free article] [PubMed] [Google Scholar]
- 9. Bhan S., May W., Warren S. L., Sittman D. B. (2008) Global gene expression analysis reveals specific and redundant roles for H1 variants, H1c and H1(0), in gene expression regulation. Gene 414, 10–18 [DOI] [PMC free article] [PubMed] [Google Scholar]
- 10. Hashimoto H., Takami Y., Sonoda E., Iwasaki T., Iwano H., Tachibana M., Takeda S., Nakayama T., Kimura H., Shinkai Y. (2010) Histone H1 null vertebrate cells exhibit altered nucleosome architecture. Nucleic Acids Res. 38, 3533–3545 [DOI] [PMC free article] [PubMed] [Google Scholar]
- 11. Catez F., Yang H., Tracey K. J., Reeves R., Misteli T., Bustin M. (2004) Network of dynamic interactions between histone H1 and high-mobility-group proteins in chromatin. Mol. Cell. Biol. 24, 4321–4328 [DOI] [PMC free article] [PubMed] [Google Scholar]
- 12. Catez F., Hock R. (2010) Binding and interplay of HMG proteins on chromatin: lessons from live cell imaging. Biochim. Biophys. Acta 1799, 15–27 [DOI] [PubMed] [Google Scholar]
- 13. Bustin M., Catez F., Lim J. H. (2005) The dynamics of histone H1 function in chromatin. Mol. Cell 17, 617–620 [DOI] [PubMed] [Google Scholar]
- 14. Furusawa T., Cherukuri S. (2010) Developmental function of HMGN proteins. Biochim. Biophys. Acta 1799, 69–73 [DOI] [PMC free article] [PubMed] [Google Scholar]
- 15. Postnikov Y., Bustin M. (2010) Regulation of chromatin structure and function by HMGN proteins. Biochim. Biophys. Acta 1799, 62–68 [DOI] [PMC free article] [PubMed] [Google Scholar]
- 16. Kato H., van Ingen H., Zhou B. R., Feng H., Bustin M., Kay L. E., Bai Y. (2011) Architecture of the high mobility group nucleosomal protein 2-nucleosome complex as revealed by methyl-based NMR. Proc. Natl. Acad. Sci. U.S.A. 108, 12283–12288 [DOI] [PMC free article] [PubMed] [Google Scholar]
- 17. Ueda T., Catez F., Gerlitz G., Bustin M. (2008) Delineation of the protein module that anchors HMGN proteins to nucleosomes in the chromatin of living cells. Mol. Cell. Biol. 28, 2872–2883 [DOI] [PMC free article] [PubMed] [Google Scholar]
- 18. Cuddapah S., Schones D. E., Cui K., Roh T. Y., Barski A., Wei G., Rochman M., Bustin M., Zhao K. (2011) Genomic profiling of HMGN1 reveals an association with chromatin at regulatory regions. Mol. Cell. Biol. 31, 700–709 [DOI] [PMC free article] [PubMed] [Google Scholar]
- 19. Abuhatzira L., Shamir A., Schones D. E., Schäffer A. A., Bustin M. (2011) The chromatin-binding protein HMGN1 regulates the expression of methyl CpG-binding protein 2 (MECP2) and affects the behavior of mice. J. Biol. Chem. 286, 42051–42062 [DOI] [PMC free article] [PubMed] [Google Scholar]
- 20. Birger Y., Catez F., Furusawa T., Lim J. H., Prymakowska-Bosak M., West K. L., Postnikov Y. V., Haines D. C., Bustin M. (2005) Increased tumorigenicity and sensitivity to ionizing radiation upon loss of chromosomal protein HMGN1. Cancer Res. 65, 6711–6718 [DOI] [PMC free article] [PubMed] [Google Scholar]
- 21. Birger Y., West K. L., Postnikov Y. V., Lim J. H., Furusawa T., Wagner J. P., Laufer C. S., Kraemer K. H., Bustin M. (2003) Chromosomal protein HMGN1 enhances the rate of DNA repair in chromatin. EMBO J. 22, 1665–1675 [DOI] [PMC free article] [PubMed] [Google Scholar]
- 22. Ueda T., Furusawa T., Kurahashi T., Tessarollo L., Bustin M. (2009) The nucleosome binding protein HMGN3 modulates the transcription profile of pancreatic beta cells and affects insulin secretion. Mol. Cell. Biol. 29, 5264–5276 [DOI] [PMC free article] [PubMed] [Google Scholar]
- 23. Fuchs H., Gailus-Durner V., Adler T., Aguilar-Pimentel J. A., Becker L., Calzada-Wack J., Da Silva-Buttkus P., Neff F., Götz A., Hans W., Hölter S. M., Horsch M., Kastenmüller G., Kemter E., Lengger C., Maier H., Matloka M., Möller G., Naton B., Prehn C., Puk O., Rácz I., Rathkolb B., Römisch-Margl W., Rozman J., Wang-Sattler R., Schrewe A., Stöger C., Tost M., Adamski J., Aigner B., Beckers J., Behrendt H., Busch D. H., Esposito I., Graw J., Illig T., Ivandic B., Klingenspor M., Klopstock T., Kremmer E., Mempel M., Neschen S., Ollert M., Schulz H., Suhre K., Wolf E., Wurst W., Zimmer A., Hrabě de Angelis M. (2011) Mouse phenotyping. Methods 53, 120–135 [DOI] [PubMed] [Google Scholar]
- 24. Gailus-Durner V., Fuchs H., Adler T., Aguilar Pimentel A., Becker L., Bolle I., Calzada-Wack J., Dalke C., Ehrhardt N., Ferwagner B., Hans W., Hölter S. M., Hölzlwimmer G., Horsch M., Javaheri A., Kallnik M., Kling E., Lengger C., Mörth C., Mossbrugger I., Naton B., Prehn C., Puk O., Rathkolb B., Rozman J., Schrewe A., Thiele F., Adamski J., Aigner B., Behrendt H., Busch D. H., Favor J., Graw J., Heldmaier G., Ivandic B., Katus H., Klingenspor M., Klopstock T., Kremmer E., Ollert M., Quintanilla-Martinez L., Schulz H., Wolf E., Wurst W., de Angelis M. H. (2009) Systemic first-line phenotyping. Methods Mol. Biol. 530, 463–509 [DOI] [PubMed] [Google Scholar]
- 25. Horsch M., Schädler S., Gailus-Durner V., Fuchs H., Meyer H., de Angelis M. H., Beckers J. (2008) Systematic gene expression profiling of mouse model series reveals coexpressed genes. Proteomics 8, 1248–1256 [DOI] [PubMed] [Google Scholar]
- 26. Tusher V. G., Tibshirani R., Chu G. (2001) Significance analysis of microarrays applied to the ionizing radiation response. Proc. Natl. Acad. Sci. U.S.A. 98, 5116–5121 [DOI] [PMC free article] [PubMed] [Google Scholar]
- 27. Saeed A. I., Bhagabati N. K., Braisted J. C., Liang W., Sharov V., Howe E. A., Li J., Thiagarajan M., White J. A., Quackenbush J. (2006) TM4 microarray software suite. Methods Enzymol. 411, 134–193 [DOI] [PubMed] [Google Scholar]
- 28. Jolliffe I. (2002) Principal Component Analysis, Springer, New York [Google Scholar]
- 29. Ringnér M. (2008) What is principal component analysis? Nat. Biotechnol. 26, 303–304 [DOI] [PubMed] [Google Scholar]
- 30. Harris M. A., Clark J., Ireland A., Lomax J., Ashburner M., Foulger R., Eilbeck K., Lewis S., Marshall B., Mungall C., Richter J., Rubin G. M., Blake J. A., Bult C., Dolan M., Drabkin H., Eppig J. T., Hill D. P., Ni L., Ringwald M., Balakrishnan R., Cherry J. M., Christie K. R., Costanzo M. C., Dwight S. S., Engel S., Fisk D. G., Hirschman J. E., Hong E. L., Nash R. S., Sethuraman A., Theesfeld C. L., Botstein D., Dolinski K., Feierbach B., Berardini T., Mundodi S., Rhee S. Y., Apweiler R., Barrell D., Camon E., Dimmer E., Lee V., Chisholm R., Gaudet P., Kibbe W., Kishore R., Schwarz E. M., Sternberg P., Gwinn M., Hannick L., Wortman J., Berriman M., Wood V., de la Cruz N., Tonellato P., Jaiswal P., Seigfried T., White R. (2004) The Gene Ontology (GO) database and informatics resource. Nucleic Acids Res. 32, D258–D261 [DOI] [PMC free article] [PubMed] [Google Scholar]
- 31. Eppig J. T., Blake J. A., Bult C. J., Kadin J. A., Richardson J. E. (2012) The Mouse Genome Database (MGD): comprehensive resource for genetics and genomics of the laboratory mouse. Nucleic Acids Res. 40, D881–D886 [DOI] [PMC free article] [PubMed] [Google Scholar]
- 32. Benjamini Y., Hochberg Y. (1995) Controlling the false discovery rate: A practical and powerful approach to multiple testing. J. R. Stat. Soc. 57, 289–300 [Google Scholar]
- 33. Subramanian A., Tamayo P., Mootha V. K., Mukherjee S., Ebert B. L., Gillette M. A., Paulovich A., Pomeroy S. L., Golub T. R., Lander E. S., Mesirov J. P. (2005) Gene set enrichment analysis: a knowledge-based approach for interpreting genome-wide expression profiles. Proc. Natl. Acad. Sci. U.S.A. 102, 15545–15550 [DOI] [PMC free article] [PubMed] [Google Scholar]
- 34. Dinu I., Potter J. D., Mueller T., Liu Q., Adewale A. J., Jhangri G. S., Einecke G., Famulski K. S., Halloran P., Yasui Y. (2007) Improving gene set analysis of microarray data by SAM-GS. BMC Bioinformatics 8, 242. [DOI] [PMC free article] [PubMed] [Google Scholar]
- 35. Hock R., Scheer U., Bustin M. (1998) Chromosomal proteins HMG-14 and HMG-17 are released from mitotic chromosomes and imported into the nucleus by active transport. J. Cell Biol. 143, 1427–1436 [DOI] [PMC free article] [PubMed] [Google Scholar]
- 36. Lim J. H., Catez F., Birger Y., West K. L., Prymakowska-Bosak M., Postnikov Y. V., Bustin M. (2004) Chromosomal protein HMGN1 modulates histone H3 phosphorylation. Mol. Cell 15, 573–584 [DOI] [PubMed] [Google Scholar]
- 37. Lim J. H., West K. L., Rubinstein Y., Bergel M., Postnikov Y. V., Bustin M. (2005) Chromosomal protein HMGN1 enhances the acetylation of lysine 14 in histone H3. EMBO J. 24, 3038–3048 [DOI] [PMC free article] [PubMed] [Google Scholar]
- 38. Ueda T., Postnikov Y. V., Bustin M. (2006) Distinct domains in high mobility group N variants modulate specific chromatin modifications. J. Biol. Chem. 281, 10182–10187 [DOI] [PubMed] [Google Scholar]
- 39. Rochman M., Postnikov Y., Correll S., Malicet C., Wincovitch S., Karpova T. S., McNally J. G., Wu X., Bubunenko N. A., Grigoryev S., Bustin M. (2009) The interaction of NSBP1/HMGN5 with nucleosomes in euchromatin counteracts linker histone-mediated chromatin compaction and modulates transcription. Mol. Cell 35, 642–656 [DOI] [PMC free article] [PubMed] [Google Scholar]
- 40. Arvey A., Agius P., Noble W. S., Leslie C. (2012) Sequence and chromatin determinants of cell type-specific transcription factor binding. Genome Res. 22, 1723–1734 [DOI] [PMC free article] [PubMed] [Google Scholar]
- 41. Fuchs H., Gailus-Durner V., Adler T., Pimentel J. A., Becker L., Bolle I., Brielmeier M., Calzada-Wack J., Dalke C., Ehrhardt N., Fasnacht N., Ferwagner B., Frischmann U., Hans W., Hölter S. M., Hölzlwimmer G., Horsch M., Javaheri A., Kallnik M., Kling E., Lengger C., Maier H., Mossbrugger I., Mörth C., Naton B., Nöth U., Pasche B., Prehn C., Przemeck G., Puk O., Racz I., Rathkolb B., Rozman J., Schäble K., Schreiner R., Schrewe A., Sina C., Steinkamp R., Thiele F., Willershäuser M., Zeh R., Adamski J., Busch D. H., Beckers J., Behrendt H., Daniel H., Esposito I., Favor J., Graw J., Heldmaier G., Höfler H., Ivandic B., Katus H., Klingenspor M., Klopstock T., Lengeling A., Mempel M., Müller W., Neschen S., Ollert M., Quintanilla-Martinez L., Rosenstiel P., Schmidt J., Schreiber S., Schughart K., Schulz H., Wolf E., Wurst W., Zimmer A., Hrabé de Angelis M. (2009) The German Mouse Clinic: a platform for systemic phenotype analysis of mouse models. Curr. Pharm. Biotechnol. 10, 236–243 [DOI] [PubMed] [Google Scholar]
- 42. Kim Y. C., Gerlitz G., Furusawa T., Catez F., Nussenzweig A., Oh K. S., Kraemer K. H., Shiloh Y., Bustin M. (2009) Activation of ATM depends on chromatin interactions occurring before induction of DNA damage. Nat. Cell Biol. 11, 92–96 [DOI] [PMC free article] [PubMed] [Google Scholar]
- 43. Kurahashi T., Furusawa T., Ueda T., Bustin M. (2010) The nucleosome binding protein HMGN3 is expressed in pancreatic alpha-cells and affects plasma glucagon levels in mice. J. Cell. Biochem. 109, 49–57 [DOI] [PMC free article] [PubMed] [Google Scholar]
- 44. Roberts B., DiTullio P., Vitale J., Hehir K., Gordon K. (1992) Cloning of the goat β-casein-encoding gene and expression in transgenic mice. Gene 121, 255–262 [DOI] [PubMed] [Google Scholar]
- 45. Hassan M. I., Waheed A., Yadav S., Singh T. P., Ahmad F. (2008) Zinc α2-glycoprotein: a multidisciplinary protein. Mol. Cancer Res. 6, 892–906 [DOI] [PubMed] [Google Scholar]
- 46. Pash J., Popescu N., Matocha M., Rapoport S., Bustin M. (1990) Chromosomal protein HMG-14 gene maps to the Down syndrome region of human chromosome 21 and is overexpressed in mouse trisomy 16. Proc. Natl. Acad. Sci. U.S.A. 87, 3836–3840 [DOI] [PMC free article] [PubMed] [Google Scholar]
- 47. Berto G., Camera P., Fusco C., Imarisio S., Ambrogio C., Chiarle R., Silengo L., Di Cunto F. (2007) The Down syndrome critical region protein TTC3 inhibits neuronal differentiation via RhoA and Citron kinase. J. Cell Sci. 120, 1859–1867 [DOI] [PubMed] [Google Scholar]
- 48. Gao Z., Ure K., Ables J. L., Lagace D. C., Nave K. A., Goebbels S., Eisch A. J., Hsieh J. (2009) Neurod1 is essential for the survival and maturation of adult-born neurons. Nat. Neurosci. 12, 1090–1092 [DOI] [PMC free article] [PubMed] [Google Scholar]
- 49. Schmidt M. H., Bicker F., Nikolic I., Meister J., Babuke T., Picuric S., Müller-Esterl W., Plate K. H., Dikic I. (2009) Epidermal growth factor-like domain 7 (EGFL7) modulates Notch signalling and affects neural stem cell renewal. Nat. Cell Biol. 11, 873–880 [DOI] [PubMed] [Google Scholar]
- 50. Schumacher T., Krohn M., Hofrichter J., Lange C., Stenzel J., Steffen J., Dunkelmann T., Paarmann K., Fröhlich C., Uecker A., Plath A. S., Sommer A., Brüning T., Heinze H. J., Pahnke J. (2012) ABC transporters B1, C1 and G2 differentially regulate neuroregeneration in mice. PLoS One 7, e35613. [DOI] [PMC free article] [PubMed] [Google Scholar]
- 51. Sun M., Ma L., Xu L., Li J., Zhang W., Petrovics G., Makarem M., Sesterhenn I., Zhang M., Blanchette-Mackie E. J., Moul J., Srivastava S., Zou Z. (2002) A human novel gene DERPC on 16q22.1 inhibits prostate tumor cell growth and its expression is decreased in prostate and renal tumors. Mol. Med. 8, 655–663 [PMC free article] [PubMed] [Google Scholar]
- 52. Ogawa R., Ishiguro H., Kuwabara Y., Kimura M., Mitsui A., Mori Y., Mori R., Tomoda K., Katada T., Harada K., Fujii Y. (2008) Identification of candidate genes involved in the radiosensitivity of esophageal cancer cells by microarray analysis. Dis. Esophagus 21, 288–297 [DOI] [PubMed] [Google Scholar]
- 53. Schwarz D. A., Katayama C. D., Hedrick S. M. (1998) Schlafen, a new family of growth regulatory genes that affect thymocyte development. Immunity 9, 657–668 [DOI] [PubMed] [Google Scholar]
- 54. Milde-Langosch K. (2005) The Fos family of transcription factors and their role in tumourigenesis. Eur. J. Cancer 41, 2449–2461 [DOI] [PubMed] [Google Scholar]
- 55. Kusakabe M., Kutomi T., Watanabe K., Emoto N., Aki N., Kage H., Hamano E., Kitagawa H., Nagase T., Sano A., Yoshida Y., Fukami T., Murakawa T., Nakajima J., Takamoto S., Ota S., Fukayama M., Yatomi Y., Ohishi N., Takai D. (2010) Identification of G0S2 as a gene frequently methylated in squamous lung cancer by combination of in silico and experimental approaches. Int. J. Cancer 126, 1895–1902 [DOI] [PubMed] [Google Scholar]
- 56. Ito Y., Bustin M. (2002) Immunohistochemical localization of the nucleosome-binding protein HMGN3 in mouse brain. J. Histochem. Cytochem. 50, 1273–1275 [DOI] [PubMed] [Google Scholar]
- 57. West K. L., Ito Y., Birger Y., Postnikov Y., Shirakawa H., Bustin M. (2001) HMGN3a and HMGN3b, two protein isoforms with a tissue-specific expression pattern, expand the cellular repertoire of nucleosome-binding proteins. J. Biol. Chem. 276, 25959–25969 [DOI] [PubMed] [Google Scholar]
- 58. Amano T., Leu K., Yoshizato K., Shi Y. B. (2002) Thyroid hormone regulation of a transcriptional coactivator in Xenopus laevis: implication for a role in postembryonic tissue remodeling. Dev. Dyn. 223, 526–535 [DOI] [PubMed] [Google Scholar]
- 59. Mountjoy K. G. (2010) Functions for pro-opiomelanocortin-derived peptides in obesity and diabetes. Biochem. J. 428, 305–324 [DOI] [PubMed] [Google Scholar]
- 60. Du K., Herzig S., Kulkarni R. N., Montminy M. (2003) TRB3: a tribbles homolog that inhibits Akt/PKB activation by insulin in liver. Science 300, 1574–1577 [DOI] [PubMed] [Google Scholar]
- 61. Okamoto H., Latres E., Liu R., Thabet K., Murphy A., Valenzeula D., Yancopoulos G. D., Stitt T. N., Glass D. J., Sleeman M. W. (2007) Genetic deletion of Trb3, the mammalian Drosophila tribbles homolog, displays normal hepatic insulin signaling and glucose homeostasis. Diabetes 56, 1350–1356 [DOI] [PubMed] [Google Scholar]
- 62. Bergboer J. G., U.-M., Fransen J., den Heijer M., Franke B., van Riel P. L., Schalkwijk J., Coenen M. J. (2012) A replication study of the association between rheumatoid arthritis and deletion of the late cornified envelope genes LCE3B and LCE3C. PLoS One 7, e32045. [DOI] [PMC free article] [PubMed] [Google Scholar]
- 63. Novy M., Pohn R., Andorfer P., Novy-Weiland T., Galos B., Schwarzmayr L., Rotheneder H. (2005) EAPP, a novel E2F binding protein that modulates E2F-dependent transcription. Mol. Biol. Cell 16, 2181–2190 [DOI] [PMC free article] [PubMed] [Google Scholar]
- 64. Cejkova P., Zettl A., Baumgärtner A. K., Chott A., Ott G., Müller-Hermelink H. K., Starostik P. (2005) Amplification of NOTCH1 and ABL1 gene loci is a frequent aberration in enteropathy-type T-cell lymphoma. Virchows Arch. 446, 416–420 [DOI] [PubMed] [Google Scholar]
- 65. Snape K., Hanks S., Ruark E., Barros-Núñez P., Elliott A., Murray A., Lane A. H., Shannon N., Callier P., Chitayat D., Clayton-Smith J., Fitzpatrick D. R., Gisselsson D., Jacquemont S., Asakura-Hay K., Micale M. A., Tolmie J., Turnpenny P. D., Wright M., Douglas J., Rahman N. (2011) Mutations in CEP57 cause mosaic variegated aneuploidy syndrome. Nat. Genet. 43, 527–529 [DOI] [PMC free article] [PubMed] [Google Scholar]
- 66. Postnikov Y. V., Trieschmann L., Rickers A., Bustin M. (1995) Homodimers of chromosomal proteins HMG-14 and HMG-17 in nucleosome cores. J. Mol. Biol. 252, 423–432 [DOI] [PubMed] [Google Scholar]
- 67. Lim J. H., Bustin M., Ogryzko V. V., Postnikov Y. V. (2002) Metastable macromolecular complexes containing high mobility group nucleosome-binding chromosomal proteins in HeLa nuclei. J. Biol. Chem. 277, 20774–20782 [DOI] [PubMed] [Google Scholar]
- 68. Postnikov Y. V., Kurahashi T., Zhou M., Bustin M. (2012) The nucleosome binding protein HMGN1 interacts with PCNA and facilitates its binding to chromatin. Mol. Cell. Biol. 32, 1844–1854 [DOI] [PMC free article] [PubMed] [Google Scholar]