Abstract
In the model of Huh-7.5.1 hepatocyte cells infected by the JFH1 hepatitis C virus (HCV) strain, transcriptomic and proteomic studies have revealed modulations of pathways governing mainly apoptosis and cell cycling. Differences between transcriptomic and proteomic studies pointed to regulations occurring at the posttranscriptional level, including the control of mRNA translation. In this study, we investigated at the genome-wide level the translational regulation occurring during HCV infection. Sucrose gradient ultracentrifugation followed by microarray analysis was used to identify translationally regulated mRNAs (mRNAs associated with ribosomes) from JFH1-infected and uninfected Huh-7.5.1 cells. Translationally regulated mRNAs were found to correspond to genes enriched in specific pathways, including vesicular transport and posttranscriptional regulation. Interestingly, the strongest translational regulation was found for mRNAs encoding proteins involved in pre-mRNA splicing, mRNA translation, and protein folding. Strikingly, these pathways were not previously identified, through transcriptomic studies, as being modulated following HCV infection. Importantly, the observed changes in host mRNA translation were directly due to HCV replication rather than to HCV entry, since they were not observed in JFH1-infected Huh-7.5.1 cells treated with a potent HCV NS3 protease inhibitor. Overall, this study highlights the need to consider, beyond transcriptomic or proteomic studies, the modulation of host mRNA translation as an important aspect of HCV infection.
INTRODUCTION
Hepatitis C virus (HCV) chronically infects about 170 million people worldwide and is associated with an elevated risk of cirrhosis and hepatocellular carcinoma. HCV replication and viral protein expression lead to differential expression of host genes as determined by microarray or proteomic studies (1–3). A breakthrough in HCV research was the discovery of an HCV strain, JFH1, capable of replicating efficiently and of producing viral particles in cultured cells (4–6). In this in vitro model of HCV infection, transcriptomic analyses revealed regulation of the expression of genes involved in apoptosis and cell cycle arrest (7–10), while proteomic studies identified numerous perturbations in the metabolism of phospholipids and sphingomyelins that are predicted to play important roles in viral replication, assembly, and secretion (11). This suggests that important differences exist between the HCV-regulated transcriptome and proteome that may rely on the differential stability of proteins and/or on gene expression regulation at the mRNA translation level, the process by which proteins are synthesized from existing mRNAs. Indeed, regulation of mRNA translation has been shown to be involved in the differences observed between the amounts of specific mRNAs and their corresponding proteins (12, 13).
This prompted us to analyze regulation of mRNA translation on a genome-wide scale during HCV infection.
MATERIALS AND METHODS
Cell culture and viral infection.
Huh-7.5.1 cells (a kind gift from Francis V. Chisari) were grown in Dulbecco's modified Eagle's medium (Invitrogen, Cergy Pontoise, France) supplemented with 10 mM HEPES, nonessential amino acids (Invitrogen), 2 mM l-glutamine (Invitrogen), and 10% heat-inactivated fetal calf serum (PAA Laboratories, Pasching, Austria). High-titer stocks of JFH1 were prepared as previously described (14).
A total of 1.5 × 10⁶ cells of Huh-7.5.1 cells per 75-cm2 flask were seeded and were inoculated the next day with JFH1 at a multiplicity of infection of 1 or with conditioned medium a as control (referred to as noninfected cells; 4 replicates). After incubation for 6 h at 37°C, the inoculum was removed and the cells were washed and then cultured for 3 days in complete medium containing either 0.01% dimethyl sulfoxide as the carrier control (referred to as infected cells; 4 replicates) or an inhibitor of an HCV serine protease similar to telaprevir (a gift from Vivalis, Saint-Herblain, France) at 1,000 nM (referred to as infected-treated cells; 3 replicates). These conditions resulted in more than 90% of cells being infected at the time of harvest, as shown by immunofluorescence analysis. Infectivity titers were determined by focus formation assay.
Percentages of infected cells were evaluated by immunofluorescence analysis. After fixation of the cells in acetone-methanol (1:1, vol/vol) for 10 min at room temperature, permeabilization and blocking were achieved by 1 h of incubation in phosphate-buffered saline (PBS) containing 0.1% Triton X-100 and 1% bovine serum albumin, and all subsequent steps were performed in this buffer at room temperature. Cells were incubated for 1 h with sera from HCV-seropositive nonviremic patients as the primary antibody. After extensive washing, cells were incubated for 1 h with Cy3-conjugated anti-human IgG (Jackson ImmunoResearch Laboratories). Finally, cells were counterstained with 4′,6-diamidino-2-phenylindole (DAPI) and observed under an inverted fluorescence microscope.
Infectivity titers were determined by focus formation assay as previously described (15).
Sucrose gradient fractionation.
After 3 days of culture, infected, noninfected, and infected-treated cells were incubated in PBS containing 100 μg/ml of cycloheximide (Sigma-Aldrich, St. Louis, MO) for 15 min at 37°C, in order to stop ribosomal elongation. After being washed, the cells were scraped and harvested by centrifugation. The pellets were resuspended in 1 ml of LSB buffer (10 mM Tris-HCl [pH 7.5], 100 mM NaCl, 3 mM MgCl2, 1 mM dithiothreitol [DTT], 0.1 mg/ml of cycloheximide, and 100 U/ml of RNasin) and lysed by adding LSB buffer containing 0.2% Triton X-100 and 0.25 M sucrose. The lysates were centrifuged (12,000 × g for 5 min at 4°C), and the supernatants were recovered and then layered on 15% to 40% sucrose gradients. The gradients were ultracentrifuged (38,000 × g for 2 h at 4°C), and 17 fractions were collected with a fraction collector (Pharmacia LKB, OR) (Fig. 1).
Fig 1.
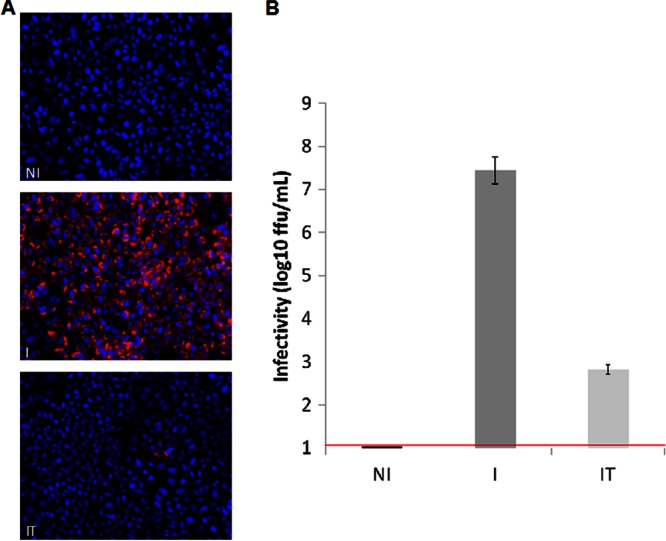
Virological analysis of infected, noninfected, and infected-treated cells. Huh-7.5.1 cells were either left noninfected (NI) or infected with JFH1 and then left untreated (I) or treated with an inhibitor of the HCV serine protease (IT). (A) Infected cells were visualized by immunofluorescence analysis with sera from HCV-seropositive nonviremic patients as the primary antibody (red). Cells were counterstained with DAPI to show the locations of nuclei (blue). (B) Infectivity titers of culture supernatants were determined by focus formation assay. The threshold of detection of the assay is indicated by a red line. Data are shown as means and standard errors of the means of the infectivity titers determined in three or four independent experiments. ffu, focus-forming units.
RNA extraction.
Fractions 1 to 7, corresponding to nonpolysomal RNA, and fractions 8 to 17, corresponding to polysomal RNA, were each pooled. RNA from the pools and from an aliquot of nonfractionated supernatant (total cytosolic RNA) were then extracted with TRIzol and precipitated with isopropanol (Sigma). The quality of total and fractioned RNAs was checked on an Agilent 2100 bioanalyzer.
Microarray hybridization.
cDNA synthesis and cRNA amplification were performed with an Agilent kit (low-RNA-input linear amplification kit, two colors). Cy3- and Cy5-labeled cRNAs at 500 ng each were mixed and hybridized on an Agilent 4×44K microarray slide.
MicroRNA (miRNA) expression analysis was performed with Agilent human microRNA 8×15K v2 microarrays. RNA samples were labeled with cyanine-3 (Agilent one-color labeling kit) and were hybridized according to the manufacturer's protocol.
Data analysis.
The data from the 33 cDNA microarray experiments were normalized with the Lowess algorithm, and the data from the 7 microRNA microarrays were normalized with the quantile method (R software).
PCA.
Principal-component analysis (PCA) transforms data to a new coordinate system such that the greatest variance lies on the first coordinate (called the first principal component) and the second-greatest variance lies on the second coordinate. PCA was performed with the FactoMineR package (http://factominer.free.fr/).
Hierarchical clustering.
The log and median-centered expression data were submitted to centroid-linkage hierarchical clustering using Cluster 3.0 software, and the clusters were visualized with Java Treeview.
Identification of regulated genes.
Selection of transcriptionally regulated genes for analysis was based on a >95% probability of being differentially expressed (Student's t test, P < 0.05) and a fold change of 2 or more between infected and noninfected cells.
Translationally regulated genes are classically selected by comparing, for each mRNA, the log ratio of polysomal to cytosolic RNA. Accordingly, log ratios do not effectively correct for cytosolic mRNA level and generate substantial numbers of biological false positives and false negatives. The phenomenon of a difference score (Y − Z) correlating with each of its terms (Y and Z) was first described by Pearson in 1897 (16). We used a method named ANOTA recently developed to correct this bias, based on analysis of partial variance (APV). In ANOTA, a common slope for all sample categories is identified for each gene from the least-squares linear regression of translational activity data on cytosolic mRNA data. Class comparison effects are estimated by calculating differences between sample category intercepts; the sum-of-squares error for these comparisons is reduced by the sum of squares associated with the covariance between the translational activity data and the cytosolic mRNA data. The ANOTA method is implemented with the anota R package (17). Genes with an APV P value of <0.05 were considered translationally regulated, and genes with unrealistic slopes (slope < 0.01 or > 2) were filtered out.
Regulated microRNAs were selected by using Student's t test (P < 0.05) to compare infected and noninfected cells; only miRNAs for which a significant number of the 16 replicate probes were significantly regulated were considered (χ2 test, P < 0.005).
Functional annotation.
Biological overrepresentation analysis of the significantly transcriptionally or translationally modified genes was performed with the Panther classification system implemented with DAVID software (18). This ontologic classification system eliminates redundant terms and summarizes functional categories. KEGG pathway analysis in DAVID was also used to gain access to more specific processes. Biological processes with an EASE score of <0.05 (modified Fisher's exact test) were selected.
Search for RNA motifs.
Untranslated region (UTR) sequences were obtained from a gene database retrieved from http://genome.ucsc.edu/. The UTRscan tool of the ITBtools package, identifying 46 motifs in UTR sequences known to be involved in translational regulation, was used to detect RNA motifs in the 5′ and 3′ UTRs. Overrepresented motifs in the transcriptionally and translationally regulated genes compared to the rest of the microarray genes were identified with Fisher's exact test (P < 0.05). MiRonTop software (19) was used to identify miRNA target enrichment in a group of transcriptionally and translationally regulated genes versus the other microarray genes (Fisher's exact test with Benjamini correction, P < 0.05).
Quantitative RT-PCR.
Reverse transcription-quantitative PCR (RT-qPCR) was used to validate changes in gene expression detected with microarrays. RNA samples were treated with DNase I (Invitrogen) and reverse transcribed with random hexamer primers (Invitrogen) and the Superscript First-Strand Synthesis System RT-PCR kit (Invitrogen). TaqMan real-time quantitative PCR assays were performed in duplicate using 96-well microfluidic cards on an ABI Prism 7900 sequence detection system (Applied Biosystems, Carlsbad, CA). mRNA normalization used ACTB, this gene being invariant in our microarray.
Microarray data accession number.
Microarray data obtained in this study are available under GEO accession number is GS44210.
RESULTS
HCV infection occurred in most inoculated cells.
Under the conditions we used, infection resulted in more than 90% of cells being infected at the time of harvest, as shown by immunofluorescence analysis (Fig. 1A). Treatment of infected cells with the HCV NS3 protease inhibitor resulted in a drastic reduction in the percentage of infected cells, correlating with a 99.9% reduction in infectivity titer (Fig. 1B).
HCV infection has a widespread effect on host gene mRNA translation.
To analyze mRNA translation, we isolated ribosome-bound mRNAs engaged. As ribosomes are involved in protein synthesis, this approach directly reflects the translational state of mRNA species. Experiments were performed on JFH1-infected Huh-7.5.1 cells and noninfected cells. Experiments were also done in JFH1-infected Huh-7.5.1 cells treated with a potent HCV NS3 protease inhibitor to allow us to determine whether the observed changes were directly due to HCV replication rather than to HCV entry.
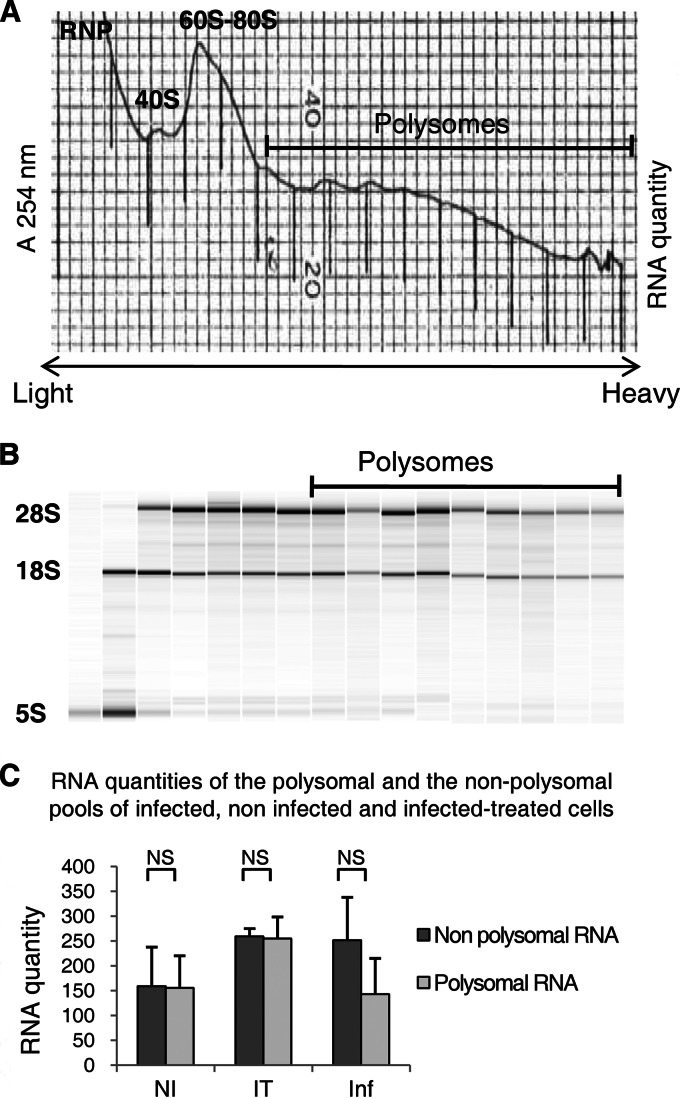
Ribosome-associated mRNAs were separated from cytosolic mRNA by sucrose gradient ultracentrifugation. RNA extracted from (i) fractions corresponding to RNA bound to more than one ribosome (polysomal RNA), (ii) fractions corresponding to RNAs present in RNPs, 40S, 60S, and 80S ribosomal complexes (nonpolysomal RNA) (Fig. 2A and B), and (iii) RNA extracted from the same cell lysates before sucrose fractionation (total RNA) were subjected to microarray analysis.
Fig 2.
Polysomal fractionation of infected, noninfected, and infected-treated cell lysates. (A) The absorbance at 254 nm was monitored during collection of the 17 fractions from the sucrose gradient of infected cell lysates. (B) The analysis of RNA extracted from each fraction of an infected cell sample was performed on an Agilent bioanalyzer, allowing the visualization of the 28S and 18S rRNAs. (C) RNA quantities extracted from the polysomal and nonpolysomal pools of infected (I), noninfected (NI), and infected-treated (IT) cells. The quantities of polysomal and free RNAs were nonsignificantly (NS) different (Student's t test) in infected, noninfected, and infected-treated cells.
Of note, the quantities of nonpolysomal and polysomal RNAs (Fig. 2C) were not significantly different between JFH1-infected, noninfected, and infected-treated Huh-7.5.1 cells, reflecting the lack of a general effect of HCV infection on mRNA translation.
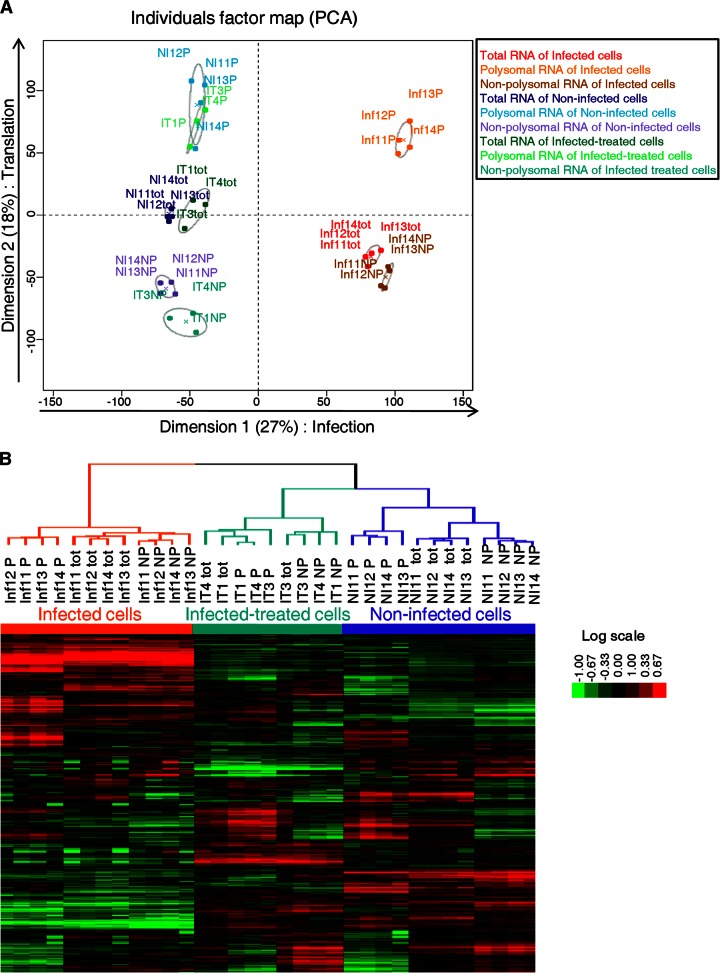
Principal-component analysis (PCA) was used to visualize trends across RNA data sets (Fig. 3A). The first dimension corresponds to genes modulated by HCV infection. The polysomal, nonpolysomal, and total RNAs of infected-treated cells were similar to those of noninfected cells. The second dimension revealed that the polysomal RNA data set was markedly different from the nonpolysomal and total RNA data sets, revealing a widespread regulation of mRNA translation during HCV infection. Hierarchical clustering of all the samples confirmed the two dimensions of PCA (Fig. 3B).
Fig 3.
Global analysis of mRNA levels in total, polysomal, and nonpolysomal RNAs from infected, noninfected, and infected-treated cells. (A) PCA plot of the microarray results for the 33 RNA samples. PCA was performed using the FactoMineR package. Separation along dimension 1 corresponds to infection status and separation along dimension 2 to translation status. This shows marked changes in the total (tot), polysomal (P), and nonpolysomal (NP) RNAs of cells undergoing productive infection. The polysomal fraction is very different from the total RNA fraction, whereas the nonpolysomal fraction is similar to it. (B) Hierarchical clustering of the 33 RNA samples analyzed on microarrays was performed with cluster or Java Treeview software. On the heat map, the rows represent the mRNA quantitation data (log transformed and median centered), and the columns represent the RNA samples.
HCV-dependent regulation of mRNA translation.
During JFH1 infection, 1,341 unique transcripts were identified as being transcriptionally regulated (623 downregulated and 718 upregulated).
Using the ANOTA method, based on analysis of partial variance (APV) to identify genes with uncorrelated polysomal and cytosolic RNA levels (17), 2,107 mRNAs were identified as being translationally regulated (843 downregulated and 1,264 upregulated). Only 764 (36%) could be identified with the log ratio method (data not shown). This rate of discrepancies between the two analysis methods was already noted in other published data sets (17). Of these 2,107 translationally regulated mRNAs, 455 (22%) underwent transcriptional regulation. This was in the same direction as translational regulation for 440 of them (97%):180 were downregulated and 260 were upregulated.
A subset of 10 genes was randomly chosen to confirm the microarray results by real-time PCR. The results of RNA quantification in cytosolic and polysomal RNAs by the two techniques were consistent. As expected, the fold changes were higher with qPCR (Fig. 4).
Fig 4.
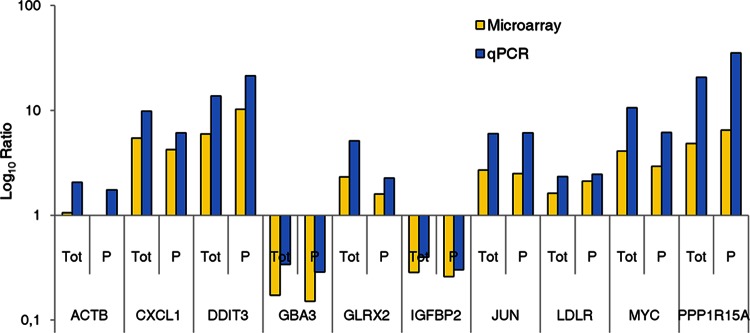
Validation of microarray by qPCR of selected genes. A subset of 10 genes was randomly chosen to confirm the microarray results by real-time PCR. Log ratios indicate changes observed in total (Tot) and polysomal (P) mRNAs during infection (compared to noninfected controls). The results of mRNA quantification by the two techniques were consistent. As expected, the fold changes were higher with qPCR.
To ascertain that changes in the presence of mRNAs in polysomes were associated with changes in the presence of the corresponding proteins, we retrieved a list of 765 proteins found to be regulated after 72 h of infection in the JFH1 model, published by Diamond et al. (20) and for which mRNA levels were measured in our data sets. The fold changes in the proteomic data set of Diamond et al. were strongly correlated to the ANOTA classification as shown in Fig. 5. The latter correlation observed with the ANOTA-identified genes was not observed by using the log ratio method.
Fig 5.
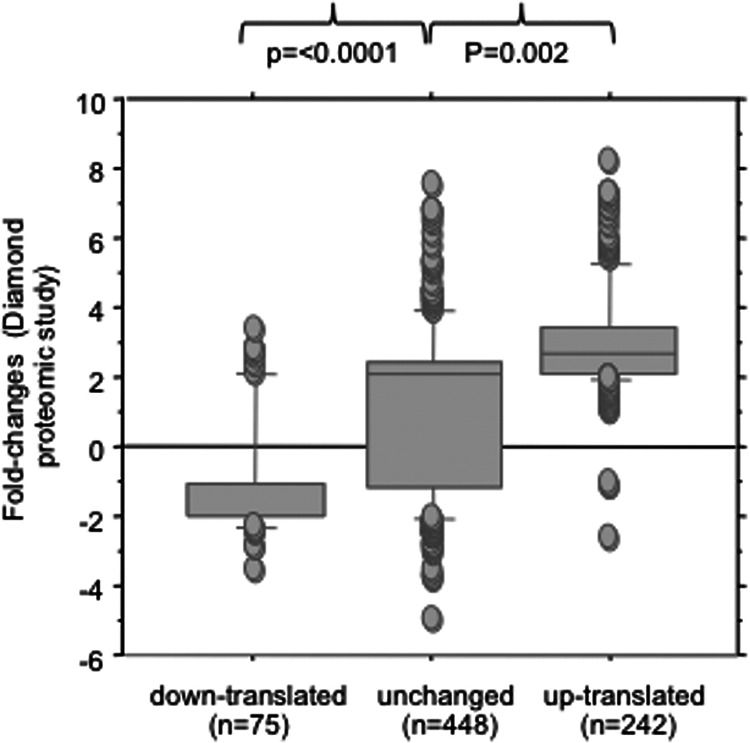
Correlation between proteomic fold changes determined in the data set of Diamond et al. (20) and the ANOTA classification of genes. In the study of Diamond et al., proteomic fold changes of 765 cellular proteins were measured under the same experimental conditions as in the present study, after 3 days of infection of Huh7 cells by JFH1.
Together, these data demonstrate that many mRNAs, some of which were validated by real-time PCR and/or correlated at the protein level from an independent data set (that of Diamond et al.), were translationally regulated following HCV infection. This prompted us to subsequently analyze the functions of the corresponding genes.
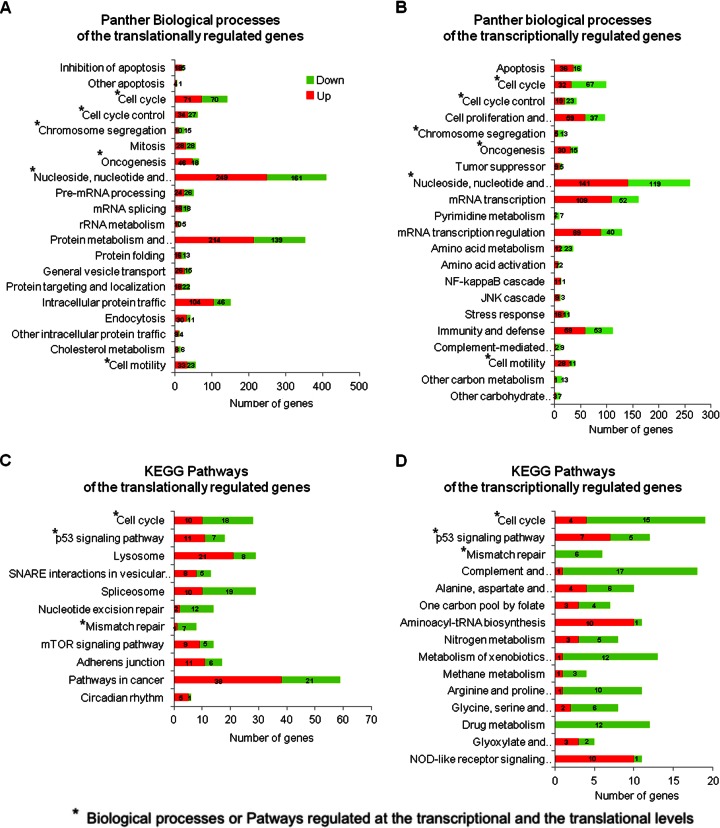
Gene annotation and GO term enrichment analysis were performed with the DAVID functional annotation tool (18). We compared the ontogeny obtained with the data set of transcriptionally regulated genes and the data set of genes regulated at the mRNA translation level identified by ANOTA. Genes involved in cell cycling, apoptosis, and oncogenesis were identified in both data sets. However, the transcriptionally regulated genes (1,341 transcripts; 623 downregulated and 718 upregulated) were specifically involved in apoptosis, amino acid metabolism, nucleic acid metabolism (transcription and pyrimidine metabolism), immunity and host defense (stress response and complement-mediated immunity), Jun N-terminal protein kinase (JNK) cascade, and NF-κB cascade (Fig. 6A and B), and the genes undergoing regulation at the mRNA translation level were specifically involved in protein metabolism and modification, mRNA processing, mRNA translation, intracellular protein traffic, the mTOR signaling pathway, adherens junctions, vesicular transport, and the spliceosome (Fig. 6C and D).
Fig 6.
DAVID functional annotation of transcriptionally and translationally regulated genes. The translationally (anota) and transcriptionally (Student's t test, P < 0.005, and fold change of >2 in cytosolic RNA) regulated genes were annotated with the Panther gene ontology and KEGG pathway using DAVID software. (A) Panther biological processes significantly associated (Fisher's modified test, P < 0.05) with translationally regulated genes. (B) Panther biological processes significantly associated (Fisher's modified test, P < 0.05) with transcriptionally regulated genes. (C) KEGG pathways significantly associated (Fisher's modified test, P < 0.05) with translationally regulated genes. (D) KEGG pathways significantly associated (Fisher's modified test, P < 0.05) with transcriptionally regulated genes. The plots reflect the number of genes in the process. The number of upregulated genes is represented in red, and the number of downregulated genes is in green.
Main biological processes regulated by HCV at the translational level. (i) Intracellular protein traffic and vesicular transport.
Several genes encoding Rab GTPases, which regulate many steps of membrane trafficking, were regulated at the translational level. Some genes coding for proteins engaged in vesicle transport along the cytoskeleton were regulated, including proteins belonging to the kinesin, dynein, and tubulin families. These genes, involved in endocytosis and protein trafficking, are also involved in the endocytosis of HCV particles and in viral replication (21, 22). TP6V0A1, a gene involved in endosomal acidification, which is important for the fusion of HCV and cell membranes, was upregulated.
Redistribution of lipid droplets, essential for HCV particle assembly (23), depends on dynein and microtubules. The SNARE proteins have a role in lipid droplet biogenesis (24), and HCV NS5A interacts with a SNARE-like protein, VAPA, which is necessary for HCV replication (25, 26) and was downregulated.
(ii) Pre-mRNA processing.
The expression of several heterogeneous ribonucleoproteins (HNRPDL, HNRNPA0, HNRNPA1L2, and HNRNPL) involved in pre-mRNA splicing, mRNA transport, and mRNA translation was regulated.
mRNA abundance is regulated by KHSRP (also called KSRP) and ELAVL1 (downregulated), which interact with AU-rich element (ARE)-containing mRNAs. KHSRP also serves as a component of both Drosha and Dicer complexes, suggesting that the miRNA system could be affected during HCV infection (27). The adenosine deaminase ADAR1, an interferon-inducible protein involved in RNA editing that has been shown to inhibit HCV expression (28), was upregulated. Finally, Dicer was downregulated both transcriptionally and translationally.
(iii) Protein synthesis.
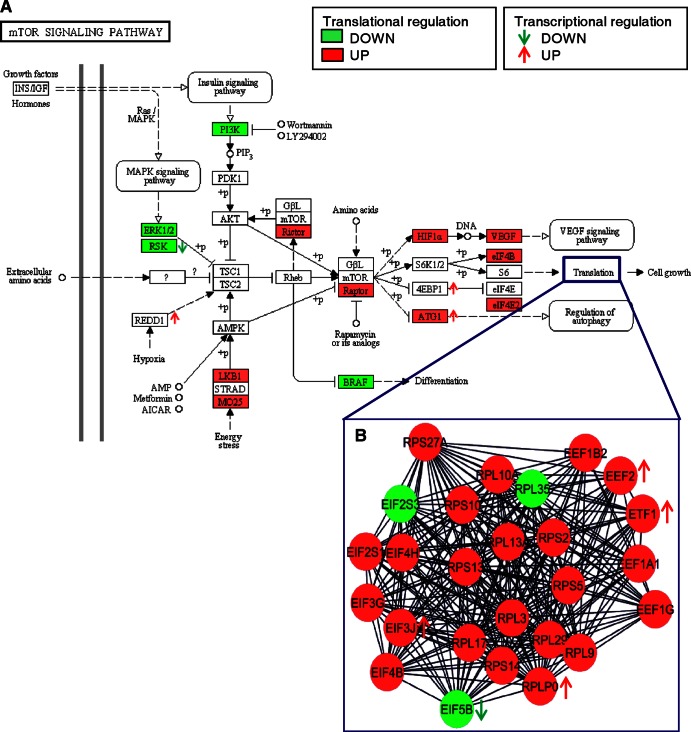
Several translation initiation and elongation factors, ribosomal proteins, were upregulated (Fig. 7B). PPP1R15A, which recruits the serine/threonine protein phosphatase PP1 to dephosphorylate the translation initiation factor eIF-2A/EIF2S1, thus increasing mRNA translation, was upregulated. Seven cytoplasmic tRNA synthetases, three mitochondrial tRNA synthetases, and the methionyl-tRNA synthetase, which indirectly participate in mRNA translation, were regulated.
Fig 7.
Translation regulation of the mTOR signaling pathway and translation process. (A) Representation of the mTOR signaling KEGG pathway, significantly associated with translationally regulated genes. The translationally upregulated genes are shown in red and the translationally downregulated genes in green. The direction of transcriptional regulation (P < 0.05, fold change > 2) is indicated by arrows beside the gene names. (B) Representation of the network of interactions between the translationally regulated proteins related to translation (obtained with Cytoscape and the MiMI plugin). As for the KEGG pathway, the translationally upregulated genes are shown in red and the translationally downregulated genes in green, and potential transcriptional regulations are indicated by arrows beside the circles.
Some of these factors are also involved in HCV translation. HCV RNA is a noncapped, nonpolyadenylated RNA whose translation and replication are regulated by its 5′ and 3′ UTRs. EIF4B, DDX3, and ILF3 (29), which facilitate translation of the HCV genome (30, 31), were upregulated. ELAVL1 (HuR) and IGF2BP1, which were downregulated, bind to the 3′ UTR of HCV RNA (32), thus facilitating viral internal ribosome entry site (IRES)-dependent translation (33, 34) and viral replication for HuR (35, 36).
The mTOR signaling pathway is related to translation processes and is of particular interest (Fig. 7A). Both rapamycin-insensitive companion of mTOR (RICTOR) and RAPTOR, which is an essential scaffold for mTOR-catalyzed phosphorylation of 4EBP1, were upregulated, whereas phosphatidylinositol 3-kinase (PI3K) was downregulated. These effects may contribute to the establishment of persistent HCV infection, since PI3K and mTOR inhibition enhances HCV replication (37). Recently, NS5A protein has been shown to bind to the mRNA cap-binding eukaryotic translation initiation 4F (eIF4F) complex and to upregulate host translation (38).
(iv) Protein folding.
Several cochaperone proteins of the DNAJ protein family, which regulate the heat shock proteins HSP70 and HSP90 involved in HCV replication via NS3 viral protein (39), were upregulated, of which DNAJB1 is necessary for HCV replication (40). Several members of the immunophilin protein family, cis-trans prolyl isomerases that accelerate protein folding, were downregulated (FKBP5, FKBP7, FKBP3, FKBP9, FKBP1B, and FKBP1A), while cyclophilin B, which stimulates the function of the HCV RNA polymerase NS5B (41), was upregulated. Calnexin (CANX), which may be involved in folding the HCV E1 and E2 glycoproteins (42), was upregulated.
RNA motifs overrepresented in the 3′ UTR sequences of upregulated genes.
RNA motifs, known to mediate translational regulation, in the 3′ and 5′ UTR sequences of translationally regulated genes were sought with UTRscan; results showed that 7 motifs were overrepresented in translationally regulated mRNAs (Fisher's exact test, P < 0.05) (Table 1). However, these motifs were represented in less than 1% of the regulated genes.
Table 1.
RNA motifs overrepresented in the UTRs of translationally up- or downregulated genes
| UTR and motif | % of genes harboring motif |
P value |
% of total | |||
|---|---|---|---|---|---|---|
| Downregulated | Upregulated | Nonregulated | Downregulated genes | Upregulated genes | ||
| 3′ UTR | ||||||
| ARE2 | 0.008 | 0.008 | 0.005 | 0.11 | 0.047 | |
| SXL-BS | 0.17 | 0.18 | 0.15 | 0.027 | 0.0013 | |
| UNR-BS | 0.13 | 0.12 | 0.11 | 0.036 | 0.062 | |
| BRD-BOX | 0.11 | 0.14 | 0.11 | 0.69 | 0.006 | |
| GY-BOX | 0.09 | 0.14 | 0.10 | 0.27 | <0.0001 | |
| MBE | 0.68 | 0.66 | 0.62 | 0.0007 | 0.004 | |
| 5′ UTR | ||||||
| uORF | 0.26 | 0.34 | 0.15 | <0.0001 | 0.28 | |
No significant miRNA target enrichment was found for the translationally downregulated mRNAs using MiRonTop software. In contrast, the translationally upregulated mRNAs presented a significant enrichment in the predicted binding sites of 63 miRNAs (see Table S1 in the supplemental material).
To check if a change in the abundance of these 63 miRNAs could be responsible for the observed translational upregulations, we used miRNA microarrays on total RNA from infected or noninfected cells. Strikingly, these 63 miRNAs were either absent or present at low levels in total RNA, suggesting that the translational upregulations occurred mostly for the mRNAs that were not repressed by their targeting microRNAs. Of note, we found that only 10 miRNAs (but none of the 63 MiRonTop-predicted miRNAs) were weakly regulated in our infection model (Fig. 8 and Table 2). The GEO accession number for reference miRNA is GSE44370.
Fig 8.
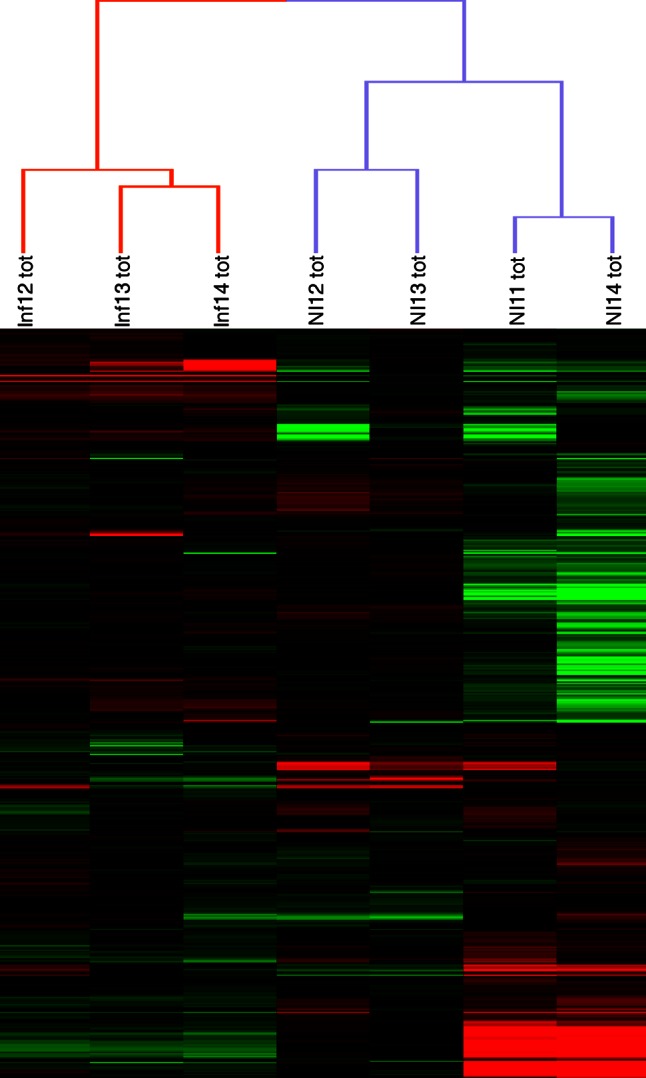
Hierarchical clustering of the infected and noninfected samples analyzed on miRNA microarrays. On the heat map, the rows represent the miRNA quantitation data (log transformed and median centered), and the columns represent the RNA samples.
Table 2.
miRNAs significantly regulated in total RNA during JFH1 infection
| microRNA | χ2 P value | Mean fold change | Reference(s) |
|---|---|---|---|
| hsa-miR-23a | 1.79936E−20 | 1.5 | |
| hsa-miR-1202 | 2.81713E−15 | 0.7 | |
| hsa-miR-638 | 4.57338E−13 | 1.1 | 8 |
| hsa-miR-22 | 5.54134E−13 | 1.6 | |
| hsa-miR-331-3p | 2.24012E−08 | 1.1 | |
| hsa-miR-130a | 2.61858E−07 | 0.9 | 43, 44 |
| hsa-miR-151-5p | 5.20543E−06 | 1.1 | |
| hsa-miR-122 | 0.000160556 | 0.7 | 43, 45 |
| hsa-miR-23b | 0.002023828 | 1.3 | 44 |
| hsa-miR-27a | 0.020427343 | 1.2 |
DISCUSSION
This study is the first genome-wide translation profiling of the Huh-7.5.1 cell line infected by hepatitis C virus strain JFH1. In this model, in which almost all cells are infected, we compared the composition of nonpolysomal, polysomal, and total cytosolic RNAs from infected cells, noninfected cells, and infected cells treated with a potent antiviral molecule. PCA and clustering methods clearly demonstrated that JFH1 infection induced specific changes at the translational level. Experiments using a potent NS3 protease inhibitor indicated that most of the observed changes were due to HCV replication rather than to HCV entry.
The results of our analysis of cytosolic mRNA are consistent with previous results obtained with the JFH1 model, showing that this model is robust and reliable for transcriptomic analyses (7, 46). One crucial issue is the accuracy of the new method used to select translationally up- and downregulated genes (ANOTA) instead of the classical log ratio approach (47). The best evidence supporting the use of this new method is the observed correlation with the protein expression previously observed in the same model and under the same conditions (20). This confirms that the higher the level of translation of an mRNA, the higher the likelihood that the corresponding protein will be expressed. Thus, translational profiling of mRNA opens a window on the proteome. However, posttranslational modifications, such as phosphorylation, which could be altered are obviously not analyzable through translation profiling.
Translational profiling provides access to translational regulations occurring during HCV replication. Some regulated genes were also found to be regulated in proteomic studies and were involved in metabolism, the cytoskeleton, vesicle trafficking, or mitochondrial processes (20, 48). Other pathways or biological processes were identified only by translational profiling, such as translational process and other posttranscriptional regulations. Translation profiling is based on nucleic acid detection and is obviously more sensitive than proteomic methods.
What are the mechanisms governing translational regulation during HCV infection? Concerning the miRNAs which theoretically modulate a part of translation (49), our results were mainly negative. The only correlation we found was that the upregulation of mRNA occurs when specific miRNAs are not present. Furthermore, in the present study, only 10 miRNAs (including miR-122) were modulated by the acute infection of Huh-7.5.1 cells by JFH1; 5 of these were previously reported in at least one paper on this issue (8, 43–45), but none was correlated to the translation of target genes in the present study. Further experiments are required to show if the observed changes in miRNA have functional consequences. Finally, the hypothesis that miRNA regulation has a relatively low impact under our experimental conditions may be also considered. The downregulation of Dicer and KSRP (27), factors involved in miRNA processing, could result in a global reduction in miRNA-mediated regulation that cannot be detected with microRNA microarrays. At another level, many genes involved in posttranscriptional regulation (RNA decay, deadenylation, splicing, and tRNA synthetase) and, strikingly, in translational regulation were regulated at the translational level. The expressions of these genes could differentially influence the posttranscriptional processing of many other genes, thus explaining many posttranscriptional modulations during JFH1 infection.
One striking finding was the correlative link between the regulation of mRNA transcription and mRNA translation during JFH1 infection. Among the genes which were both translationally and transcriptionaly regulated, 97% underwent concordant regulation. This explained why some ontologic pathways were modified at both layers of regulation. This is also in keeping with the fact that 86% of proteins that were up- or downregulated in the proteomic study of Diamond et al. (20) were also transcriptionally up- or downregulated in the same direction in the present study. Since the ANOTA algorithm identified translationally regulated genes independently of the quantity of total RNA, one may hypothesize that regulation of translation and of transcription might be generally coupled. For instance, many RNA-binding proteins involved in posttranscriptional regulation could also be present in the nucleus and could potentially regulate the transcription and export of mRNA from the nucleus to the cytosol.
HCV JFH1 replicates very efficiently in a cell line with a defective interferon response; thus, we obtained 100% infected cells in our study. These conditions obviously facilitate the translation profiling analysis used herein. A similar translation profiling analysis with infected clinical tissues or with cultured primary human hepatocytes should require the isolation of a sufficient quantity of infected cells and comparisons with noninfected cells. The relevance of our findings to the natural infective process remains to be shown. Nevertheless, the results of this approach in the unique and artificial JFH1 model demonstrate that specific pathways, and particularly posttranscriptional regulation, are deeply involved during HCV infection.
Supplementary Material
ACKNOWLEDGMENTS
We thank David Young for help with the manuscript and Catherine Chevalier, from the microarray platform of Nantes, for help in the microarray hybridization.
C.F., A.R.R., and S.V. designed the study. C.H. performed the JFH1 infection experiments. S.P. performed the polysomal fractionation. H.C. and C.L.B.-S. performed the microarray and qPCR experiments. H.C., A.B., R.H., and C.F. performed the bioinformatic analyses. H.C., C.H., A.R.R., S.V., and C.F. wrote the paper.
This work was supported by Pays-de-Loire Conseil Régional and by the French agency for research on AIDS and hepatitis (ANRS).
Footnotes
Published ahead of print 3 April 2013
Supplemental material for this article may be found at http://dx.doi.org/10.1128/JVI.00538-13.
REFERENCES
- 1. Aizaki H, Harada T, Otsuka M, Seki N, Matsuda M, Li YW, Kawakami H, Matsuura Y, Miyamura T, Suzuki T. 2002. Expression profiling of liver cell lines expressing entire or parts of hepatitis C virus open reading frame. Hepatology 36:1431–1438 [DOI] [PubMed] [Google Scholar]
- 2. Ciccaglione AR, Marcantonio C, Tritarelli E, Tataseo P, Ferraris A, Bruni R, Dallapiccola B, Gerosolimo G, Costantino A, Rapicetta M. 2008. Microarray analysis identifies a common set of cellular genes modulated by different HCV replicon clones. BMC Genomics 9:309 doi: 10.1186/1471-2164-9-309 [DOI] [PMC free article] [PubMed] [Google Scholar]
- 3. Pazienza V, Clement S, Pugnale P, Conzelmann S, Pascarella S, Mangia A, Negro F. 2009. Gene expression profile of Huh-7 cells expressing hepatitis C virus genotype 1b or 3a core proteins. Liver Int. 29:661–669 [DOI] [PubMed] [Google Scholar]
- 4. Lindenbach BD, Evans MJ, Syder AJ, Wolk B, Tellinghuisen TL, Liu CC, Maruyama T, Hynes RO, Burton DR, McKeating JA, Rice CM. 2005. Complete replication of hepatitis C virus in cell culture. Science 309:623–626 [DOI] [PubMed] [Google Scholar]
- 5. Wakita T, Pietschmann T, Kato T, Date T, Miyamoto M, Zhao Z, Murthy K, Habermann A, Krausslich HG, Mizokami M, Bartenschlager R, Liang TJ. 2005. Production of infectious hepatitis C virus in tissue culture from a cloned viral genome. Nat. Med. 11:791–796 [DOI] [PMC free article] [PubMed] [Google Scholar]
- 6. Zhong J, Gastaminza P, Cheng G, Kapadia S, Kato T, Burton DR, Wieland SF, Uprichard SL, Wakita T, Chisari FV. 2005. Robust hepatitis C virus infection in vitro. Proc. Natl. Acad. Sci. U. S. A. 102:9294–9299 [DOI] [PMC free article] [PubMed] [Google Scholar]
- 7. Blackham S, Baillie A, Al-Hababi F, Remlinger K, You S, Hamatake R, McGarvey MJ. 2010. Gene expression profiling indicates the roles of host oxidative stress, apoptosis, lipid metabolism, and intracellular transport genes in the replication of hepatitis C virus. J. Virol. 84:5404–5414 [DOI] [PMC free article] [PubMed] [Google Scholar]
- 8. Liu X, Wang T, Wakita T, Yang W. 2010. Systematic identification of microRNA and messenger RNA profiles in hepatitis C virus-infected human hepatoma cells. Virology 398:57–67 [DOI] [PubMed] [Google Scholar]
- 9. Walters KA, Syder AJ, Lederer SL, Diamond DL, Paeper B, Rice CM, Katze MG. 2009. Genomic analysis reveals a potential role for cell cycle perturbation in HCV-mediated apoptosis of cultured hepatocytes. PLoS Pathog. 5:e1000269 doi: 10.1371/journal.ppat.1000269 [DOI] [PMC free article] [PubMed] [Google Scholar]
- 10. Woodhouse SD, Narayan R, Latham S, Lee S, Antrobus R, Gangadharan B, Luo S, Schroth GP, Klenerman P, Zitzmann N. 2010. Transcriptome sequencing, microarray, and proteomic analyses reveal cellular and metabolic impact of hepatitis C virus infection in vitro. Hepatology 52:443–453 [DOI] [PMC free article] [PubMed] [Google Scholar]
- 11. Jacobs JM, Diamond DL, Chan EY, Gritsenko MA, Qian W, Stastna M, Baas T, Camp DG, II, Carithers RL, Jr, Smith RD, Katze MG. 2005. Proteome analysis of liver cells expressing a full-length hepatitis C virus (HCV) replicon and biopsy specimens of posttransplantation liver from HCV-infected patients. J. Virol. 79:7558–7569 [DOI] [PMC free article] [PubMed] [Google Scholar]
- 12. Ideker T, Thorsson V, Ranish JA, Christmas R, Buhler J, Eng JK, Bumgarner R, Goodlett DR, Aebersold R, Hood L. 2001. Integrated genomic and proteomic analyses of a systematically perturbed metabolic network. Science 292:929–934 [DOI] [PubMed] [Google Scholar]
- 13. Shenton D, Smirnova JB, Selley JN, Carroll K, Hubbard SJ, Pavitt GD, Ashe MP, Grant CM. 2006. Global translational responses to oxidative stress impact upon multiple levels of protein synthesis. J. Biol. Chem. 281:29011–29021 [DOI] [PubMed] [Google Scholar]
- 14. Podevin P, Carpentier A, Pene V, Aoudjehane L, Carriere M, Zaidi S, Hernandez C, Calle V, Meritet JF, Scatton O, Dreux M, Cosset FL, Wakita T, Bartenschlager R, Demignot S, Conti F, Rosenberg AR, Calmus Y. 2010. Production of infectious hepatitis C virus in primary cultures of human adult hepatocytes. Gastroenterology 139:1355–1364 [DOI] [PubMed] [Google Scholar]
- 15. Pène V, Hernandez C, Vauloup-Fellous C, Garaud-Aunis J, Rosenberg AR. 2009. Sequential processing of hepatitis C virus core protein by host cell signal peptidase and signal peptide peptidase: a reassessment. J. Viral Hepat. 16:705–715 [DOI] [PubMed] [Google Scholar]
- 16. Pearson K. 1896. Mathematical contributions to the theory of evolution. On a form of spurious correlation which may arise when indices are used in the measurement of organs. Proc. R. Soc. Lond. 60:489–498 [Google Scholar]
- 17. Larsson O, Sonenberg N, Nadon R. 2011. anota: analysis of differential translation in genome wide studies. Bioinformatics 27:1440–1441 [DOI] [PubMed] [Google Scholar]
- 18. Huang da W, Sherman BT, Lempicki RA. 2009. Bioinformatics enrichment tools: paths toward the comprehensive functional analysis of large gene lists. Nucleic Acids Res. 37:1–13 [DOI] [PMC free article] [PubMed] [Google Scholar]
- 19. Le Brigand K, Robbe-Sermesant K, Mari B, Barbry P. 2010. MiRonTop: mining microRNAs targets across large scale gene expression studies. Bioinformatics 26:3131–3132 [DOI] [PMC free article] [PubMed] [Google Scholar]
- 20. Diamond DL, Syder AJ, Jacobs JM, Sorensen CM, Walters KA, Proll SC, McDermott JE, Gritsenko MA, Zhang Q, Zhao R, Metz TO, Camp DG, II, Waters KM, Smith RD, Rice CM, Katze MG. 2010. Temporal proteome and lipidome profiles reveal hepatitis C virus-associated reprogramming of hepatocellular metabolism and bioenergetics. PLoS Pathog. 6:e1000719 doi: 10.1371/journal.ppat.1000719 [DOI] [PMC free article] [PubMed] [Google Scholar]
- 21. Bost AG, Venable D, Liu L, Heinz BA. 2003. Cytoskeletal requirements for hepatitis C virus (HCV) RNA synthesis in the HCV replicon cell culture system. J. Virol. 77:4401–4408 [DOI] [PMC free article] [PubMed] [Google Scholar]
- 22. Mottola G, Cardinali G, Ceccacci A, Trozzi C, Bartholomew L, Torrisi MR, Pedrazzini E, Bonatti S, Migliaccio G. 2002. Hepatitis C virus nonstructural proteins are localized in a modified endoplasmic reticulum of cells expressing viral subgenomic replicons. Virology 293:31–43 [DOI] [PubMed] [Google Scholar]
- 23. Miyanari Y, Atsuzawa K, Usuda N, Watashi K, Hishiki T, Zayas M, Bartenschlager R, Wakita T, Hijikata M, Shimotohno K. 2007. The lipid droplet is an important organelle for hepatitis C virus production. Nat. Cell Biol. 9:1089–1097 [DOI] [PubMed] [Google Scholar]
- 24. Boström P, Andersson L, Rutberg M, Perman J, Lidberg U, Johansson BR, Fernandez-Rodriguez J, Ericson J, Nilsson T, Boren J, Olofsson SO. 2007. SNARE proteins mediate fusion between cytosolic lipid droplets and are implicated in insulin sensitivity. Nat. Cell Biol. 9:1286–1293 [DOI] [PubMed] [Google Scholar]
- 25. Evans MJ, Rice CM, Goff SP. 2004. Phosphorylation of hepatitis C virus nonstructural protein 5A modulates its protein interactions and viral RNA replication. Proc. Natl. Acad. Sci. U. S. A. 101:13038–13043 [DOI] [PMC free article] [PubMed] [Google Scholar]
- 26. Zhang J, Yamada O, Sakamoto T, Yoshida H, Iwai T, Matsushita Y, Shimamura H, Araki H, Shimotohno K. 2004. Down-regulation of viral replication by adenoviral-mediated expression of siRNA against cellular cofactors for hepatitis C virus. Virology 320:135–143 [DOI] [PubMed] [Google Scholar]
- 27. Trabucchi M, Briata P, Garcia-Mayoral M, Haase AD, Filipowicz W, Ramos A, Gherzi R, Rosenfeld MG. 2009. The RNA-binding protein KSRP promotes the biogenesis of a subset of microRNAs. Nature 459:1010–1014 [DOI] [PMC free article] [PubMed] [Google Scholar]
- 28. Taylor DR, Puig M, Darnell ME, Mihalik K, Feinstone SM. 2005. New antiviral pathway that mediates hepatitis C virus replicon interferon sensitivity through ADAR1. J. Virol. 79:6291–6298 [DOI] [PMC free article] [PubMed] [Google Scholar]
- 29. Isken O, Baroth M, Grassmann CW, Weinlich S, Ostareck DH, Ostareck-Lederer A, Behrens SE. 2007. Nuclear factors are involved in hepatitis C virus RNA replication. RNA 13:1675–1692 [DOI] [PMC free article] [PubMed] [Google Scholar]
- 30. Lee CS, Dias AP, Jedrychowski M, Patel AH, Hsu JL, Reed R. 2008. Human DDX3 functions in translation and interacts with the translation initiation factor eIF3. NucleicAcids Res. 36:4708–4718 [DOI] [PMC free article] [PubMed] [Google Scholar]
- 31. Pacheco A, Reigadas S, Martinez-Salas E. 2008. Riboproteomic analysis of polypeptides interacting with the internal ribosome-entry site element of foot-and-mouth disease viral RNA. Proteomics 8:4782–4790 [DOI] [PubMed] [Google Scholar]
- 32. Spångberg K, Wiklund L, Schwartz S. 2000. HuR, a protein implicated in oncogene and growth factor mRNA decay, binds to the 3′ ends of hepatitis C virus RNA of both polarities. Virology 274:378–390 [DOI] [PubMed] [Google Scholar]
- 33. Rivas-Aravena A, Ramdohr P, Vallejos M, Valiente-Echeverria F, Dormoy-Raclet V, Rodriguez F, Pino K, Holzmann C, Huidobro-Toro JP, Gallouzi IE, Lopez-Lastra M. 2009. The Elav-like protein HuR exerts translational control of viral internal ribosome entry sites. Virology 392:178–185 [DOI] [PubMed] [Google Scholar]
- 34. Weinlich S, Huttelmaier S, Schierhorn A, Behrens SE, Ostareck-Lederer A, Ostareck DH. 2009. IGF2BP1 enhances HCV IRES-mediated translation initiation via the 3′UTR. RNA 15:1528–1542 [DOI] [PMC free article] [PubMed] [Google Scholar]
- 35. Korf M, Jarczak D, Beger C, Manns MP, Kruger M. 2005. Inhibition of hepatitis C virus translation and subgenomic replication by siRNAs directed against highly conserved HCV sequence and cellular HCV cofactors. J. Hepatol. 43:225–234 [DOI] [PubMed] [Google Scholar]
- 36. Randall G, Panis M, Cooper JD, Tellinghuisen TL, Sukhodolets KE, Pfeffer S, Landthaler M, Landgraf P, Kan S, Lindenbach BD, Chien M, Weir DB, Russo JJ, Ju J, Brownstein MJ, Sheridan R, Sander C, Zavolan M, Tuschl T, Rice CM. 2007. Cellular cofactors affecting hepatitis C virus infection and replication. Proc. Natl. Acad. Sci. U. S. A. 104:12884–12889 [DOI] [PMC free article] [PubMed] [Google Scholar]
- 37. Mannová P, Beretta L. 2005. Activation of the N-Ras-PI3K-Akt-mTOR pathway by hepatitis C virus: control of cell survival and viral replication. J. Virol. 79:8742–8749 [DOI] [PMC free article] [PubMed] [Google Scholar]
- 38. George A, Panda S, Kudmulwar D, Chhatbar S, Nayak S, Krishnan H. 2012. Hepatitis C virus NS5A binds to the mRNA cap-binding eukaryotic translation initiation 4F (eIF4F) complex and up-regulates host translation initiation machinery through eIF4E-binding protein 1 inactivation. J. Biol. Chem. 287:5042–5058 [DOI] [PMC free article] [PubMed] [Google Scholar]
- 39. Ujino S, Yamaguchi S, Shimotohno K, Takaku H. 2009. Heat-shock protein 90 is essential for stabilization of the hepatitis C virus nonstructural protein NS3. J. Biol. Chem. 284:6841–6846 [DOI] [PMC free article] [PubMed] [Google Scholar]
- 40. Cheng JC, Yeh YJ, Pai LM, Chang ML, Yeh CT. 2009. 293 cells over-expressing human ADI1 and CD81 are permissive for serum-derived hepatitis C virus infection. J. Med. Virol. 81:1560–1568 [DOI] [PubMed] [Google Scholar]
- 41. Watashi K, Ishii N, Hijikata M, Inoue D, Murata T, Miyanari Y, Shimotohno K. 2005. Cyclophilin B is a functional regulator of hepatitis C virus RNA polymerase. Mol. Cell 19:111–122 [DOI] [PubMed] [Google Scholar]
- 42. Choukhi A, Ung S, Wychowski C, Dubuisson J. 1998. Involvement of endoplasmic reticulum chaperones in the folding of hepatitis C virus glycoproteins. J. Virol. 72:3851–3858 [DOI] [PMC free article] [PubMed] [Google Scholar]
- 43. Peng X, Li Y, Walters KA, Rosenzweig ER, Lederer SL, Aicher LD, Proll S, Katze MG. 2009. Computational identification of hepatitis C virus associated microRNA-mRNA regulatory modules in human livers. BMC Genomics 10:373 doi: 10.1186/1471-2164-10-373 [DOI] [PMC free article] [PubMed] [Google Scholar]
- 44. Steuerwald NM, Parsons JC, Bennett K, Bates TC, Bonkovsky HL. 2010. Parallel microRNA and mRNA expression profiling of (genotype 1b) human hepatoma cells expressing hepatitis C virus. Liver Int. 30:1490–1504 [DOI] [PubMed] [Google Scholar]
- 45. Pedersen IM, Cheng G, Wieland S, Volinia S, Croce CM, Chisari FV, David M. 2007. Interferon modulation of cellular microRNAs as an antiviral mechanism. Nature 449:919–922 [DOI] [PMC free article] [PubMed] [Google Scholar]
- 46. Joyce MA, Walters KA, Lamb SE, Yeh MM, Zhu LF, Kneteman N, Doyle JS, Katze MG, Tyrrell DL. 2009. HCV induces oxidative and ER stress, and sensitizes infected cells to apoptosis in SCID/Alb-uPA mice. PLoS Pathog. 5:e1000291 doi: 10.1371/journal.ppat.1000291 [DOI] [PMC free article] [PubMed] [Google Scholar]
- 47. Larsson O, Sonenberg N, Nadon R. 2010. Identification of differential translation in genome wide studies. Proc. Natl. Acad. Sci. U. S. A. 107:21487–21492 [DOI] [PMC free article] [PubMed] [Google Scholar]
- 48. Diamond DL, Jacobs JM, Paeper B, Proll SC, Gritsenko MA, Carithers RL, Jr, Larson AM, Yeh MM, Camp DG, II, Smith RD, Katze MG. 2007. Proteomic profiling of human liver biopsies: hepatitis C virus-induced fibrosis and mitochondrial dysfunction. Hepatology 46:649–657 [DOI] [PubMed] [Google Scholar]
- 49. Guo H, Ingolia NT, Weissman JS, Bartel DP. 2010. Mammalian microRNAs predominantly act to decrease target mRNA levels. Nature 466:835–840 [DOI] [PMC free article] [PubMed] [Google Scholar]
Associated Data
This section collects any data citations, data availability statements, or supplementary materials included in this article.


