Abstract
Cancer biomarkers have significant potential as reliable tools for the early detection of the disease and for monitoring its recurrence. However, most current methods for biomarker detection have technical difficulties (such as sample preparation and specific detector requirements) which limit their application in point of care diagnostics. We developed an extremely simple, power-free microfluidic system for direct detection of cancer biomarkers in microliter volumes of whole blood. CEA and CYFRA21-1 were chosen as model cancer biomarkers. The system automatically extracted blood plasma from less than 3 μl of whole blood and performed a multiplex sample-to-answer assay (nano-ELISA (enzyme-linked immunosorbent assay) technique) without the use of external power or extra components. By taking advantage of the nano-ELISA technique, this microfluidic system detected CEA at a concentration of 50 pg/ml and CYFRA21-1 at a concentration of 60 pg/ml within 60 min. The combination of PnP polydimethylsiloxane (PDMS) pump and nano-ELISA technique in a single microchip system shows great promise for the detection of cancer biomarkers in a drop of blood.
INTRODUCTION
Cancer remains a major cause of mortality and a serious threat to the health of people around the world. Biomarkers have emerged as potentially important diagnostic tools to reduce mortality rates and increase overall survival for cancer patients.1 Biomarkers of cancer include a broad range of biochemical entities, such as nucleic acids, proteins, sugars, lipids, and small metabolites, cytogenetic and cytokinetic parameters as well as whole tumour cells (usually known as circulating tumour cells, CTCs) found in the body fluid. Among them, the protein-based biomarkers and CTCs are the two most commonly used biomarkers for the early detection of cancer due to their high specificity and sensitivity. CTCs can provide valuable clinical information for prognosis, prediction of response to therapy, or monitoring clinical course in patients. Recently, there have been many attempts to develop a reliable, rapid and sensitive method for the isolation and detection of CTCs, including immunomagnetic separation,2, 3 affinity chromatography separation,4, 5 and label-free separation.6, 7, 8, 9, 10, 11, 12 Despite the detection and analysis of CTCs offer a promising non-invasive diagnostic approach for the diagnosis and prognosis of cancer, its use in clinical practice remains limited because of the rarity of CTCs in blood, the difficulty of isolating CTCs and the complexity of CTCs identification and enumeration. In contrast to the isolation and detection of CTCs, the protein-based biomarker tests are easier and more convenient which do not need labor-intensive cell capture and identification and has the potential to allow rapid point-of-care use. Thus, the protein-based biomarkers are widely used in current clinical practice for non-invasive detection of cancer. Currently, most of the reported methods for the protein-based biomarkers detection have employed colorimetric enzyme immunoassays,13 electrochemical immunoassays,14 radioimmunoassays,15 or fluoroimmunoassays.16 However, these assays have technical limitations, including sample preparation complexity and specific detection instrumentation requirements. In addition, inhibitors and cells present in whole blood can interfere with enzyme-linked immunosorbent assays (ELISA), resulting in decreased sensitivity.17, 18, 19 Thus, most clinical diagnostic procedures require isolated plasma rather than whole blood to minimize this interference and increase assay sensitivity and specificity.20, 21
Microfluidic technology has developed rapidly over the last several years, confirming prospects for its broad applicability in basic research and clinical analysis22, 23 due to portability, affordability, and high sensitivity. It holds particular promise in the implementation of point-of-care (POC) diagnostics because of instrument and method miniaturization. On-chip plasma separation and protein-based biomarkers detection can miniaturize and simplify analysis, thus eliminating process contamination from sample handling, transportation and storage. Numerous reports have described on-chip plasma separation using microfluidic approaches, such as centrifugation,24, 25 filtration,26 magnetophoresis,27 flow bifurcation,28 and membrane integration.29, 30, 31 However, these chips require external power sources or sophisticated fabrication which hinders their widespread application, especially in developing countries. Recently, Dimov et al. demonstrated a self-powered, integrated, microfluidic blood analysis system that performed on-chip cell removal and multiple protein binding assays.32 While this system provided an attractive solution for on-chip whole-blood immunoassay, it was only suitable for one-step immunoassays and required bulky and expensive fluorescence detection instrumentation, thus limiting its application in POC diagnostics. Therefore, the need remains for a simple, low cost system for on-chip whole-blood immunoassay.
This paper describes a simple, power-free, whole-blood, immunoassay, microfluidic system which integrates plasma extraction with on-chip nano-ELISA for a highly sensitive immunoassay. This system uses a pre-degassed polydimethylsiloxane (PDMS) bulk containing mesh-shaped chambers as a suction pump to drive the fluid motion in the chip's microchannels during plasma separation and immunoassay. The array of microchannels in the chip contains localized deeper sections which are designed for plasma separation based on the natural sedimentation behavior of blood cells at low shear rate. The system is powered by the pre-degassed bulk PDMS without using external power sources which would be useful for point-of-care diagnosis. Furthermore, because a PnP PDMS pump slab can be simply peeled off from the microchip and replaced with another degassed PnP PDMS slab, the system can easily be used to perform a complex immunoassay involving multiple-step reactions. To amplify the detected signals, this system uses silver reduction promoted by gold nanoparticles, which offers a visual macroscopic readout using a simple optical detection device. Carcino-embryonic antigen (CEA) and serum cytokeratin fragment 21-1 (CYFRA21-1) were used as model cancer biomarkers to demonstrate the ability of this system to directly detect cancer biomarkers in whole blood. CEA is one of the most widely studied cancer biomarkers related to lung cancer,33 colon cancer,34 and breast cancer,35 which exists originally in digestive system cancer in endoblast. Similarly, serum cytokeratin fragment 21-1 (CYFRA21-1), which is reported to react specifically to CK19 fragments, is associated with lung cancer,36 breast cancer,37 and bladder cancer.38
MATERIALS AND METHODS
Design and fabrication of microchips
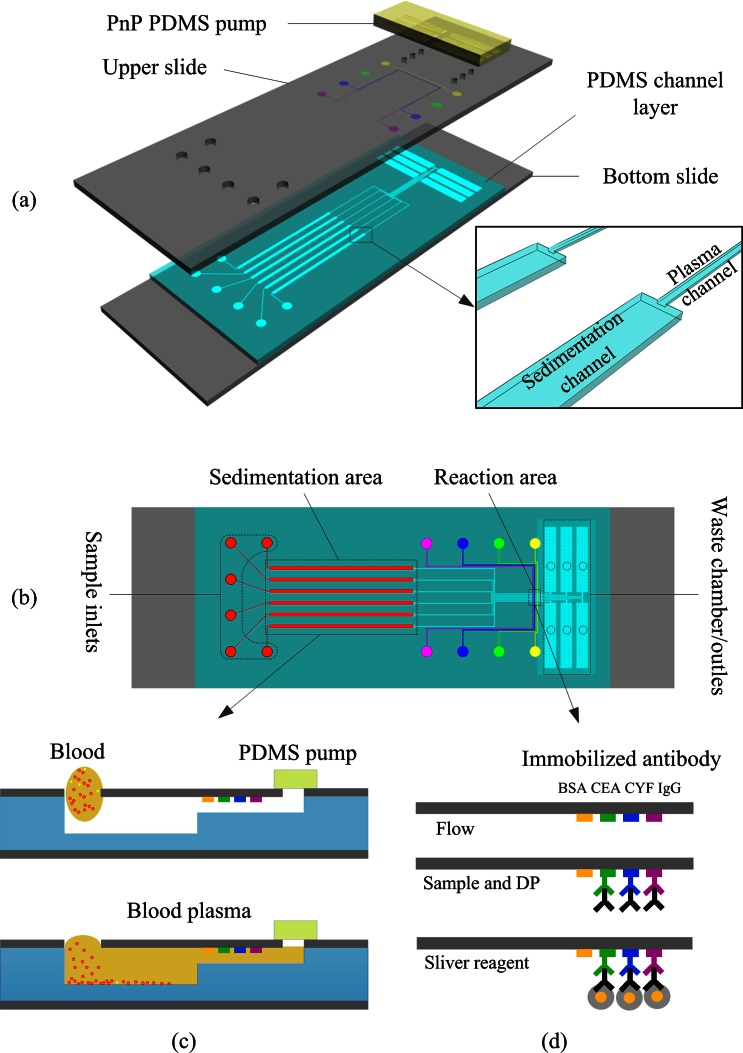
As shown schematically in Fig. 1a, the chip was composed of a top glass layer immobilized with antibody strips, a middle PDMS layer containing microfluidic channels, and a bottom glass support substrate layer. The chip had six independent microchannels. Each microchannel had three operating sections: a sedimentation area, a reaction area, and a pumping chamber/waste area (Fig. 1b). The sedimentation area was deeper and wider than other areas of the microchannel to slow down the flow rate. As whole blood passed through the sedimentation area, the low flow rate allowed all blood cells to sediment gravitationally leaving only plasma for the immunoassay analysis. In this chip, fluid was pumped with a unique, self-priming, degassing-driven flow technique.39 To increase the pumping energy of degassed PDMS, an array of supporting posts was fabricated in each pumping chamber to increase the area for absorbance of air.40
Figure 1.
Schematic diagram of the proposed microfluidic device: (a) Exploded view, (b) top view, (c) cross sections of plasma separation, and (d) illustration of experimental procedure for immunoassay based on gold nanoparticle silver enhancement.
The PDMS layer and PDMS stamp were fabricated using the soft lithography replica molding technique. Two template molds were fabricated using standard photolithography on 3-in. silicon wafers. The PDMS layer template was prepared using a multi-layer SU-8 process [(SU8-2015 and SU8-2100 negative photoresists (Microchem Corp.)] to produce plasma channels, sedimentation channels, and waste chambers. Typical dimensions used in the device are plasma channel 15 μm (height) × 100 μm (width) × 23 mm (length); sedimentation channel 100 μm (height) × 500 μm (width) × 20 mm (length); waste chamber (including an array of microposts to prevent roof-collapse) 100 μm (height) × 1.6 mm (width) × 9 mm (length). The PDMS stamp template was a single-layer mold containing 100-μm high and 100-μm wide features made with SU8-2100 photoresist (Microchem Corp.). After completion of the template molds, Sylgard 184 (10:1 (w/w) resin to cross-linker) was poured over the templates to form structured PDMS substrates. After curing, the cast PDMS slabs were peeled off the templates and cut to the appropriate size. The PDMS stamp was reversibly bonded to a glass slide for selectively patterning the captured antibody. The molded PDMS layer was visually aligned and reversibly bonded to a predrilled, antibody patterned glass slide. The glass-PDMS assembly was then placed on the substrate.
Capture antibody patterning
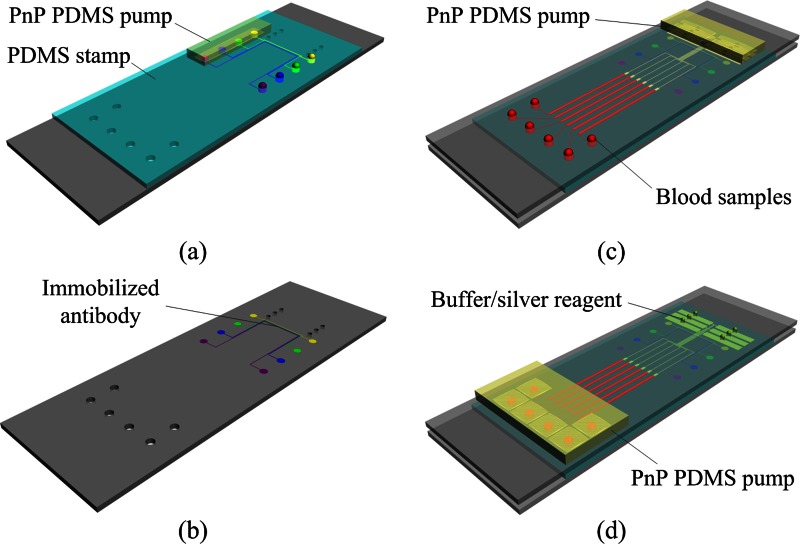
Prior to assembling the microchip device, the capture protein was immobilized on the top glass slide using a PDMS stamp (Figs. 2a, 2b) as follows: (i) the peeled PDMS stamp was bonded to an aldehyde-glass slide to form the patterning protein device; (ii) the inlets of the microchannels were filled with 1 μl of capture antibody solution (Medix Biochemica), and the pre-degassed PDMS pump was placed on the outlets; (iii) after 120 min, the microchannels were blocked with BSA (10% in PBS) for 10 min; (iv) the microchannels were rinsed with water and dried under a stream of N2; (v) the PDMS stamp was removed from the glass slide. The patterned substrates were used on the day of preparation.
Figure 2.
Schematic illustration of the operation of the proposed microfluidic device: (a) A PDMS stamp is sealed over a glass slide and capture antibodies are loaded into microchannels. (b) After incubation, the PDMS stamp is peeled off and the patterned lines of capture antibodies are produced on the surface of the glass substrate. (c) The substrate patterned with lines of capture antibodies is turned over and reversibly sealed over a molded PDMS-glass assembly, then aliquots of blood samples are dispensed into the inlet ports of the microchip and plasma separation and antigen/DP capture are performed by mounting a “PnP” PDMS pump on the microchip. (d) After antigen/DP capture, all channels are flushed with PBS to remove unbound DP, and then aliquots silver solution are loaded into channels for further signal enhancement.
Preparation of samples and reagents
Unmodified gold nanoparticles (AuNPs, 13 nm in diameter) were prepared by citrate reduction.41 Briefly, 250 ml of 1 mM HAuCl4 in water was rapidly heated to boiling and allowed to equilibrate for 5 min under constant stirring, followed by the addition of 25 ml of 38.8 mM of trisodium citrate. The reaction proceeded for 15 min, during which the color of the solution changed from pale yellow to wine red. The AuNPs solution was cooled to room temperature and filtered through a 0.22-μm cellulose nitrate filter. The synthesized AuNPs were characterized by transmission electron microscopy (TEM) and UV/Vis spectroscopy.
The AuNP-anti-CEA detection antibody (DP1) was prepared as previously reported41 with a few modifications. The pH value of the AuNPs solution was adjusted to 8.5 with 0.2 M of K2CO3. Then 2 μl of CEA antibody (1 g/l, Medix Biochemica) was added to 0.5 ml of the AuNPs solution, followed by 10 μl of BSA solution (10%). The co-mixture was left for 30 min. After centrifugation at 10 000 g, the sedimented AuNPs probes were resuspended in 100 μl of PBS buffer (0.26 g NaH2PO4·H2O, 1.44 g Na2HPO4·H2O, 8.78 g NaCl/1 mLddH2O, pH 7.2) and stored at 4 °C.
Anti-CYFRA21-1 labeled AuNPs (DP2) was prepared as previously reported42 with a few modifications. The pH of the AuNPs solution was adjusted to 8.5 with 0.2 M of K2CO3. Then 5 μl of CYFRA21-1 antibody (Medix Biochemica) was added to 0.5 ml of the AuNPs suspension, after which it was incubated for 30 min at room temperature. After addition of 10 μl of BSA (10%), the mixture was centrifuged at 10 000 g for 20 min. The pelleted AuNPs conjugate was resuspended in 100 μl of PBS buffer and stored at 4 °C.
Whole blood was obtained from finger-prick samples from anonymous healthy donors with 43% hematocrit, and contained in a capillary blood collection system (pretreated by 3.24% sodium citrate) to prevent coagulation, and used within 1 day. Whole-blood samples were spiked with the antigen mixture (CEA, CYFRA21-1) before plasma separation. Prior to spiking, the whole blood was tested to confirm that there was no detectable endogenous antigen present.
For the immunoassay experiments reported in this work, a sliver solution containing silver salts (sliver nitrate) and reducing-agent (hydroquinone) was used to enhance the detection signal. It was prepared as follows: First, 30 μl of 0.5% hydroquinone was added to 60 μl of 1% gelatin and mixed thoroughly; then 1.5 μl of 25% AgNO3 was added to the mixture, followed by 10 μl citrate buffer (0.255 g C6H5Na3O7, 0.235 g Na3C6H5O7·2H2O/1 ml).
Assembly and activation of microfluidic device
The molded PDMS layer was bonded to the top glass slide on top of the protein pattern with the immobilized antibody lines perpendicular to the flow direction. The glass substrate was then attached to the PDMS-chip to form a sandwich.
Pumping energy for the microfluidic device was provided by a PnP PDMS pump slab. The PDMS pump slab was degassed in a standard vacuum desiccator at a specified vacuum for a specified time period. The microfluidic device was then activated by attaching the degassed PnP PDMS pump slab to its outlet.
Whole blood immunoassay procedure
The process of whole-blood immunoassay is illustrated in Figs. 2c, 2d. After loading 3 μl of human blood spiked with analytes (CEA, CYFRA21-1) and DP in the inlet, the PnP PDMS pump was placed on the outlet port of the device. The blood sample was automatically sucked into the microchannels by the negative pressure from the degassed PDMS pump. The blood cells settled by gravity in the sediment area, while the DP containing plasma moved to the reaction area. As plasma/DP flowed across the reaction area, antigen in the plasma was bound to the capture protein on the patterned protein sites. The microfluidic chip was then incubated for 30 min at 37 °C in a humidity box. After washing with PBS, a silver solution (silver salts and reducing agent) was loaded into channels for further signal enhancement. The signals were detected by an optical microscope (Olympus IX51) and were processed and analyzed using image-pro plus 6.0 software.
RESULTS AND DISCUSSION
Self-extraction of plasma from whole blood
Whole human blood consists of red blood cells, white blood cells, and plasma. When the degassed PDMS pump is attached to the outlet of the device, whole blood at the inlet flows into the microchannel by negative pressure. Provided that the pressure is suitable, the blood cells settle in the microchannel leaving cell-free plasma. Decreasing pressure from the pump diminishes the flow rate, thus increasing cell sedimentation, which is advantageous for successful plasma separation. However, decreased pressure also increases overall test time, so it is desirable to find a pressure that produces cell-free plasma in a reasonable amount of time. To determine this, we evaluated plasma separation performance as a function of PDMS pump degassing pressure (vacuum) and degassing time.
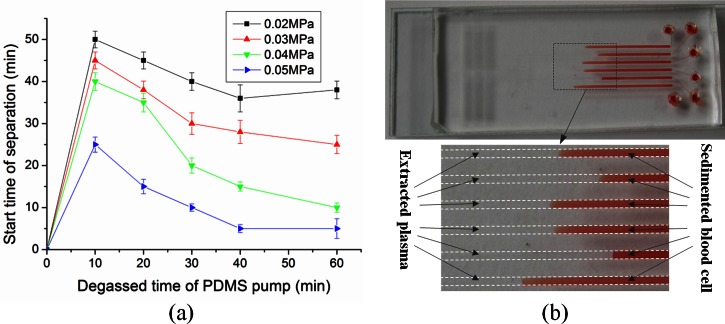
The PDMS pump slab was degassed at four different negative pressures (0.02, 0.03, 0.04, and 0.05 MPa) over a range of degassing times. The results are shown in Fig. 3a. The starting time of plasma separation decreased with increasing PDMS pump pressure. When the PDMS pump was degassed under 0.05 MPa negative pressure for 60 min, the starting time of plasma separation was 5 min. Fig. 3b shows the successful separation of plasma from whole blood. No blood cells were observed in the separated plasma (Fig. 3b). The volume of the separated plasma was large enough for subsequent protein detection and clinical analysis on the device.
Figure 3.
Self-extraction of plasma from whole blood using the proposed microfluidic device: (a) Effect of the degassed time of PDMS pump and the vacuum level on the plasma extraction from whole blood. Error bars are based on standard deviation with n = 3. (b) Fast and effective plasma separation of six separate whole-blood samples by gravity-driven blood cell sedimentation in the proposed microfluidic device.
The blood separation method relies on gravitational sedimentation not on cross flow. Therefore, there was no need for a scale gap or size-exclusion filtration mechanism as reported in Ref. 31. As the PnP PDMS pump technique was used in combination with the gravitational sedimentation of cells to separate the plasma from whole blood, no external pressure equipment was needed.
Synthesis and characterization of detection probe (DP)
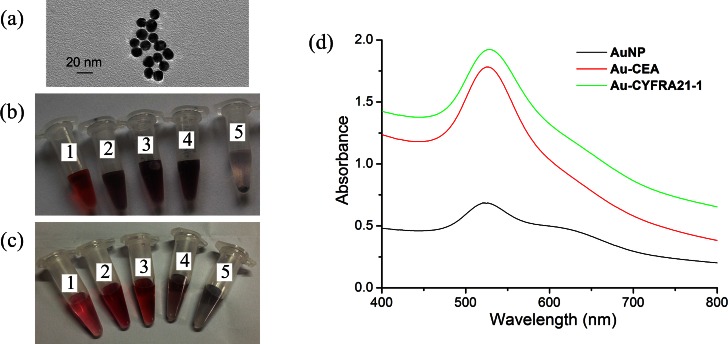
Gold nanoparticles were modified with monoclonal antibodies. The TEM images of the 13-nm AuNPs are shown in Fig. 4a. The stability of AuNPs is dependent on the concentration of electrolytes in solution. High salt concentrations induce aggregation of colloids. Therefore, we investigated different ratios of antibody and salt with 0.5 ml synthesized AuNPs. The results are given in Figs. 4b, 4c. The optimal concentration for AuNPs bound with CEA antibody was 0.02 μg/μl (Fig. 4b3). Increasing CEA antibody concentration to 0.03 μg/μl or 0.04 μg/μl resulted in aggregation of the AuNPs (Figs. 4b4, 4b5). Similarly, the best final concentration of CYFRA21-1 antibody was 0.05 μg/μl (Fig. 4c3).
Figure 4.
(a) Photograph of 13-nm AuNPs shown at the transmission electron microscopy image. (b) Image of the color change at AuNPs labeled with CEA antibody, the final concentration of antibody and NaCl in five tube (No. 1: 5 μg/ml CEA, 2 mM NaCl; No. 2: 10 μg/ml CEA, 2.5 mM NaCl; No. 3: 20 μg/ml CEA, 3 mM NaCl; No. 4: 30 μg/ml CEA, 3.5 mM NaCl; No. 5: 40 μg/ml CEA, 4 mM NaCl). (c) Image of the color change at AuNPs labeled with CYFRA21-1 antibody, the final concentration of antibody and NaCl in five tube (No. 1: 30 μg/ml CYF21-1, 3 mM NaCl; No. 2: 40 μg/ml CYF21-1, 3.5 mM NaCl; No. 3:50 μg/μl CYF21-1, 4 mM NaCl; No. 4:55 μg/ml CYF21-1, 4.5 mM NaCl; No. 5:60 μg/ml CYF21-1, 5 mM NaCl). (d) UV-Vis spectra of AuNPs solution and coating with antibody.
The change of nanoparticle size caused a shift in optical properties due to quantum size effects. The UV-Vis absorption peak of DP (AuNPs with bound antibody) shifted to 526 nm compared with 520 nm for the bare gold nanoparticles (Fig. 4d).
Whole blood sample-to-answer assay using microfluidic device
To develop a simple and portable method, we integrated the plasma separation and biomarker detection with microfluidic methods that combined ELISA and silver signal amplification. In contrast to most other microfluidic assays, we adopted reduction of silver ions onto gold nanoparticles in the ELISA procedure that allowed the signal to be amplified on a solid substrate under continuous fluid flow. The silver amplification readout was monitored using an optical microscope.
After plasma separation, the sample was directed to the cancer biomarkers detection region, where specific capture proteins were immobilized on the top glass slide (Fig. 2a). The surface of the glass substrate was specially modified with aldehyde groups to permit covalent linkage with proteins (based on reactions of aldehyde and amino groups). One hundred-μm capture protein stripes were patterned using the microfluidic network.
To demonstrate the generality of the sensors, we applied it to detect two cancer antigens (CEA and CYFRA21-1) which are clinical biomarkers for cancer. We chose a CEA/ CYFRA21-1 combination test because they are overexpressed in various tumors.43, 44, 45, 46 Detection of the CEA/ CYFRA21-1 level was important for initial diagnostic evaluations and follow-up studies during therapy.
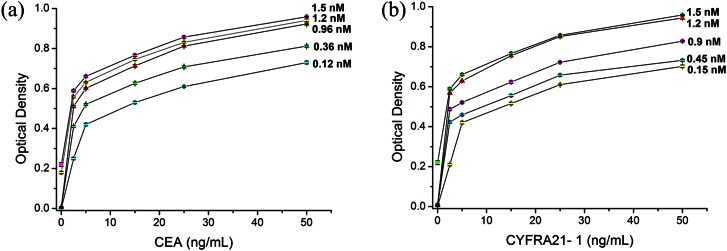
To avoid nonspecific protein responses, we optimized DP the concentration and reaction time. We then investigated the effects of reaction time (20 min, 30 min, 40 min, 50 min, and 60 min). The results showed that Antigen capture and formation of the DP-antigen-protein sandwich in the microchannel could be completed in 40 min. Therefore, 40 min incubation was used in the following experiments. Our tests investigated whole blood samples (containing antigen) spiked with five concentrations of DP. As the concentration of DP increased, response signals were enhanced. Fig. 5a showed that the best result was obtained with 0.96 nM DP1. Increasing DP1concentration to 1.2 nM or 1.5 nM created a large nonspecific signal. Similarly, the optimal concentration of DP2 was 1.2 nM (Fig. 5b). The silver staining was complete in 5 min according to the literature.47 Therefore, the whole assay could be completed within 1 h.
Figure 5.
(a) Concentration optimization graph of DP1 (AuNPs labeled with CEA antibody). (b) Concentration optimization graph of DP2 (AuNPs labeled with CYFRA21-1 antibody). Error bars are based on standard deviation with n = 3.
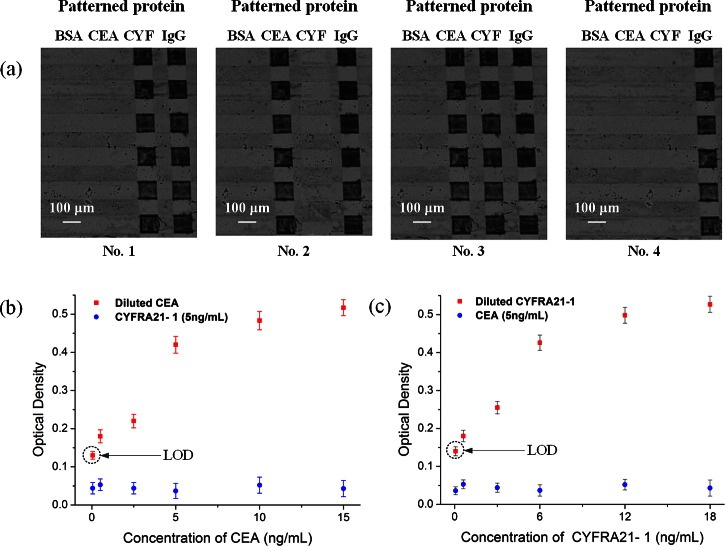
It is important for each target to be accurately captured by the specific antibody, which is patterned on the corresponding sites of the sensor. We employed four whole blood samples for the test: one negative sample (no antigen), one sample containing CEA, one sample containing CYFRA21-1, and one sample containing both CEA and CYFRA21-1. The results demonstrated the specificity of the sensors (Fig. 6a), showing that CYFRA21-1 (Fig. 6a1) and CEA (Fig. 6a2) were captured only by their corresponding sites and not by the other, while the negative sample (Fig. 6a4) produced no observable reaction.
Figure 6.
Whole blood sample-to-answer assay using the proposed microfluidic devices: (a) Images of silver-enhanced signals on detection sites coated with anti-CEA antibody, anti-CYFRA21-1 antibody, anti-goat IgG as a positive reference and BSA as a negative reference. No. 1: sample containing only CYFRA21-1 antigen, No. 2: sample containing only CEA antigen, No. 3: sample containing both CEA and CYFRA21-1 antigens, No. 4: negative sample (no antigen). (b) The optical density obtained for immunoassays done with the mixture of CEA and CYFRA21-1 on the proposed chip, while keeping the concentration of CYFRA21-1 in constant (5 ng/ml) and varying the concentration of CEA (50 pg/ml, 500 pg/ml, 2.5 ng/ml, 5 ng/ml, 10 ng/ml, and 15 ng/ml). (c) The optical density obtained for immunoassays done with the mixture of CEA and CYFRA21-1 on the proposed chip, while keeping the concentration of CEA in constant (5 ng/ml) and varying the concentration of CYFRA21-1 (60 pg/ml, 600 pg/ml, 3 ng/ml, 6 ng/ml, 12 ng/ml, and 18 ng/ml). Error bars are based on standard deviation with n = 3.
To test for cross-reactivity of the immobilized capture antibody, we spiked whole blood samples with various concentrations of CEA and CYFRA21-1 antigen. As shown in Fig. 6b, the presence of 5 ng/ml CYFRA21-1 had no detectable effect on the measurement of CEA concentration. In contrast, high concentrations of CEA had a small but observable effect on the measurement of lower concentrations of CYFRA21-1 (Fig. 6c). The test limit for detection of CEA and CYFRA21-1 antigen was 50 pg/ml and 60 pg/ml, respectively (Figs. 6b, 6c). For comparison, the classic CEA ELISA kit (Bio-Quant, USA) reported the limit of detection (LOD) at 0.64 ng/ml, and ultrasensitive assays have been reported with LODS at 48 pg/ml. The highest sensitivity commercially ELISA for CYFRA21-1 had an LOD of 0.1 ng/ml. Note that the limit signal was significantly above the background level. Therefore, the detection level can be significantly improved by further increasing the suction chamber volume and the binding site surface area.
CONCLUSION
In this study, we have demonstrated how a biosensor can separate blood plasma from whole blood and detect multiple cancer biomarkers. Our biosensor integrates a microfluidic chip with nano-ELISA techniques, which permits miniaturization of plasma analysis devices and eliminates user preparation steps. We used the device for direct blood analysis without sample pretreatment, which improved repeatability and stability and reduced sample cross-contamination. Of particular note, this biosensor stored potential energy directly in the PDMS substrate (the PDMS pump) therefore requires no external pumping. The biosensor device employed reversible bonding in the glass-PDMS-glass sandwich, so can be easily disassembled for further analyses.
The biosensor magnifies signals using an AuNP complex-based immunoassay and has a simple readout without expensive or complicated instruments. The advantages of this biosensor over other currently available rapid tests for cancer biomarkers is that it can be operated without special equipment, with minimal training, and the cost of reagents is low. The device has potential for point-of-care applications because it is fast, disposable and easy to use and has a low sample volume and low cost. Overall, we have demonstrated a new protocol that can detect cancer biomarkers in whole blood using pre-degassed PDMS microfluidic devices.
ACKNOWLEDGMENTS
This work was supported by the 973 Program of the Ministry of Science and Technology of China (Grant Nos. 2012CB933303 and 2011CB707505), the National Natural Science Foundation of China (Grant No. 61271161), the CAS Scientific Research Equipment Development Program (No. YZ201143), and Science and Technology Commission of Shanghai Municipality (Grants Nos. 11nm0505800 and 1052nm061000).
References
- Diamandis E. P., Fritche H. A., Lilja H., Chan D. W., Schwartz and M. K., Tumor Markers: Physiology, Pathobiology, Technology, and Clinical Applications (Amer. Assoc. for Clinical Chemistry Press, Washington, DC, 2002), pp. 9–17. [Google Scholar]
- Hoshino K., Huang Y. Y., Lane N., Huebschman M., Uhr J. W., Frenkel E. P., and Zhang X., Lab Chip 11, 3449 (2011). 10.1039/c1lc20270g [DOI] [PMC free article] [PubMed] [Google Scholar]
- Lin Y. H., Chen Y. J., Lai C. S., Chen Y. T., Chen C. L., Yu J. S., and Chang Y. S., Biomicrofluidics 7, 024103 (2013). 10.1063/1.4794974 [DOI] [PMC free article] [PubMed] [Google Scholar]
- Nagrath S., Sequist L. V., Maheswaran S., Bell D. W., Irimia D., Ulkus L., Smith M. R., Kwak E. L., Digumarthy S., Muzikansky A., Ryan P., Balis U. J., Tompkins R. G., Haber D. A., and Toner M., Nature 450, 1235 (2007). 10.1038/nature06385 [DOI] [PMC free article] [PubMed] [Google Scholar]
- Stott S. L., Hsu C. H., Tsukrov D. I., Yu M., Miyamoto D. T., Waltman B. A., Rothenberg S. M., Shah A. M., Smas M. E., Korir G. K., F. P.Floyd, Jr., Gilman A. J., Lord J. B., Winokur D., Springer S., Irimia D., Nagrath S., Sequist L. V., Lee R. J., Isselbacher K. J., Maheswaran S., Haber D. A., and Toner M., Proc. Natl. Acad. Sci. U.S.A. 107, 18392 (2010). 10.1073/pnas.1012539107 [DOI] [PMC free article] [PubMed] [Google Scholar]
- Cima I., Yee C. W., Iliescu F. S., Phyo W. M., Lim K. H., Iliescu C., and Tan M. H., Biomicrofluidics 7, 011810 (2013). 10.1063/1.4780062 [DOI] [PMC free article] [PubMed] [Google Scholar]
- Hosokawa M., Hayata T., Fukuda Y., Arakaki A., Yoshino T., Tanaka T., and Matsunaga T., Anal. Chem. 82(15), 6629 (2010). 10.1021/ac101222x [DOI] [PubMed] [Google Scholar]
- Gupta V., Jafferji I., Garza M., Melnikova V. O., Hasegawa D. K., Pethig R., and Davis D. W., Biomicrofluidics 6, 024133 (2012). 10.1063/1.4731647 [DOI] [PMC free article] [PubMed] [Google Scholar]
- Alshareef M., Metrakos N., Perez E. J., Azer F., Yang F., Yang X. M., and Wang G. R., Biomicrofluidics 7, 011803 (2013). 10.1063/1.4774312 [DOI] [PMC free article] [PubMed] [Google Scholar]
- Shim S., Stemke-Hale K., Noshari J., Becker F. F., and Gascoyne P. R. C., Biomicrofluidics 7, 011808 (2013). 10.1063/1.4774307 [DOI] [PMC free article] [PubMed] [Google Scholar]
- Moon H. S., Kwon K., Hyun K. A., Sim T. S., Park J. C., Lee J. G., and Jung H. I., Biomicrofluidics 7, 014105 (2013). 10.1063/1.4788914 [DOI] [PMC free article] [PubMed] [Google Scholar]
- Liu Z. B., Huang F., Du J. H., Shu W. L., Feng H. T., Xu X. P., and Chen Y., Biomicrofluidics 7, 011801 (2013). 10.1063/1.4774308 [DOI] [PMC free article] [PubMed] [Google Scholar]
- Hedin A., Carlsson L., Berglund A., and Hammarstrom S., Proc. Natl. Acad. Sci. U.S.A. 80, 3470 (1983). 10.1073/pnas.80.11.3470 [DOI] [PMC free article] [PubMed] [Google Scholar]
- Nishizono I., Iida S., Suzuki N., Kawada H., Murakami H., Ashihara Y., and Okada M., Clin. Chem. 37(9), 1639 (1991). [PubMed] [Google Scholar]
- Martin F. and Martin M. S., Int. J. Cancer 9(3), 641 (1972). 10.1002/ijc.2910090322 [DOI] [PubMed] [Google Scholar]
- Cao Z., Li H., Lau C., and Zhang Y., Anal. Chim. Acta 698(1–2), 44 (2011). 10.1016/j.aca.2011.04.045 [DOI] [PubMed] [Google Scholar]
- Raivio T., Korponay-Szabó I. R., Paajanen T., Ashorn M., Iltanen S., Collin P., and Laurila K., J. Pediatr. Gastroenterol. Nutr. 47(5), 562 (2008). 10.1097/MPG.0b013e3181615cde [DOI] [PubMed] [Google Scholar]
- Chakravarti A., Rawat D., and Yadav S., Diagn. Microbiol. Infect. Dis. 47(4), 563 (2003). 10.1016/S0732-8893(03)00166-4 [DOI] [PubMed] [Google Scholar]
- Wang S. Q., Sarenac D., Chen M. H., Huang S. H., Giguel F. F., Kuritzkes D. R., and Demirci U., Int. J. Nanomedicine 7, 5019 (2012). 10.2147/IJN.S32579 [DOI] [PMC free article] [PubMed] [Google Scholar]
- Tachi T., Kaji N., Tokeshi M., and Baba Y., Anal. Chem. 81(8), 3194 (2009). 10.1021/ac802434z [DOI] [PubMed] [Google Scholar]
- Wu C. C., Hong L. Z., and Ou C. T., J. Med. Biol. Eng. 32(3), 163 (2012). 10.5405/jmbe.937 [DOI] [Google Scholar]
- El-Ali J., Sorger P. K., and Jensen K. F., Nature 442, 403 (2006). 10.1038/nature05063 [DOI] [PubMed] [Google Scholar]
- Dittrich P. S. and Manz A., Nat. Rev. Drug. Discovery 5(3), 210 (2006). 10.1038/nrd1985 [DOI] [PubMed] [Google Scholar]
- Erickson D. and Li D., Anal. Chim. Acta 507, 11 (2004). 10.1016/j.aca.2003.09.019 [DOI] [Google Scholar]
- Haeberle S., Brenner T., Zengerle R., and Ducrée J., Lab Chip 6, 776 (2006). 10.1039/b604145k [DOI] [PubMed] [Google Scholar]
- Crowley T. A. and Pizziconi V., Lab Chip 5, 922 (2005). 10.1039/b502930a [DOI] [PubMed] [Google Scholar]
- Shim J. S., Browne A. W. and Ahn C. H., Biomed. Microdevices 12(5), 949 (2010). 10.1007/s10544-010-9449-7 [DOI] [PubMed] [Google Scholar]
- Han K. H. and Frazier A. B., Lab Chip 6, 265 (2006). 10.1039/b514539b [DOI] [PubMed] [Google Scholar]
- Fan R., Vermesh O., Srivastava A., Yen B. K., Qin L., Ahmad H., and Kwong G. A., Nat. Biotechnol. 26(12), 1373 (2008). 10.1038/nbt.1507 [DOI] [PMC free article] [PubMed] [Google Scholar]
- Thorslund S., Klett O., Nikolajeff F., Markides K., and Bergquist J., Biomed. Microdevices 8(1), 73 (2006). 10.1007/s10544-006-6385-7 [DOI] [PubMed] [Google Scholar]
- Taizo K. and Satoshi K., Sens. Actuators B 161(1), 1176 (2012). 10.1016/j.snb.2011.10.017 [DOI] [Google Scholar]
- Dimov I. K., Basabe-Desmonts L., Garcia-Cordero J. L., Ross B. M., Ricco A. J., and Lee L. P., Lab Chip 11(5), 845 (2011). 10.1039/c0lc00403k [DOI] [PubMed] [Google Scholar]
- Hotta K., Segawa Y., Takigawa N., Kishino D., Saeki H., Nakata M., Mandai K., and Eguchi K., Anticancer Res. 20(3B), 2177 (2000). [PubMed] [Google Scholar]
- Vukobrat-Bijedic Z., Husic-Selimovic A., Sofic A., Bijedic N., Gogov B., Djuran A., Redzepovic A., Saray A., and Bjelogrlic I., Acta. Inform. Med. 20(4), 238 (2012). 10.5455/aim.2012.20.238-241 [DOI] [PMC free article] [PubMed] [Google Scholar]
- Petersen E. R., Sørensen P. D., Jacobsen E. H., Madsen J. S., and Brandslund I., Clin. Chem. Lab. Med. 18, 1 (2013). 10.1515/cclm-2012-0558 [DOI] [Google Scholar]
- Yang L., Chen X., Li Y., Yang J., and Tang L., Exp. Theor. Med. 4(2), 243 (2010). [DOI] [PMC free article] [PubMed] [Google Scholar]
- Yoon J. H., Han K. H., Kim E. K., Moon H. J., Kim M. J., Suh Y. J., Choi J. S., and Park B. W., PLoS One 8(2), 57248 (2013). 10.1371/journal.pone.0057248 [DOI] [PMC free article] [PubMed] [Google Scholar]
- Jeong S., Park Y., Cho Y., Kim Y. R., and Kim H. S., Clin. Chim. Acta 414, 93 (2012). 10.1016/j.cca.2012.08.018 [DOI] [PubMed] [Google Scholar]
- Hosokawa K., Sato K., Ichikawa N., and Maeda M., Lab Chip 4(3), 181 (2004). 10.1039/b403930k [DOI] [PubMed] [Google Scholar]
- Li G., Luo Y., Chen Q., Liao L., and Zhao J., Biomicrofluidics 6(1), 14118 (2012). 10.1063/1.3692770 [DOI] [PMC free article] [PubMed] [Google Scholar]
- Grabar K. C., Freeman R. G., Hommer M. B., and Natan M. J., Anal. Chem. 67, 735 (1995). 10.1021/ac00100a008 [DOI] [Google Scholar]
- Liu M., Jia C., Jin Q., Lou X., Yao S., Xiang J., and Zhao J., Talanta 81(4–5), 1625 (2010). 10.1016/j.talanta.2010.03.014 [DOI] [PubMed] [Google Scholar]
- Reynoso G., Chu T. M., Holyoke D., Cohen E., Nemoto T., Wang J. J., and Chuang J., JAMA, J. Am. Med. Assoc. 220(3), 361 (1972). 10.1001/jama.1972.03200030021005 [DOI] [PubMed] [Google Scholar]
- Denk H., Tappeiner G., Eckerstorfer R., and Holzner J. H., Int. J. Cancer 10(2), 262 (1972). 10.1002/ijc.2910100206 [DOI] [PubMed] [Google Scholar]
- Matsuoka K., Sumitomo S., Nakashima N., Nakajima D., and Misaki N., Eur. J. Cardiothorac. Surg. 32(3), 435 (2007). 10.1016/j.ejcts.2007.05.014 [DOI] [PubMed] [Google Scholar]
- Edelman M. J., Hodgson L., Rosenblatt P. Y., Christenson R. H., Vokes E. E., Wang X., and Kratzke R., J. Thorac. Oncol. 7(4), 649 (2012). 10.1097/JTO.0b013e31824a8db0 [DOI] [PMC free article] [PubMed] [Google Scholar]
- Chin C. D., Laksanasopin T., Cheung Y. K., Steinmiller D., Linder V., Parsa H., Wang J., Moore H., Rouse R., Umviligihozo G., Karita E., Mwambarangwe L., Braunstein S. L., Wijgert J., Sahabo R., Justman J. E., El-Sadr W., and Sia S. K., Nat. Med. 17(8),1015 (2011). 10.1038/nm.2408 [DOI] [PubMed] [Google Scholar]


