

Abstract
The encoding of auditory information with indefatigable precision requires efficient resupply of vesicles at inner hair cell (IHC) ribbon synapses. Otoferlin, a transmembrane protein responsible for deafness in DFNB9 families, has been postulated to act as a calcium sensor for exocytosis as well as to be involved in rapid vesicle replenishment of IHCs. However, the molecular basis of vesicle recycling in IHCs is largely unknown. In the present study, we used high-resolution liquid chromatography coupled with mass spectrometry to copurify otoferlin interaction partners in the mammalian cochlea. We identified multiple subunits of the adaptor protein complex AP-2 (CLAP), an essential component of clathrin-mediated endocytosis, as binding partners of otoferlin in rats and mice. The interaction between otoferlin and AP-2 was confirmed by coimmunoprecipitation. We also found that AP-2 interacts with myosin VI, another otoferlin binding partner important for clathrin-mediated endocytosis (CME). The expression of AP-2 in IHCs was verified by reverse transcription PCR. Confocal microscopy experiments revealed that the expression of AP-2 and its colocalization with otoferlin is confined to mature IHCs. When CME was inhibited by blocking dynamin action, real-time changes in membrane capacitance showed impaired synaptic vesicle replenishment in mature but not immature IHCs. We suggest that an otoferlin-AP-2 interaction drives Ca2+- and stimulus-dependent compensating CME in mature IHCs.
Introduction
Dysfunction of otoferlin, a multi-C2 domain protein that acts as a calcium sensor in cochlear inner hair cells (IHCs), is responsible for auditory neuropathy/dyssynchrony (Varga et al., 2003) and various forms of autosomal recessive deafness DFNB9 (Yasunaga et al., 1999, 2000; Mirghomizadeh et al., 2002; Varga et al., 2003). Structural and functional similarities between otoferlin and synaptotagmin-1 (Syt1), including their Ca2+-dependent interaction with syntaxin-1, SNAP-25, and CaV1.3 Ca2+ channels, suggested that otoferlin may act as a Syt1-like calcium sensor for fusion (Roux et al., 2006; Ramakrishnan et al., 2009; Baig et al., 2011). Consistent with this function, otoferlin regulates SNARE-mediated membrane fusion in vitro (Johnson and Chapman, 2010) and is required for hair cell synaptic vesicle exocytosis (Roux et al., 2006). Despite that in otoferlin-deficient mice IHC exocytosis is nearly abolished (Roux et al., 2006), immature IHCs express several synaptotagmins (Beurg et al., 2010; Johnson et al., 2010) and do not seem to require otoferlin for transmitter release during early stages of development (Beurg et al., 2010). Also, in mature IHCs from a mouse model of human deafness DFNB9, which show a large reduction in the expression of otoferlin, the rapid replenishment of the readily releasable pool (RRP) was impaired, but not the ability to fuse synaptic vesicles (Pangršič et al., 2010). In addition, reduced synaptic vesicle replenishment of the secondary releasable pool (SRP) was observed in IHCs from hypothyroid rats, which show suppressed otoferlin expression (Johnson et al., 2010) due to the presence of immature-type cells in adult cochlea (Uziel et al., 1983). To explain the molecular mechanism underlying the role of otoferlin in both vesicle fusion and replenishment of the RRP, a mechanism involving clearance of vesicles from active release sites has recently been proposed (Pangršič et al., 2012). Clearance of vesicles from a readily retrievable vesicle pool at active release sites was shown to occur through a first wave of clathrin-mediated endocytosis (CME; Hua et al., 2011), which is a form of vesicle retrieval previously thought to be too slow for endocytosis in IHCs.
Using high-resolution liquid chromatography coupled with mass spectrometry (MS), we have identified subunits of the adaptor protein complex 2 (AP-2), which are crucial components of CME (for review, see Hirst and Robinson, 1998) and are otoferlin interaction partners. Coimmunoprecipitation assays, in combination with fluorescence microscopy, confirmed the interaction of otoferlin and AP-2 in mature IHCs. Measurements of real-time changes in membrane capacitance in immature and mature IHCs suggested that a clathrin/AP-2-dependent endocytosis process is crucial for sustained endocytosis in mature but not immature IHCs. We propose that otoferlin may recruit AP-2/CME only after hearing onset. This would explain how otoferlin, in addition to its function in RRP clearance (Pangršič et al., 2012), could contribute to the efficient Ca2+-regulated vesicle resupply (Griesinger et al., 2005; Levic et al., 2011), which is crucial to sustain the indefatigable properties of mature IHCs (Griesinger et al., 2005; Schnee et al., 2011).
Materials and Methods
Animals.
Wistar rats and NMRI mice (Charles River) of either sex were used in this study. Hypothyroidism in rats was induced by treatment with methyl-mercapto-imidazol as described previously (Knipper et al., 2000; Friauf et al., 2008). Care and use of the animals as well as the experimental protocol were reviewed and approved by the animal welfare commissioner and the regional board for scientific animal experiments in Tübingen.
Tissue preparation.
For immunohistochemistry, cochleae were isolated, dissected, cryosectioned at 10 μm, and mounted on SuperFrost*/plus microscope slides at −20°C as described previously (Knipper et al., 2000). For whole-mount immunohistochemistry, the temporal bone of mature mouse was dissected on ice and immediately fixed using Zamboni's fixative (Stefanini et al., 1967) containing picric acid by infusion through the round and oval window and incubated for 15 min on ice, followed by rinsing with PBS and dissection of cochlear turns. Cochlear whole mounts were transferred to slides and, for further immunohistochemical labeling, attached to the surface using Cell-Tak (BD Bioscience). For RNA and protein isolation, cochleae and brains were dissected, immediately frozen in liquid nitrogen, and stored at −80°C before use.
Preparative affinity purification.
Total cochleae (600) isolated from adult rat and mice were ground in liquid nitrogen and suspended in 10 ml lysis buffer (10 mm Tris-HCl, pH 7.4, 1 mm EDTA, 1 mm iodoacetamide and protease inhibitors) using a Dounce homogenizer (tight pestle). After centrifugation for 3 min at 800 × g, the pellet was resuspended in 10 ml lysis buffer and centrifuged as before. The combined supernatants were then subjected to ultracentrifugation for 20 min at 150,000 × g and the resulting membrane pellet resuspended in 1 ml lysis buffer (8 mg protein/ml), shock frozen in liquid nitrogen, and stored at −80°C. For solubilization, 2 mg of membrane was resuspended in 2 ml Complexio Lyte (CL) detergent buffers (Logopharm; supplemented with protease inhibitors), CL-48 (rat) and CL-99 (mouse), incubated for 30 min at 4°C and ultracentrifuged at 150,000 × g for 10 min. Cleared solubilisates were incubated for 2 h with 25 μg of immobilized anti-otoferlin antibody (Schug et al., 2006) or pre-immunization IgG as background control. After two rounds of washing with the respective solubilization buffer, bound proteins were eluted with 1× nonreducing Laemmli buffer. Aliquots of each step were taken and subjected to denaturing SDS-PAGE/Western blot analysis to determine yields (self-cast mini-gels, Mini Protean 3 system; Bio-Rad; see Fig. 1B).
Figure 1.

AC-MS screen of otoferlin-associated proteins in rat and mouse cochlea. A, Illustration of the AP-MS workflow starting with collection of rat/mouse cochleae (1), membrane preparation (2) and solubilization (3), affinity purification (4), tryptic digest (5), LC-MS/MS analysis (6), and integration of m/z signals over time (PVs; 7) for quantitative evaluation; red color indicates the presence of otoferlin. B, Western blot resolving aliquots of rat and mouse cochlea membrane, soluble (S) and nonsoluble (P) fractions obtained with the indicated detergent buffers during solubilization, as well as unbound proteins (U) and eluates after AC with immobilized anti-otoferlin (E) and control IgG (C), respectively. Ten percent SDS-PAGE transferred to PVDF membrane, stained with anti-otoferlin/anti-rabbit-horseradish peroxidase and developed with ECL+; the band corresponding to otoferlin is marked by an arrow. C, Proteins specifically affinity-captured from both rat (solubilized with CL-48; y-axis) and mouse (solubilized with CL-99; x-axis) cochlea, plotted by their relative abundance (rPV) in the respective purification with anti-otoferlin versus IgG control (for calculation of rPV values see Materials and Methods); rPV values >10 indicate specific (co)-enrichment with otoferlin; dots represent individual proteins, subunits of the AP-2 complex are highlighted in red. D, E, RT-PCR analysis of AP-2. RT-PCR analysis of RNA samples from mature (P20) rat cochlea (D) and mature (P26) mouse IHCs (E). All four AP-2 subunits, Ap2a2, Ap2b1, Ap2m1, and Ap2s1, were found in the cochlea (D); in isolated IHCs, the two largest subunits Ap2a2, Ap2b1, were detected (E). Primer pairs each spanned at least one intron to distinguish between RNA and DNA signals. For more information see Materials and Methods.
Mass spectrometric analysis.
Samples obtained from affinity purifications were supplemented with 100 mm dithiothreitol, shortly run by SDS-PAGE gels, and the proteins visualized by silver staining. Gel lanes were then excised and in-gel digested with trypsin following a standard procedure (Pandey et al., 2000). Extracted peptides dissolved in 0.5% trifluoroacetic acid were loaded on a precolumn (C18 PepMap100, 5 mm; Dionex) of an UltiMate 3000 HPLC (Dionex), and an aqueous organic gradient was then applied for elution and separation of peptides (75 mm column packed with C18 beads), which were directly electrosprayed into an LTQ-FT or Orbitrap-XL mass spectrometer (Thermo Scientific; ion source: Proxeon) as described in (Müller et al., 2010). Fragment (MS/MS) spectra were acquired after cycles of Fourier transform mass spectrum (FT-MS) full scans in data-dependent mode with dynamic exclusion (30 s) enabled. Extracted MS/MS spectra were searched against the UniProt knowledge base (mouse, rat, human, release 2012_05) using Mascot (version 2.3.01; Matrix Science). We allowed common variable modifications and one missed tryptic cleavage; peptide tolerance was 5 ppm and MS/MS tolerance was 0.8 Da. Proteins that were identified by only one specific MS/MS spectrum or represented exogenous contaminations like keratins, trypsin, or immunoglobulins as well as proteins of mitochondrial and nuclear/ribosomal origin were not considered for further evaluation. Quantitative evaluation was performed using msInspect (Computational Proteomics Laboratory, Fred Hutchinson Cancer Research Center, Seattle, WA) as well as home-made software. First, m/z signal intensities corresponding to an individual eluting peptide were integrated over time (i.e., across consecutive FT-MS spectra; Fig. 1A, step 7) to obtain its peak volume (PV) as a proportional measure of this peptide's abundance. Relative amounts of proteins were then calculated based on the PVs of selected protein (isoform)-specific peptides using the TopCorr method detailed in (Bildl et al., 2012). Accordingly, the enrichment of a protein was calculated as median of the respective peptide PV ratios in affinity capture sample (AC) versus IgG control (rPV). At least two peptides with assigned PVs of 100,000 volume units were required to ensure validity; if no PV could be assigned to a peptide in the corresponding IgG control, the detection limit of the spectrometer (3000 volume units) was used as a minimum estimate. Proteins were regarded as specifically (co)purified when their rPV values were >10 (Fig. 1C).
mRNA isolation and reverse transcription-PCR.
For reverse transcription (RT)-PCR analysis, mRNA from rat cochlea was isolated as described previously (Heidrych et al., 2008, 2009). For single cell RT-PCR analysis, mouse IHCs were collected with micropipettes (Knirsch et al., 2007) and frozen in liquid nitrogen. For RT-PCR analysis of brain tissue, mRNA was extracted using the Qiagen RNeasy Kit according to the manufacturer's instructions. cDNA synthesis was performed using the iScriptcDNA synthesis kit. For amplification of specific fragments of the different AP-2 subunits using RT-PCR, the following oligonucleotides were used (5′ to 3′): Ap2a2, CCTTGGTCTGCCTATCGTGT and TGGGCTGGGACATTACTGAT (amplified length 232 bp); Ap2b1, CGCTCCTTCACCTACTCCTG and GTGAGTAAACGTCCCCGAAA (163 bp); Ap2m1, GCAAAATCAGCGAGGAGAAC and TTTCATCAGCTGTGCCTTTG (417 bp); and Ap2s1, CAGTTCGATGACGACGAGAA and CCAGGTCCAGTTCACAGACA (247 bp). As control, GAPDH was used and TCTACTGGCGTCTTCACCA and AGGAGACAACCTGGTCCTCAGT (550 bp). The resulting PCR products were analyzed on ethidium bromide agarose gels.
Protein isolation and analytical coimmunoprecipitation.
Adult rat cochlear tissue and brains were used for Western blotting and analytical coimmunoprecipitation (co-IP). Protein isolation and co-IP was performed as described before (Schug et al., 2006; Heidrych et al., 2008, 2009). AP-2 was immunoprecipitated using 2.5 μg of mouse anti-AP-2 antibody (BD Biosciences), whereas otoferlin was immunoprecipitated using 2.5–5 μg polyclonal rabbit anti-otoferlin antibody (Schug et al., 2006). To confirm expression of the relevant proteins in cell lysates used for the co-IP, a control of 30 μg of cell lysate was run in a separate lane (input). To ensure that the proteins were not producing false positive results by binding to the beads, we ran a bead control containing lysates plus beads without antibody. Electrophoresis and Western blotting for protein analysis was performed as described previously (Heidrych et al., 2008, 2009).
Immunohistochemistry.
Immunohistochemistry on cochlear sections (Heidrych et al., 2009) and on whole-mount preparation (Engel et al., 2006) was performed as described before. Antibodies directed against AP-2 (mouse, adaptin α; BD Biosciences), myosin VI (rabbit; Santa Cruz Biotechnology), otoferlin (rabbit, Schug et al., 2006; mouse, Abcam), and CtBP2 (rabbit; Cell Application) were used. Primary antibodies were detected with Cy3-conjugated (Jackson ImmunoResearch) or Alexa Fluor 488-conjugated secondary antibodies (Invitrogen). Sections were viewed using an Olympus BX61 microscope equipped with epifluorescence illumination. Images were acquired using a CCD camera and analyzed with cellSens software (Olympus Soft Imaging Solutions; OSIS). IHCs were imaged over a distance of 8 μm in an image stack along the z-axis (z-stack; z-stacks consisted of 30 layers with a z-increment of 0.276 μm) and three-dimensionally deconvoluted using cellSens ADVMLE deconvolution algorithm (OSIS) to reach confocal-like resolution. Immunohistochemical staining was performed on at least three different sets of animals. Raw data for the analysis of relative intensity for single layers of the displayed z-stacks were derived using cellSens' line profiling tool (OSIS). Data for the intensity profiles shown in Figures 2 and 5 were normalized to the maximum of the relative intensity separately for each fluorochrome. Similarity of intensity profiles of fluorochromes was judged by Pearson correlation.
Figure 2.
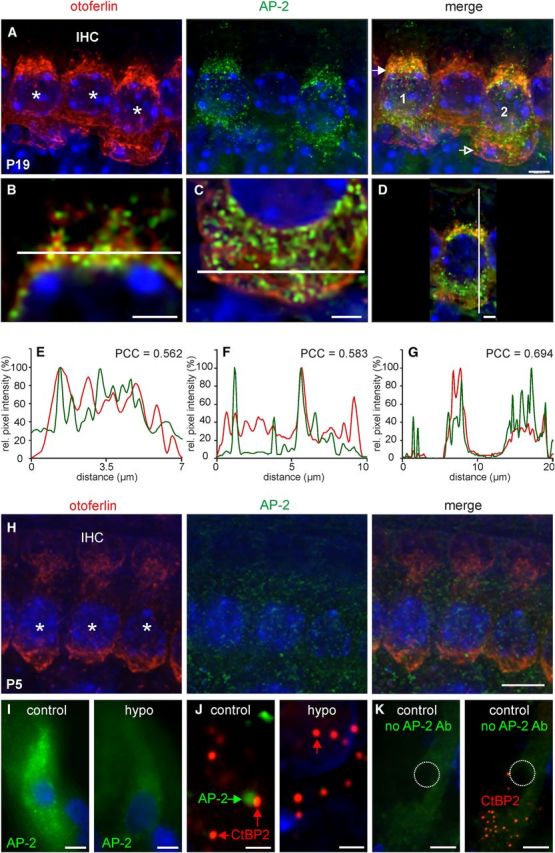
AP-2 protein expression in mature, immature, and hypothyroid rat cochlear IHCs. A, Otoferlin (red) and AP-2 (green) expression in mature (P19) mouse IHCs. AP-2 expression was found ubiquitously throughout the cytosol, whereas strong labeling of otoferlin was found predominantly at the supranuclear level (merge, closed arrow) and to a much lesser extent at the base of IHCs (merge, open arrow). Images display maximum intensity projections of all layers of a z-stack. Cell nuclei were counterstained with DAPI. Scale bar: 10 μm. B–D, To better display colabeling, merged images are shown with higher magnifications of single layers out of the deconvoluted z-stack in B from cell 1 (A, merge) and (C, D) from cell 2 (A, merge). Scale bars: (in B) 5 μm; (in C, D) 2 μm. E–G, Normalized intensity profiles are drawn from the white lines in (B–D) and show the relative pixel intensity along the line in regards to the distance and fluorescence wave length (red, Cy3; green, Alexa 488). Colocalization was analyzed by coinciding of maxima of the red and green channel by PCC. H, Otoferlin (red) and AP-2 (green) expression in immature (P5) mouse IHCs. Otoferlin and AP-2 were found to be much less expressed in immature IHCs. I–K, AP-2 is not expressed in P19 hypothyroid rat cochlear IHCs (I, J, hypo). Expression of CtBP2 is not changed under hypothyroidism (J). Lack of staining by omitting the primary AP-2 antibody demonstrated specificity of the antibody (Fig. 2K). Cell nuclei were counterstained with DAPI. Scale bars: (in A–I, K) 10 μm; (in J) 10 μm.
Figure 5.
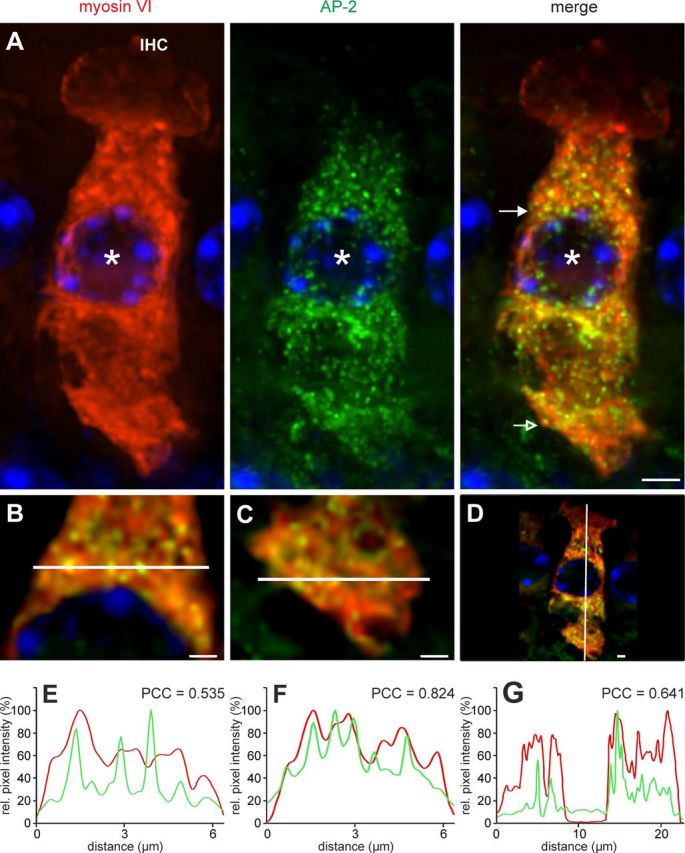
Colocalization of AP-2 protein and myosin VI in mature (P19) IHCs. A, Colocalization of myosin VI (red) and AP-2 (green) labeling was found ubiquitously throughout the IHC except the cuticular plate. Cell nuclei were counterstained with DAPI. Scale bar: 5 μm. B–D, To better display colocalization, merged images are shown displaying magnifications of single layers out of the deconvoluted z-stack in A, where B and E are derived from the supranuclear area (closed arrow in A, merge), C and F from the base (open arrow in A, merge), and D and G from a vertical cut. Scale bars: 2 μm. E–G, Normalized intensity profiles are drawn from the white lines in B–D and show the relative pixel intensity along the line with regards to the distance and fluorescence wave length (red, Cy3; green, Alexa 488). Colocalization was analyzed by coinciding of maxima of the red and green channel by PCC. Images display maximum intensity projections of all layers of a z-stack.
Electrophysiology.
Apical coil mouse IHCs were studied in acutely dissected organs of Corti from postnatal day 4 to 7 (P4 to P7) and P11 to P17. Animals were killed by cervical dislocation in accordance with UK Home Office regulations. Cochleae were dissected as previously described (Johnson et al., 2010) in normal extracellular solution containing the following (in mm): 135 NaCl, 5.8 KCl, 1.3 CaCl2, 0.9 MgCl2, 0.7 NaH2PO4, 5.6 d-glucose, 10 HEPES-NaOH, 2 sodium pyruvate, amino acids, and vitamins (pH 7.48; osmolality ∼308 mmol kg−1). The pipette intracellular solution contained the following (in mm): 106 Cs-glutamate, 20 CsCl, 3 MgCl2, 1 EGTA-CsOH, 5 Na2ATP, 0.3 Na2GTP, 5 HEPES-CsOH, 10 Na2-phosphocreatine (pH 7.3; osmolarity ∼294 mmol kg−1). Patch pipettes were coated with surfwax (Mr. Zog's Sex Wax) to minimize the fast patch pipette capacitance transient. All recordings were performed near body temperature (35−37°C) and in the presence of 30 mm tetraethylammonium and 15 mm 4-AP (Fluka) and linopirdine (80–100 μm; Tocris Bioscience) to block the K+ currents (Johnson et al., 2010). Data were recorded using an Optopatch amplifier (Cairn Research). Data acquisition was controlled by pClamp software using the Digidata 1322A board (Molecular Devices). Real-time changes in membrane capacitance (ΔCm) were measured using the Optopatch as previously described (Johnson et al., 2005, 2009, 2010). To examine the effect of dynamin on endocytosis, hair cells were superfused for at least 10 min before recording with the dynamin-1 and dynamin-2-specific blocker dynasore (dynasore hydrate; Sigma-Aldrich), which was also present throughout the recordings. Dynasore was dissolved in dimethylsulfoxide for stock solution (10 mm). For experiments, working solution containing 100 μm dynasore in the extracellular solution was acutely prepared.
Statistical analysis.
Statistical comparisons of means were made by a Student's two-tailed t test for the time constant of endocytosis and by two-way ANOVA, followed by the Bonferroni post-test. Unless otherwise specified, mean values are quoted ± SEM and p < 0.05 indicates statistical significance.
Results
To identify potential interaction partners of otoferlin in the cochlea, we set up a functional proteomic screen combining immuno-affinity capture (AC) with tandem MS (Fig. 1A). Membranes prepared from rat and mouse cochleae were used as starting materials and tested first for conditions that effectively solubilize otoferlin protein. As shown in Figure 1B, two detergent buffers were previously applied to isolate membrane protein complexes (CL-48; Berkefeld et al., 2006) and tested for the identification of interactions with cytoskeletal proteins (CL-99; Sharif-Naeini et al., 2009), which were used to quantitatively solubilize otoferlin from rat and mouse. These solubilisates were then subjected to affinity purification using an immobilized anti-otoferlin antibody with pre-immune IgG as control (Schug et al., 2006) resulting in two AC datasets. Western blot analysis demonstrated that otoferlin ACs were effective (although not depleting) and specific with respect to IgG control as shown in Figure 1B, mouse cochlea/CL-99; lane E versus C. Eluates from both ACs were then subjected to high-resolution liquid chromatography-MS/MS (LC-MS/MS) and evaluated as previously described (Müller et al., 2010; Bildl et al., 2012). These MS analyses confirmed that otoferlin was effectively and specifically purified: 53 (rat) and 52 (mouse) otoferlin-specific peptides were identified, corresponding to relative primary sequence coverage of 41.5 and 40.6%, respectively (data not shown), whereas no otoferlin peptides were detected in the IgG controls. To filter for biochemically robust interaction partners, proteins that were identified in both datasets (Table 1) were quantitatively evaluated using a label-free, PV-based method that offers an extended linear dynamic range (TopCorr method; Bildl et al., 2012; see Materials and Methods). Specificity and consistency of copurification for these proteins was determined by their enrichment in both ACs versus the corresponding IgG controls. Figure 1C shows the result as a 2D rPV plot of the 45 proteins considered specifically purified (rPV > 10) under both conditions (Table 1) together with otoferlin. Three of these proteins represented subunits of the AP-2 complex, namely α (AP2A2), β (AP2B1) and μ (AP2M1). The AP-2 σ-subunit (AP2S1) was also identified but did not yield sufficient m/z signals for reliable quantification (data not shown).
Table 1.
Proteins identified by MS-analysis of anti-otoferlin immuno-affinity capture from both rat (CL-48) and mouse (CL-99) cochlea membranes
| Accession | Protein | CL-99 mouse Specificity-ratio AP-Otof_vs_IgG | Identification MS/MS matches | Abundance normalized OT | CL-48 rat Specificity-ratio AP-Otof_vs_IgG | Identification MS/MS matches | Abundance normalized FT |
|---|---|---|---|---|---|---|---|
| OTOF_RAT | Otoferlin | 5337.72 | 77 | 471850 | 337.79 | 76 | 104813 |
| AT1A1_RAT | Sodium/potassium-transporting ATPase subunit α-1 | 3122.83 | 50 | 1205148 | 30.40 | 96 | 1255648 |
| AT1A3_RAT | Sodium/potassium-transporting ATPase subunit α-3 | 1465.36 | 43 | 879001 | 1837.14 | 88 | 1033972 |
| E41L2_MOUSE | Band 4.1-like protein 2 | 2140.55 | 84 | 1095333 | 1841.11 | 24 | 60963 |
| AINX_RAT | α-Internexin | 6867.19 | 50 | 685805 | 10.79 | 14 | 35343 |
| NFM_RAT | Neurofilament medium polypeptide | 416.25 | 53 | 365494 | 55.75 | 10 | 25277 |
| ZO1_MOUSE | Tight junction protein ZO-1 | 77.16 | 54 | 316586 | 268.71 | 4 | 5551 |
| NFH_MOUSE | Neurofilament heavy polypeptide | 204.23 | 43 | 778939 | 148.01 | 14 | 33070 |
| SYVC_RAT | Valine–tRNA ligase | 2213.23 | 30 | 222839 | 564.34 | 20 | 34709 |
| DYHC1_MOUSE | Cytoplasmic dynein 1 heavy chain 1 | 720.06 | 40 | 12029 | 83.15 | 5 | 259 |
| MAP1A_RAT | Microtubule-associated protein 1A | 1175.68 | 17 | 25327 | 1009.70 | 15 | 10000 |
| AP2B1_RAT | AP-2 complex subunit β | 12.80 | 18 | 77577 | 256.35 | 5 | 8702 |
| KTN1_MOUSE | Kinectin | 166.83 | 18 | 39455 | 18.94 | 5 | 3378 |
| SYEP_MOUSE | Bifunctional glutamate/proline–tRNA ligase | 220.31 | 15 | 30906 | 182.44 | 6 | 2017 |
| AT1B1_RAT | Sodium/potassium-transporting ATPase subunit β-1 | 2655.44 | 12 | 528908 | 163.22 | 9 | 960020 |
| THOC2_MOUSE | THO complex subunit 2 | 350.05 | 19 | 32697 | 128.76 | 1 | 1228 |
| SYDC_RAT | Aspartate–tRNA ligase, cytoplasmic | 663.92 | 15 | 40889 | 226.76 | 5 | 6012 |
| AP2M1_RAT | AP-2 complex subunit μ | 34.01 | 13 | 71248 | 349.04 | 7 | 31463 |
| G3P_RAT | Glyceraldehyde-3-phosphate dehydrogenase | 138.76 | 18 | 385951 | 116.67 | 1 | 5214 |
| DHB12_RAT | Estradiol 17-β-dehydrogenase 12 | 792.80 | 13 | 226082 | 204.47 | 5 | 14065 |
| TECR_RAT | Trans-2,3-enoyl-CoA reductase | 91.09 | 9 | 340731 | 201.07 | 9 | 109375 |
| S4A11_MOUSE | Sodium bicarbonate transporter-like protein 11 | 285.68 | 7 | 22901 | 574.01 | 10 | 25618 |
| G3BP1_MOUSE | Ras GTPase-activating protein-binding protein 1 | 1936.53 | 10 | 133366 | 249.11 | 6 | 12032 |
| AT2A2_RAT | Sarcoplasmic/endoplasmic reticulum calcium ATPase 2 | 343.57 | 5 | 8408 | 312.43 | 11 | 21373 |
| SYIC_MOUSE | Isoleucine–tRNA ligase, cytoplasmic | 897.52 | 12 | 19129 | 172.17 | 3 | 2509 |
| AP2A2_RAT | AP-2 complex subunit α-2 | 18.04 | 8 | 25002 | 52.97 | 6 | 5130 |
| VDAC2_RAT | Voltage-dependent anion-selective channel protein 2 | 1296.57 | 8 | 234270 | 463.79 | 5 | 48350 |
| RAB10_MOUSE | Ras-related protein Rab-10 OS = Mus musculus GN = Rab10 | 93.03 | 7 | 284745 | 205.67 | 6 | 56357 |
| CPT1A_RAT | Carnitine O-palmitoyltransferase 1, liver isoform | 252.10 | 6 | 18780 | 323.36 | 7 | 16289 |
| ABD12_MOUSE | Monoacylglycerol lipase ABHD12 | 39.37 | 5 | 34497 | 379.34 | 7 | 25231 |
| B3AT_RAT | Band 3 anion transport protein | 384.25 | 6 | 15168 | 66.29 | 5 | 2122 |
| DHB11_RAT | Estradiol 17-β-dehydrogenase 11 | 617.70 | 7 | 63653 | 245.96 | 3 | 7379 |
| S61A1_RAT | Protein transport protein Sec61 subunit α isoform 1 | 3168.89 | 6 | 144024 | 361.26 | 4 | 23034 |
| S4A4_RAT | Electrogenic sodium bicarbonate cotransporter 1 | 281.99 | 5 | 7828 | 116.72 | 5 | 4033 |
| GTR1_RAT | Solute carrier family 2, facilitated glucose transporter member 1 | 443.08 | 5 | 56109 | 94.27 | 4 | 26919 |
| ALG2_MOUSE | α-1,3/1,6-mannosyltransferase ALG2 | 390.40 | 5 | 8839 | 28.93 | 4 | 8633 |
| NSF_MOUSE | Vesicle-fusing ATPase | 483.27 | 6 | 11228 | 99.26 | 2 | 1225 |
| VDAC3_RAT | Voltage-dependent anion-selective channel protein 3 | 1165.88 | 5 | 53167 | 519.99 | 3 | 36158 |
| SYRC_RAT | Arginine–tRNA ligase, cytoplasmic | 431.76 | 3 | 5835 | 147.08 | 5 | 1974 |
| THOC6_MOUSE | THO complex subunit 6 homolog | 1172.00 | 5 | 26504 | 68.87 | 2 | 1519 |
| TMM33_MOUSE | Transmembrane protein 33 | 263.85 | 4 | 55563 | 218.08 | 1 | 9988 |
| ZNT1_MOUSE | Zinc transporter 1 | 465.97 | 3 | 9477 | 463.94 | 2 | 9665 |
| PTSS1_RAT | Phosphatidylserine synthase 1 | 299.75 | 2 | 19963 | 374.61 | 3 | 9647 |
| SRP72_HUMAN | Signal recognition particle 72 kDa protein | 288.12 | 2 | 4206 | 362.12 | 3 | 10462 |
| NCKP1_RAT | Nck-associated protein 1 | 250.09 | 2 | 2138 | 60.87 | 1 | 526 |
| MBB1A_RAT | Myb-binding protein 1A | 175.19 | 2 | 2179 | 34.85 | 1 | 223 |
| MYP0_RAT | Myelin protein P0 | 16.21 | 43 | 37234494 | 2.61 | 68 | 10627302 |
| PLEC_RAT | Plectin | 33.62 | 102 | 51673 | 0.02 | 2 | 1297 |
| TBB5_MOUSE | Tubulin β-5 chain | 229.06 | 78 | 2449670 | 2.44 | 18 | 133357 |
| CN37_RAT | 2′,3′-cyclic-nucleotide 3′-phosphodiesterase | 23.19 | 37 | 1789388 | 3.25 | 37 | 423459 |
| NFL_RAT | Neurofilament light polypeptide | 617.59 | 44 | 1387637 | 3.47 | 21 | 90778 |
| MBP_RAT | Myelin basic protein | 16.88 | 43 | 10126599 | 2.94 | 9 | 326297 |
| HSP7C_RAT | Heat shock cognate 71 kDa protein | 90.86 | 36 | 489906 | 7.47 | 8 | 29964 |
| COCH_MOUSE | Cochlin | 40.67 | 24 | 241722 | 1.24 | 13 | 57796 |
| CKAP4_MOUSE | Cytoskeleton-associated protein 4 | 28.46 | 24 | 206725 | 2.56 | 5 | 12684 |
| MYO6_MOUSE | Unconventional myosin-VI | 13.15 | 25 | 84374 | 0.11 | 2 | 2127 |
| MYPR_MOUSE | Myelin proteolipid protein | 14.54 | 12 | 1413421 | 2.98 | 11 | 251283 |
| HHATL_MOUSE | Protein-cysteine N-palmitoyltransferase HHAT-like protein | 2549.21 | 11 | 207284 | 4.96 | 12 | 90049 |
| S12A2_MOUSE | Solute carrier family 12 member 2 | 454.19 | 13 | 33522 | 2.75 | 5 | 2656 |
| MYO1C_RAT | Unconventional myosin-Ic | 398.84 | 6 | 3033 | 0.29 | 2 | 2183 |
| S27A1_RAT | Long-chain fatty acid transport protein 1 | 0.00 | 5 | 8032 | 223.58 | 2 | 2935 |
| EAA1_RAT | Excitatory amino acid transporter 1 | 0.00 | 2 | 208 | 4.91 | 3 | 13989 |
| UIF_RAT | UAP56-interacting factor | 0.00 | 2 | 1783 | 97.93 | 1 | 3176 |
Columns (left to right): database entry, protein name, purification specificity by the respective protein ratio (rPV, see Materials and Methods), identification by the number of database-matched MS/MS spectra and estimated molecular abundance based on the abundancenorm score (calculated as the sum of PVs divided by the number of MS-accessible amino acids of the respective protein; Müller et al., 2010). Proteins with specificity ratios >10 (bold) were displayed in Fig. 1C.
We then analyzed the expression of AP-2 at the transcriptional level of mature animals using RT-PCR with RNA from whole rat cochlea (P20) or isolated mouse IHCs (P26) to confirm coexpression with otoferlin. The amplification products of Ap2a2, Ap2b1, Ap2m1, and Ap2s1 with the appropriate size were found in the mature cochlea (Fig. 1D). Moreover, the two larger subunits Ap2a2 and Ap2b1 could be amplified in isolated IHCs of the mature cochlea (Fig. 1E).
Using the anti-otoferlin antibody in combination with a monoclonal mouse anti-AP-2 antibody, high-resolution deconvolution fluorescence microscopy revealed a profound AP-2 labeling in mature IHCs (P19) that largely colocalized with otoferlin in the apical and in the basal pole of IHCs (Fig. 2A). Higher magnification (Fig. 2B–D) and relative pixel intensity profiles (Fig. 2E–G) derived from the fluorescent signals in Figure 2, B–D, showed several coinciding intensity maxima of AP-2 and otoferlin staining on the supranuclear level (Fig. 2B,E, Pearson correlation coefficient, PCC = 0.562), the basal pole region (Fig. 2C,F, PCC = 0.583), and in a vertical section from apex to base of an IHC (Fig. 2D,G, PCC = 0.694). This localization profile was consistently found in mature IHCs without differences along the tonotopic axis in three biological replicates. In immature (P5) IHCs, prepared and immunostained as a whole-mount preparation at the same day and analyzed with fluorescence microscopy under similar conditions, otoferlin was expressed at a much lower level than in the mature IHC, confirming previous observations (Roux et al., 2006; Beurg et al., 2010). Also, AP-2 was found to be much less expressed at P5 (Fig. 2H) compared with mature (P19) IHCs.
Interestingly, in hypothyroid rat IHCs (P19), previously shown to lack otoferlin and to exhibit impaired replenishment of SRP (Johnson et al., 2010), expression of AP-2 was also not detectable (Fig. 2I, hypo). In control animals, AP-2-positive staining was found in close association with the ribbon marker CtBP2. Unlike AP-2 under hypothyroid conditions, CtBP2 was expressed in the absence of TH (Fig. 2J). Specificity of the AP-2 antibody was demonstrated by omitting the primary AP-2 antibody (Fig. 2K).
Aiming to compare the relationship of AP-2 and otoferlin with the position of ribbons, respectively of otoferlin with AP-2, coimmunolabeling in cochlear whole-mount preparations was performed in adult mice. RIBEYE/CtBP2, a component of synaptic ribbons, was coimmunolabeled with either AP-2 (Fig. 3A) or otoferlin (Fig. 3B) and these profiles were compared with the protein distribution of AP-2 and otoferlin. The ribbon marker CtBP2 is exclusively expressed at the IHC base (Fig. 3A,B, red), whereas AP-2 (Fig. 3A, green) and otoferlin (Fig. 3B, green) are distributed over the entire IHC cell body. The strong overlapping colabeling of otoferlin (red) and AP-2 (green) in the apical but also in the basal pole of IHCs (Fig. 3C) significantly differed from colabeling of AP-2 and CtBP2 (Fig. 3A1,A2) or otoferlin and CtBP2 (Fig. 3B1,B2). Taking into account the theoretical resolution of our microscope system in the horizontal plane (211 nm for Cy3 and 192 nm for Alexa 488 (Zampini et al., 2010) and 46% overlap as a criterion for colocalization due to spread of diffraction (for review, see Zampini et al., 2010), only a minor number of ribbons fulfills the criteria of overlap for both otoferlin/CtBP2 and AP-2/CtBP2 as shown in two examples (Fig. 3A1,A2,B1,B2). This underlines a close positional overlap of otoferlin with AP-2 (Fig. 3C), and partial overlap of these proteins with CtBP2.
Figure 3.

Comparison of the protein localization of AP-2 and otoferlin with the ribbon marker CtBP2. A–C, Whole-mount preparations of mice IHCs (P18) coimmunolabeled with AP-2 and CtBP2 (A), otoferlin and CtBP2 (B), or otoferlin and AP-2 (C). AP-2 (A1, A2) and otoferlin (B1, B2) showed only minor colocalization with CtBP2 at the basal pole of IHCs as demonstrated in two examples each. In contrast, otoferlin and AP-2 largely colocalized in the apical (C1) and in the basal pole (C2) of IHCs. Cell nuclei were counterstained with DAPI. Scale bars: (in A–C) 20 μm; (in A1,A2-C1,C2) 5 μm.
The interaction of otoferlin with AP-2 complex subunits in brain (Fig. 4A) and cochlear tissue (Fig. 4B) was confirmed using analytical co-IPs with a polyclonal rabbit anti-otoferlin antibody and a monoclonal mouse anti-α-adaptin antibody. In Western blot analysis, both antibodies detected otoferlin (Fig. 4A, lane 1, input, B, lane 1, input) and AP-2 polypeptides (α-1 and α-2, also known as α-adaptin A and α-adaptin C; Fig. 4A, lane 3, input, B, lane 2, input) in brain and cochlear lysates, respectively. The detection of a 230 and 240 kDa otoferlin double band in cochlear tissue is in accordance with (Yasunaga et al., 2000), who described that OTOF encodes multiple long and short isoforms. Also, Schug et al. (2006) described an otoferlin double band (230 and 240 kDa) in cochlear tissue and only the 230 kDa polypeptide in rat brain. The α-adaptin antibody recognized a 105 and a 112 kDa double band in rat brain and cochlear protein lysates, corresponding to the AP-2 complex subunits α-1 and α-2, also known as α-adaptin A and α-adaptin C (Robinson, 1987, 1989; Ball et al., 1995).
Figure 4.
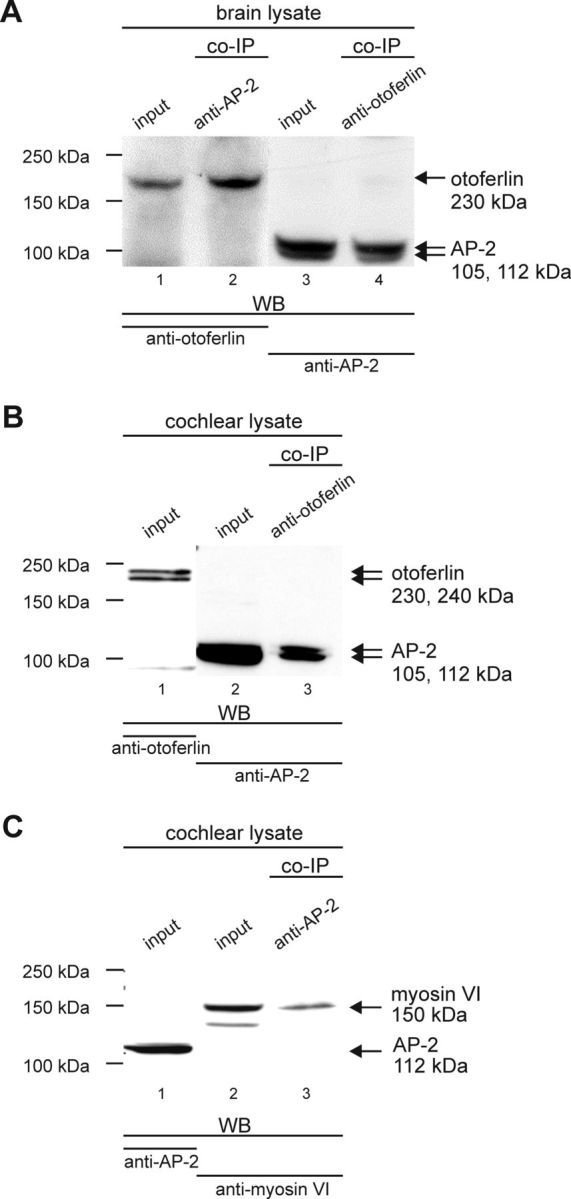
Analytical coimmunoprecipitation experiments in brain and cochlear lysate. A, Brain lysate. Lanes 1 and 3, Containing the brain lysate used for the co-IP (input), confirm the expression of otoferlin with the estimated size of ∼230 kDa and the expression of AP-2 with the estimated size of ∼105 and ∼112 kDa in the brain lysate, respectively (input). Lane 2, Otoferlin was coimmunoprecipitated from brain lysate by the AP-2-specific antibody. Lane 4, The otoferlin-specific antibody coimmunoprecipitated AP-2. B, Cochlear lysate. Lanes 1 and 2 (input), confirm the expression of otoferlin with the estimated size of ∼230 and ∼240 kDa (Schug et al., 2006) and the expression of AP-2 with the estimated size of ∼105 and ∼112 kDa (Ball et al., 1995) in the cochlear lysate, respectively. Lane 3, AP-2 was coimmunoprecipitated from cochlear lysate by the otoferlin-specific antibody. C, Cochlear lysate. Lanes 1 and 2 (input), Show the expression of AP-2 with an estimated size of ∼112 kDa and myosin VI with an estimated size of ∼150 kDa in the cochlear lysate, respectively. Lane 3, Myosin VI was coimmunoprecipitated from cochlear lysate by the AP-2-specific antibody.
Incubation of brain lysate with immobilized anti-AP-2 antibody resulted in co-IP of otoferlin (Fig. 4A, lane 2, co-IP). In reciprocal co-IP experiments using anti-otoferlin antibody, AP-2 polypeptides were found in both brain and cochlear lysates (Fig. 4A, lane 4, co-IP, B, lane 3, co-IP). These results corroborate the association of otoferlin with the AP-2 protein complex in cochlear tissue as well as mature brain, and suggest a more general role of otoferlin in CME.
CME has been shown to involve assembly of AP-2 with myosin VI (Collaco et al., 2010). Moreover, otoferlin was also shown to interact with myosin VI in IHCs (Heidrych et al., 2009). Consistent with these observations, MYO6 was found specifically co-enriched in the otoferlin AC under higher stringency conditions (Fig. 1B, mouse CL-99; data not shown). Finally, analytical co-IP from rat cochlear lysates using the anti-AP-2 antibody showed coprecipitation with myosin VI (doublet band at 150 kDa; Fig. 4C, lane 3, co-IP) in accordance with a previously described doublet at ∼150 kDa (Breckler et al., 2000). We cannot exclude that the lower band detected by the myosin VI antibody in the input is a cleavage product of myosin VI. This suggested that otoferlin, AP-2, and myosin VI might be part of a larger protein complex.
To further characterize interaction of AP-2 and myosin VI in cochlear IHCs, we performed immunohistological staining in cochlear whole-mount preparations of adult mice (Fig. 5) using anti-AP-2 and anti-myosin VI antibodies along with high-resolution deconvolution fluorescence microscopy. Labeling for myosin VI (Fig. 5A, red) and AP-2 (Fig. 5A, green) and their colocalization (Fig. 5A, merge) in IHCs were shown in a cochlear whole-mount preparation of an adult mouse (P19). Higher magnification revealed that AP-2 and myosin VI were colocalized all over the IHC cytoplasm (Fig. 5B). This almost complete overlap is displayed by driving the intensity profile as described above, when cutting horizontal lines through the IHC region above the nucleus (Fig. 5B,E; PCC = 0.535) and at the base (Fig. 5C,F; PCC = 0.824). The greatly overlapping intensity maxima display colocalization, which was found throughout the cytoplasm. The similar amount of colocalization in the apex and base of the IHC is also displayed on a vertical cut (Fig. 5D,G; PCC = 0.641). In summary, these findings indicate a large colocalization of otoferlin with AP-2 as well as myosin VI and AP-2 in all analyzed IHC regions.
The possible involvement of clathrin-dependent endocytosis in IHCs was tested in IHCs by superfusing the drug dynasore, a noncompetitive inhibitor of dynamin GTPase activity, which triggers the fission of clathrin-coated pits via AP-2 (Macia et al., 2006; Linden, 2012) and blocks all forms of compensatory synaptic vesicle endocytosis (Newton et al., 2006). We tested whether vesicle release from either the RRP or SRP of immature and mature IHCs was limited by the relative pool refilling rates measuring ΔCm using repetitive stimulation (Johnson et al., 2008), which provides an indirect measurement for endocytosis. Figure 6, A and B, show examples of ΔCm in mature IHCs in response to trains of 50 ms or 1 s steps to −11 mV, which are used to investigate the depletion of the RRP and SRP, respectively. Following repeated 50 ms steps, the cumulative ΔCm showed a near linear increase in both control and in the presence of dynasore (Fig. 6C), indicating that the RRP is able to replenish following each step as also evident from the individual ΔCm (Fig. 6E). Following long-lasting (1 s) voltage steps, the cumulative ΔCm for the SRP showed saturation that was significantly (p < 0.0001) more pronounced in the presence of dynasore than in control condition (Fig. 6D). The larger depletion of the SRP in IHCs in the presence of dynasore, compared with control cells, was also evident from the individual ΔCm (Fig. 6F). When ΔCm following 50 ms or 1 s steps to −11 mV was investigated in immature P4 to P7 IHCs, the cumulative ΔCm in the absence or presence of dynasore were not different, shown for individual ΔCm (Fig. 6G,H) or for cumulative ΔCm for the SRP (Fig. 6D, inset). These results indicate that synaptic vesicle refilling of the SRP in adult, but not immature IHCs, was significantly reduced by dynasore.
Figure 6.
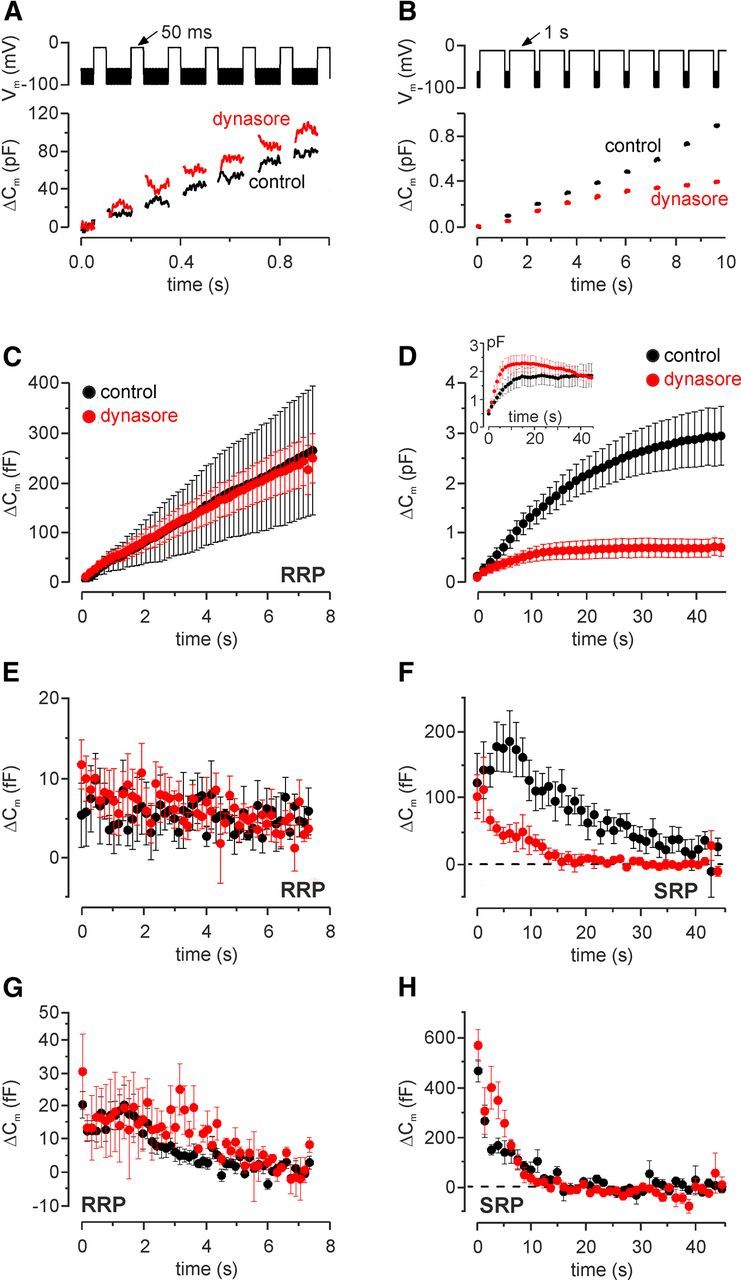
Effect of dynasore on vesicle pool replenishment in IHCs. A, B, Repetitive voltage steps to −11 mV for 50 ms (A, interstep interval: 100 ms) or 1 s (B, interstep interval: 200 ms) were used to elicit the RRP and SRP, respectively. For clarity, only the first few steps are shown. The top shows the respective voltage protocol used. C, Average cumulative ΔCm values obtained in response to the 50 ms protocol from 3 control (P13) and 11 dynasore-treated (P11–P17) IHCs. D, Average cumulative ΔCm in response to the 1 s protocol from seven control (P13–P16) and seven dynasore-treated (P13–P17) IHCs. Inset, Cumulative ΔCm from four control (P4–P7) and four dynasore-treated (P6–P7) immature IHCs. E, Individual ΔCm values measured for the RRP after each voltage step from IHCs shown in C. F, Individual ΔCm values for the SRP measured after each voltage step from IHCs shown in D. G, H, Vesicle pool replenishment in immature mouse IHCs treated with dynasore. Individual ΔCm values measured for the RRP in nine control (P4–P6) and three dynasore-treated (P6–P7) IHCs (G) and SRP (H; see inset in D) as described in E and F, respectively.
Discussion
Otoferlin, a calcium sensor for synaptic vesicle release at hair cell ribbon synapses (Yasunaga et al., 2000; Roux et al., 2006; Ramakrishnan et al., 2009), is responsible for auditory neuropathy/dyssynchrony (Varga et al., 2003). In addition to being involved in exocytosis, we found that in mature IHCs, otoferlin interacts with AP-2, a protein complex essential for endocytic clathrin-coated pit and coated-vesicle formation (Keyel et al., 2008; Rappoport, 2008; Boucrot et al., 2010). Moreover, we demonstrated that sustained exocytosis (SRP) is inhibited by the CME blocker dynasore. In IHCs, AP-2 also colocalizes and interacts with myosin VI, which also binds to clathrin-coated pits and is essential for CME (Puri, 2009; Yu et al., 2009). These findings indicate that otoferlin, by coupling exocytosis and endocytosis, could provide the basis for the indefatigable sustained exocytosis of adult IHCs (von Gersdorff and Matthews, 1994).
MS analysis from mature (>P25) cochleae revealed that otoferlin is able to bind AP-2 subunits. The AP-2 adaptor complex is connected to clathrin-coated vesicles budding from the plasma membrane and consists of four distinct subunits: two subunits with the Mr of ∼100 kDa (α- and β-subunit, also known as α- and β-adaptin), one with the Mr of ∼50 kDa (μ-subunit), and a small one with the Mr ∼17 kDa (σ-subunit). Two isoforms of α-adaptin (Ap2a1 and Ap2a2) encoded by two different genes have been described in mammalian cells. Whereas α-adaptins are implicated in protein–protein interactions, the current consensus is that the β-subunit (Ap2b1) plays a major role in clathrin binding, while the μ-subunit (Ap2m1) is involved in receptor binding and signal recognition (for reviews see, Hirst and Robinson, 1998; Pearse et al., 2000). We provided evidence that Ap2a2, Ap2b1, Ap2m1, and Ap2s1 together interact with otoferlin. This was confirmed by RT-PCR showing that Ap2a2 and Ap2b1 are expressed in mature IHCs. Our MS analysis agrees with previous findings showing that while Ap2a2 is ubiquitously expressed, Ap2a1 is limited to neuronal tissues (Robinson, 1987, 1989).
In adult IHCs, otoferlin and AP-2 colocalize. Otoferlin and AP-2 are close to CtBP2 and the expression level of both otoferlin and AP-2 is upregulated with cochlear maturation. Increased expression of otoferlin in IHCs during maturation, confirming previous findings (Roux et al., 2006; Beurg et al., 2010), has been linked to an improved Ca2+-dependent resupply of vesicles observed after the onset of hearing (Levic et al., 2011). The resupply of vesicles is limited by the RRP or SRP refilling rates that can be determined by measuring ΔCm following repetitive stimulation protocols as a measure for the endocytosis capacity (Johnson et al., 2008). We show a significant reduction in sustained exocytosis when the CME blocker dynasore was used in adult IHCs, but not in immature cells. Dynasore has been shown to block all types of CME in rodent hippocampal neurons (Macia et al., 2006; Newton et al., 2006). This, together with the upregulation of AP-2 and otoferlin over development, suggests that the coupling between otoferlin and CME is likely to be a special property of IHCs around the onset of hearing. This hypothesis was further confirmed by the fact that in adult rats raised under hypothyroid conditions, IHCs resemble an immature state, retaining low expression levels of otoferlin and AP-2 throughout their life, sustained exocytosis was impaired (Johnson et al., 2010). In the “immature” condition of hypothyroid animals, the efficient recruitment of vesicles from the larger SRP could be uncoupled from the Ca2+-dependent otoferlin-mediated vesicle resupply. Indeed, a more efficient Ca2+-dependent refilling of vesicles from internalized membrane in the apical IHC region was observed in mature IHCs (Griesinger et al., 2002, 2005). This Ca2+-dependent improvement of vesicle refilling might be the basis of the approved Ca2+ sensitivity of vesicle replenishment, which occurs with IHC maturation (Levic et al., 2011).
The additional interaction of otoferlin with myosin VI, which is involved in CME (Puri, 2009), further supports an involvement of the otoferlin-AP-2-myosin VI complex in endocytosis at the basal part and membrane internalization at the apical part of IHCs (Griesinger et al., 2002, 2005). This agrees with previous observations showing that coated vesicles were found both at the synaptic region (IHC basal pole) and in all components of the Golgi complex located toward the apical pole of mature IHCs (Siegel and Brownell, 1986). Ca2+-dependent vesicle replenishment was described in hair cells (Moser and Beutner, 2000; Spassova et al., 2004; Cho et al., 2011; Graydon et al., 2011) and occurs with a timescale of ∼15–20 s (Beutner et al., 2001; Griesinger et al., 2005). This was previously assumed to be too rapid to be achieved by a CME process that was thought to operate on a timescale of minutes (Heuser and Reese, 1973; Henkel and Almers, 1996; Granseth et al., 2006). However, this view has recently changed with an increasing number of studies showing that CME can occur within seconds rather than minutes, shown for retinal and chromaffin cells (time constant: τ < 10 s; (Jockusch et al., 2005; Tsai et al., 2009).
Syt1, a major Ca2+ sensor for vesicle fusion at conventional synapses (Südhof, 2002), also seems to couple both endocytosis and exocytosis (Yao et al., 2012a), and in IHCs seems to be only expressed in immature IHCs (Beurg et al., 2010; Johnson et al., 2010). Similar to otoferlin in the mature IHC (Pangršič et al., 2010), Syt1 has been suggested to affect RRP recovery but not its release (Beurg et al., 2010). The deaf pachanga mouse (OtofPga/Pga; Schwander et al., 2007) is a mouse model of human deafness DFNB9, which carries an Otof missense mutation and causes a reduction in otoferlin protein levels in IHCs and a change in otoferlin's secondary structure. While the impaired replenishment of vesicles in the pachanga mouse was discussed to be the result of a presumptive “failure of proper priming of vesicles” for the replenishment of the RRP (Pangršič et al., 2010), a function of otoferlin in clearing exocytotic material from the release toward the perisynaptic sites of endocytosis was not excluded in the same study. It was stated that the reduced sustained exocytosis and smaller fast flush response observed in OtofPga/Pga IHCs might also result from a major contribution of a slowly releasable pool of vesicles to sustained exocytosis (Pangršič et al., 2010). This model suggests that there is impaired clearance of excessive vesicle membrane from the release sites in synaptotagmin mutant mice, rather than from a defect in vesicle fusion (Hosoi et al., 2009). The C2B domain of Syt1 was shown to bind the μ-subunit of AP-2 (Chapman et al., 1998; Haucke et al., 2000; Poskanzer et al., 2006), thereby indicating Ca2+ dependence of vesicle fission during the CME process (Yao et al., 2012b). However, our findings imply that a CME mechanism is unlikely to be present in immature IHCs. The predominant expression of otoferlin in the plasma membrane of IHCs (Schug et al., 2006; Heidrych et al., 2008, 2009), together with its ability to interact with Ca2+ channels (Ramakrishnan et al., 2009), to bind to AP-2 and myosin VI, and the possible presence of a CME mechanism inhibited by dynasore in mature IHCs, indicate that otoferlin likely functions to induce retrieval of vesicles from the plasma membrane, as well as to support vesicle fusion. The observation that in the brain (Roux et al., 2006; Schug et al., 2006), otoferlin can also interact with AP-2 (present study) suggests a more ubiquitous role for otoferlin in Ca2+-dependent membrane vesicle retrieval, since ∼90% of all clathrin-coated vesicles in neurons are involved in synaptic vesicle retrieval (Girard et al., 2005). So far, no members of the adaptin family have been linked to hearing deficits. However, in 20 Palestinian children with prelingual nonsyndromic hearing loss, five genomic regions were identified that may harbor novel genes for human hearing loss (Shahin et al., 2010). One of these genomic regions is localized to 17p12–q11.2 (DFNB85), the approximate position where the AP-2-β (CLAPB1) large subunit has been mapped (17q11.2–q12), indicating a possible link between adaptin proteins and hearing loss.
Footnotes
This work was funded by the Marie Curie Research Training Network CavNET (MRTN-CT-2006–035367), the Deutsche Forschungsgemeinschaft (DFG-Kni-316–4-1), the Werner Reichardt Centre for Integrative Neuroscience (CIN) at the Eberhart Karls University of Tübingen. The CIN is an Excellence Cluster funded by the Deutsche Forschungsgemeinschaft within the framework of the Excellence Initiative (EXC 307), and the Sonderforschungsbereich SFB 894 (TP A8 to J.E.), a Baden-Württemberg research grant, a graduate program grant of the University of Tübingen, and the Wellcome Trust (088719 and 09189 to W.M.). W.M. is a Royal Society University Research Fellow. We thank K. Rohbock for excellent technical assistance and C. Müller and W. Bildl for their support of the AC-MS experiments.
The authors declare no competing financial interests.
References
- Baig SM, Koschak A, Lieb A, Gebhart M, Dafinger C, Nürnberg G, Ali A, Ahmad I, Sinnegger-Brauns MJ, Brandt N, Engel J, Mangoni ME, Farooq M, Khan HU, Nürnberg P, Striessnig J, Bolz HJ. Loss of CaV1.3 (CACNA1D) function in a human channelopathy with bradycardia and congenital deafness. Nat Neurosci. 2011;14:77–84. doi: 10.1038/nn.2694. [DOI] [PubMed] [Google Scholar]
- Ball CL, Hunt SP, Robinson MS. Expression and localization of α-adaptin isoforms. J Cell Sci. 1995;108:2865–2875. doi: 10.1242/jcs.108.8.2865. [DOI] [PubMed] [Google Scholar]
- Berkefeld H, Sailer CA, Bildl W, Rohde V, Thumfart JO, Eble S, Klugbauer N, Reisinger E, Bischofberger J, Oliver D, Knaus HG, Schulte U, Fakler B. BKCa-Cav channel complexes mediate rapid and localized Ca2+-activated K+ signaling. Science. 2006;314:615–620. doi: 10.1126/science.1132915. [DOI] [PubMed] [Google Scholar]
- Beurg M, Michalski N, Safieddine S, Bouleau Y, Schneggenburger R, Chapman ER, Petit C, Dulon D. Control of exocytosis by synaptotagmins and otoferlin in auditory hair cells. J Neurosci. 2010;30:13281–13290. doi: 10.1523/JNEUROSCI.2528-10.2010. [DOI] [PMC free article] [PubMed] [Google Scholar]
- Beutner D, Voets T, Neher E, Moser T. Calcium dependence of exocytosis and endocytosis at the cochlear inner hair cell afferent synapse. Neuron. 2001;29:681–690. doi: 10.1016/S0896-6273(01)00243-4. [DOI] [PubMed] [Google Scholar]
- Bildl W, Haupt A, Müller CS, Biniossek ML, Thumfart JO, Huber B, Fakler B, Schulte U. Extending the dynamic range of label-free mass spectrometric quantification of affinity purifications. Mol Cell Proteomics. 2012;11:M111.007955. doi: 10.1074/mcp.M111.007955. [DOI] [PMC free article] [PubMed] [Google Scholar]
- Boucrot E, Saffarian S, Zhang R, Kirchhausen T. Roles of AP-2 in clathrin-mediated endocytosis. PLoS One. 2010;5:e10597. doi: 10.1371/journal.pone.0010597. [DOI] [PMC free article] [PubMed] [Google Scholar]
- Breckler J, Au K, Cheng J, Hasson T, Burnside B. Novel myosin VI isoform is abundantly expressed in retina. Exp Eye Res. 2000;70:121–134. doi: 10.1006/exer.1999.0758. [DOI] [PubMed] [Google Scholar]
- Chapman ER, Desai RC, Davis AF, Tornehl CK. Delineation of the oligomerization, AP-2 binding, and synprint binding region of the C2B domain of synaptotagmin. J Biol Chem. 1998;273:32966–32972. doi: 10.1074/jbc.273.49.32966. [DOI] [PubMed] [Google Scholar]
- Cho S, Li GL, von Gersdorff H. Recovery from short-term depression and facilitation is ultrafast and Ca2+ dependent at auditory hair cell synapses. J Neurosci. 2011;31:5682–5692. doi: 10.1523/JNEUROSCI.5453-10.2011. [DOI] [PMC free article] [PubMed] [Google Scholar]
- Collaco A, Jakab R, Hegan P, Mooseker M, Ameen N. α-AP-2 directs myosin VI-dependent endocytosis of cystic fibrosis transmembrane conductance regulator chloride channels in the intestine. J Biol Chem. 2010;285:17177–17187. doi: 10.1074/jbc.M110.127613. [DOI] [PMC free article] [PubMed] [Google Scholar]
- Engel J, Braig C, Rüttiger L, Kuhn S, Zimmermann U, Blin N, Sausbier M, Kalbacher H, Münkner S, Rohbock K, Ruth P, Winter H, Knipper M. Two classes of outer hair cells along the tonotopic axis of the cochlea. Neuroscience. 2006;143:837–849. doi: 10.1016/j.neuroscience.2006.08.060. [DOI] [PubMed] [Google Scholar]
- Friauf E, Wenz M, Oberhofer M, Nothwang HG, Balakrishnan V, Knipper M, Löhrke S. Hypothyroidism impairs chloride homeostasis and onset of inhibitory neurotransmission in developing auditory brainstem and hippocampal neurons. Eur J Neurosci. 2008;28:2371–2380. doi: 10.1111/j.1460-9568.2008.06528.x. [DOI] [PubMed] [Google Scholar]
- Girard M, Allaire PD, McPherson PS, Blondeau F. Non-stoichiometric relationship between clathrin heavy and light chains revealed by quantitative comparative proteomics of clathrin-coated vesicles from brain and liver. Mol Cell Proteomics. 2005;4:1145–1154. doi: 10.1074/mcp.M500043-MCP200. [DOI] [PubMed] [Google Scholar]
- Granseth B, Odermatt B, Royle SJ, Lagnado L. Clathrin-mediated endocytosis is the dominant mechanism of vesicle retrieval at hippocampal synapses. Neuron. 2006;51:773–786. doi: 10.1016/j.neuron.2006.08.029. [DOI] [PubMed] [Google Scholar]
- Graydon CW, Cho S, Li GL, Kachar B, von Gersdorff H. Sharp Ca2+ nanodomains beneath the ribbon promote highly synchronous multivesicular release at hair cell synapses. J Neurosci. 2011;31:16637–16650. doi: 10.1523/JNEUROSCI.1866-11.2011. [DOI] [PMC free article] [PubMed] [Google Scholar]
- Griesinger CB, Richards CD, Ashmore JF. Fm1–43 reveals membrane recycling in adult inner hair cells of the mammalian cochlea. J Neurosci. 2002;22:3939–3952. doi: 10.1523/JNEUROSCI.22-10-03939.2002. [DOI] [PMC free article] [PubMed] [Google Scholar]
- Griesinger CB, Richards CD, Ashmore JF. Fast vesicle replenishment allows indefatigable signalling at the first auditory synapse. Nature. 2005;435:212–215. doi: 10.1038/nature03567. [DOI] [PubMed] [Google Scholar]
- Haucke V, Wenk MR, Chapman ER, Farsad K, De Camilli P. Dual interaction of synaptotagmin with μ2- and α-adaptin facilitates clathrin-coated pit nucleation. EMBO J. 2000;19:6011–6019. doi: 10.1093/emboj/19.22.6011. [DOI] [PMC free article] [PubMed] [Google Scholar]
- Heidrych P, Zimmermann U, Bress A, Pusch CM, Ruth P, Pfister M, Knipper M, Blin N. Rab8b GTPase, a protein transport regulator, is an interacting partner of otoferlin, defective in a human autosomal recessive deafness form. Hum Mol Genet. 2008;17:3814–3821. doi: 10.1093/hmg/ddn279. [DOI] [PubMed] [Google Scholar]
- Heidrych P, Zimmermann U, Kuhn S, Franz C, Engel J, Duncker SV, Hirt B, Pusch CM, Ruth P, Pfister M, Marcotti W, Blin N, Knipper M. Otoferlin interacts with myosin VI: implications for maintenance of the basolateral synaptic structure of the inner hair cell. Hum Mol Genet. 2009;18:2779–2790. doi: 10.1093/hmg/ddp213. [DOI] [PubMed] [Google Scholar]
- Henkel AW, Almers W. Fast steps in exocytosis and endocytosis studied by capacitance measurements in endocrine cells. Curr Opin Neurobiol. 1996;6:350–357. doi: 10.1016/S0959-4388(96)80119-X. [DOI] [PubMed] [Google Scholar]
- Heuser JE, Reese TS. Evidence for recycling of synaptic vesicle membrane during transmitter release at the frog neuromuscular junction. J Cell Biol. 1973;57:315–344. doi: 10.1083/jcb.57.2.315. [DOI] [PMC free article] [PubMed] [Google Scholar]
- Hirst J, Robinson MS. Clathrin and adaptors. Biochim Biophys Acta. 1998;1404:173–193. doi: 10.1016/S0167-4889(98)00056-1. [DOI] [PubMed] [Google Scholar]
- Hosoi N, Holt M, Sakaba T. Calcium dependence of exo- and endocytotic coupling at a glutamatergic synapse. Neuron. 2009;63:216–229. doi: 10.1016/j.neuron.2009.06.010. [DOI] [PubMed] [Google Scholar]
- Hua Y, Sinha R, Thiel CS, Schmidt R, Hüve J, Martens H, Hell SW, Egner A, Klingauf J. A readily retrievable pool of synaptic vesicles. Nat Neurosci. 2011;14:833–839. doi: 10.1038/nn.2838. [DOI] [PubMed] [Google Scholar]
- Jockusch WJ, Praefcke GJ, McMahon HT, Lagnado L. Clathrin-dependent and clathrin-independent retrieval of synaptic vesicles in retinal bipolar cells. Neuron. 2005;46:869–878. doi: 10.1016/j.neuron.2005.05.004. [DOI] [PubMed] [Google Scholar]
- Johnson CP, Chapman ER. Otoferlin is a calcium sensor that directly regulates SNARE-mediated membrane fusion. J Cell Biol. 2010;191:187–197. doi: 10.1083/jcb.201002089. [DOI] [PMC free article] [PubMed] [Google Scholar]
- Johnson SL, Marcotti W, Kros CJ. Increase in efficiency and reduction in Ca2+ dependence of exocytosis during development of mouse inner hair cells. J Physiol. 2005;563:177–191. doi: 10.1113/jphysiol.2004.074740. [DOI] [PMC free article] [PubMed] [Google Scholar]
- Johnson SL, Forge A, Knipper M, Münkner S, Marcotti W. Tonotopic variation in the calcium dependence of neurotransmitter release and vesicle pool replenishment at mammalian auditory ribbon synapses. J Neurosci. 2008;28:7670–7678. doi: 10.1523/JNEUROSCI.0785-08.2008. [DOI] [PMC free article] [PubMed] [Google Scholar]
- Johnson SL, Franz C, Knipper M, Marcotti W. Functional maturation of the exocytotic machinery at gerbil hair cell ribbon synapses. J Physiol. 2009;587:1715–1726. doi: 10.1113/jphysiol.2009.168542. [DOI] [PMC free article] [PubMed] [Google Scholar]
- Johnson SL, Franz C, Kuhn S, Furness DN, Rüttiger L, Münkner S, Rivolta MN, Seward EP, Herschman HR, Engel J, Knipper M, Marcotti W. Synaptotagmin IV determines the linear Ca2+ dependence of vesicle fusion at auditory ribbon synapses. Nat Neurosci. 2010;13:45–52. doi: 10.1038/nn.2456. [DOI] [PMC free article] [PubMed] [Google Scholar]
- Keyel PA, Thieman JR, Roth R, Erkan E, Everett ET, Watkins SC, Heuser JE, Traub LM. The AP-2 adaptor β2 appendage scaffolds alternate cargo endocytosis. Mol Biol Cell. 2008;19:5309–5326. doi: 10.1091/mbc.E08-07-0712. [DOI] [PMC free article] [PubMed] [Google Scholar]
- Knipper M, Zinn C, Maier H, Praetorius M, Rohbock K, Köpschall I, Zimmermann U. Thyroid hormone deficiency before the onset of hearing causes irreversible damage to peripheral and central auditory systems. J Neurophysiol. 2000;83:3101–3112. doi: 10.1152/jn.2000.83.5.3101. [DOI] [PubMed] [Google Scholar]
- Knirsch M, Brandt N, Braig C, Kuhn S, Hirt B, Münkner S, Knipper M, Engel J. Persistence of CaV1.3 Ca2+ channels in mature outer hair cells supports outer hair cell afferent signaling. J Neurosci. 2007;27:6442–6451. doi: 10.1523/JNEUROSCI.5364-06.2007. [DOI] [PMC free article] [PubMed] [Google Scholar]
- Levic S, Bouleau Y, Dulon D. Developmental acquisition of a rapid calcium-regulated vesicle supply allows sustained high rates of exocytosis in auditory hair cells. PLoS One. 2011;6:e25714. doi: 10.1371/journal.pone.0025714. [DOI] [PMC free article] [PubMed] [Google Scholar]
- Linden DJ. A late phase of LTD in cultured cerebellar Purkinje cells requires persistent dynamin-mediated endocytosis. J Neurophysiol. 2012;107:448–454. doi: 10.1152/jn.00824.2011. [DOI] [PMC free article] [PubMed] [Google Scholar]
- Macia E, Ehrlich M, Massol R, Boucrot E, Brunner C, Kirchhausen T. Dynasore, a cell-permeable inhibitor of dynamin. Dev Cell. 2006;10:839–850. doi: 10.1016/j.devcel.2006.04.002. [DOI] [PubMed] [Google Scholar]
- Mirghomizadeh F, Pfister M, Apaydin F, Petit C, Kupka S, Pusch CM, Zenner HP, Blin N. Substitutions in the conserved C2C domain of otoferlin cause DFNB9, a form of nonsyndromic autosomal recessive deafness. Neurobiol Dis. 2002;10:157–164. doi: 10.1006/nbdi.2002.0488. [DOI] [PubMed] [Google Scholar]
- Moser T, Beutner D. Kinetics of exocytosis and endocytosis at the cochlear inner hair cell afferent synapse of the mouse. Proc Natl Acad Sci U S A. 2000;97:883–888. doi: 10.1073/pnas.97.2.883. [DOI] [PMC free article] [PubMed] [Google Scholar]
- Müller CS, Haupt A, Bildl W, Schindler J, Knaus HG, Meissner M, Rammner B, Striessnig J, Flockerzi V, Fakler B, Schulte U. Quantitative proteomics of the CaV2 channel nano-environments in the mammalian brain. Proc Natl Acad Sci U S A. 2010;107:14950–14957. doi: 10.1073/pnas.1005940107. [DOI] [PMC free article] [PubMed] [Google Scholar]
- Newton AJ, Kirchhausen T, Murthy VN. Inhibition of dynamin completely blocks compensatory synaptic vesicle endocytosis. Proc Natl Acad Sci U S A. 2006;103:17955–17960. doi: 10.1073/pnas.0606212103. [DOI] [PMC free article] [PubMed] [Google Scholar]
- Pandey A, Andersen JS, Mann M. Use of mass spectrometry to study signaling pathways. Sci STKE. 2000;2000:pl1. doi: 10.1126/stke.2000.37.pl1. [DOI] [PubMed] [Google Scholar]
- Pangršič T, Lasarow L, Reuter K, Takago H, Schwander M, Riedel D, Frank T, Tarantino LM, Bailey JS, Strenzke N, Brose N, Müller U, Reisinger E, Moser T. Hearing requires otoferlin-dependent efficient replenishment of synaptic vesicles in hair cells. Nat Neurosci. 2010;13:869–876. doi: 10.1038/nn.2578. [DOI] [PubMed] [Google Scholar]
- Pangršič T, Reisinger E, Moser T. Otoferlin: a multi-C2 domain protein essential for hearing. Trends Neurosci. 2012;35:671–680. doi: 10.1016/j.tins.2012.08.002. [DOI] [PubMed] [Google Scholar]
- Pearse BM, Smith CJ, Owen DJ. Clathrin coat construction in endocytosis. Curr Opin Struct Biol. 2000;10:220–228. doi: 10.1016/S0959-440X(00)00071-3. [DOI] [PubMed] [Google Scholar]
- Poskanzer KE, Fetter RD, Davis GW. Discrete residues in the C2B domain of synaptotagmin I independently specify endocytic rate and synaptic vesicle size. Neuron. 2006;50:49–62. doi: 10.1016/j.neuron.2006.02.021. [DOI] [PubMed] [Google Scholar]
- Puri C. Loss of myosin VI no insert isoform (NoI) induces a defect in clathrin-mediated endocytosis and leads to caveolar endocytosis of transferrin receptor. J Biol Chem. 2009;284:34998–35014. doi: 10.1074/jbc.M109.012328. [DOI] [PMC free article] [PubMed] [Google Scholar]
- Ramakrishnan NA, Drescher MJ, Drescher DG. Direct Interaction of Otoferlin with Syntaxin 1A, SNAP-25, and the L-type voltage-gated calcium channel CaV1.3. J Biol Chem. 2009;284:1364–1372. doi: 10.1074/jbc.M803605200. [DOI] [PMC free article] [PubMed] [Google Scholar]
- Rappoport JZ. Focusing on clathrin-mediated endocytosis. Biochem J. 2008;412:415–423. doi: 10.1042/BJ20080474. [DOI] [PubMed] [Google Scholar]
- Robinson MS. 100-kD coated vesicle proteins: molecular heterogeneity and intracellular distribution studied with monoclonal antibodies. J Cell Biol. 1987;104:887–895. doi: 10.1083/jcb.104.4.887. [DOI] [PMC free article] [PubMed] [Google Scholar]
- Robinson MS. Cloning of cDNAs encoding two related 100-kD coated vesicle proteins (α-adaptins) J Cell Biol. 1989;108:833–842. doi: 10.1083/jcb.108.3.833. [DOI] [PMC free article] [PubMed] [Google Scholar]
- Roux I, Safieddine S, Nouvian R, Grati M, Simmler MC, Bahloul A, Perfettini I, Le Gall M, Rostaing P, Hamard G, Triller A, Avan P, Moser T, Petit C. Otoferlin, defective in a human deafness form, is essential for exocytosis at the auditory ribbon synapse. Cell. 2006;127:277–289. doi: 10.1016/j.cell.2006.08.040. [DOI] [PubMed] [Google Scholar]
- Schnee ME, Santos-Sacchi J, Castellano-Muñoz M, Kong JH, Ricci AJ. Calcium-dependent synaptic vesicle trafficking underlies indefatigable release at the hair cell afferent fiber synapse. Neuron. 2011;70:326–338. doi: 10.1016/j.neuron.2011.01.031. [DOI] [PMC free article] [PubMed] [Google Scholar]
- Schug N, Braig C, Zimmermann U, Engel J, Winter H, Ruth P, Blin N, Pfister M, Kalbacher H, Knipper M. Differential expression of otoferlin in brain, vestibular system, immature and mature cochlea of the rat. Eur J Neurosci. 2006;24:3372–3380. doi: 10.1111/j.1460-9568.2006.05225.x. [DOI] [PubMed] [Google Scholar]
- Schwander M, Sczaniecka A, Grillet N, Bailey JS, Avenarius M, Najmabadi H, Steffy BM, Federe GC, Lagler EA, Banan R, Hice R, Grabowski-Boase L, Keithley EM, Ryan AF, Housley GD, Wiltshire T, Smith RJ, Tarantino LM, Müller U. A forward genetics screen in mice identifies recessive deafness traits and reveals that pejvakin is essential for outer hair cell function. J Neurosci. 2007;27:2163–2175. doi: 10.1523/JNEUROSCI.4975-06.2007. [DOI] [PMC free article] [PubMed] [Google Scholar]
- Shahin H, Walsh T, Rayyan AA, Lee MK, Higgins J, Dickel D, Lewis K, Thompson J, Baker C, Nord AS, Stray S, Gurwitz D, Avraham KB, King MC, Kanaan M. Five novel loci for inherited hearing loss mapped by SNP-based homozygosity profiles in Palestinian families. Eur J Hum Genet. 2010;18:407–413. doi: 10.1038/ejhg.2009.190. [DOI] [PMC free article] [PubMed] [Google Scholar]
- Sharif-Naeini R, Folgering JH, Bichet D, Duprat F, Lauritzen I, Arhatte M, Jodar M, Dedman A, Chatelain FC, Schulte U, Retailleau K, Loufrani L, Patel A, Sachs F, Delmas P, Peters DJ, Honor é E. Polycystin-1 and -2 dosage regulates pressure sensing. Cell. 2009;139:587–596. doi: 10.1016/j.cell.2009.08.045. [DOI] [PubMed] [Google Scholar]
- Siegel JH, Brownell WE. Synaptic and Golgi membrane recycling in cochlear hair cells. J Neurocytol. 1986;15:311–328. doi: 10.1007/BF01611434. [DOI] [PubMed] [Google Scholar]
- Spassova MA, Avissar M, Furman AC, Crumling MA, Saunders JC, Parsons TD. Evidence that rapid vesicle replenishment of the synaptic ribbon mediates recovery from short-term adaptation at the hair cell afferent synapse. J Assoc Res Otolaryngol. 2004;5:376–390. doi: 10.1007/s10162-004-5003-8. [DOI] [PMC free article] [PubMed] [Google Scholar]
- Stefanini M, De Martino C, Zamboni L. Fixation of ejaculated spermatozoa for electron microscopy. Nature. 1967;216:173–174. doi: 10.1038/216173a0. [DOI] [PubMed] [Google Scholar]
- Südhof TC. Synaptotagmins: why so many? J Biol Chem. 2002;277:7629–7632. doi: 10.1074/jbc.R100052200. [DOI] [PubMed] [Google Scholar]
- Tsai CC, Lin CL, Wang TL, Chou AC, Chou MY, Lee CH, Peng IW, Liao JH, Chen YT, Pan CY. Dynasore inhibits rapid endocytosis in bovine chromaffin cells. Am J Physiol Cell Physiol. 2009;297:C397–406. doi: 10.1152/ajpcell.00562.2008. [DOI] [PubMed] [Google Scholar]
- Uziel A, Legrand C, Ohresser M, Marot M. Maturational and degenerative processes in the organ of Corti after neonatal hypothyroidism. Hear Res. 1983;11:203–218. doi: 10.1016/0378-5955(83)90079-5. [DOI] [PubMed] [Google Scholar]
- Varga R, Kelley PM, Keats BJ, Starr A, Leal SM, Cohn E, Kimberling WJ. Non-syndromic recessive auditory neuropathy is the result of mutations in the otoferlin (OTOF) gene. J Med Genet. 2003;40:45–50. doi: 10.1136/jmg.40.1.45. [DOI] [PMC free article] [PubMed] [Google Scholar]
- von Gersdorff H, Matthews G. Dynamics of synaptic vesicle fusion and membrane retrieval in synaptic terminals. Nature. 1994;367:735–739. doi: 10.1038/367735a0. [DOI] [PubMed] [Google Scholar]
- Yao J, Kwon SE, Gaffaney JD, Dunning FM, Chapman ER. Uncoupling the roles of synaptotagmin I during endo- and exocytosis of synaptic vesicles. Nat Neurosci. 2012a;15:243–249. doi: 10.1038/nn.3013. [DOI] [PMC free article] [PubMed] [Google Scholar]
- Yao LH, Rao Y, Varga K, Wang CY, Xiao P, Lindau M, Gong LW. Synaptotagmin 1 is necessary for the Ca2+ dependence of clathrin-mediated endocytosis. J Neurosci. 2012b;32:3778–3785. doi: 10.1523/JNEUROSCI.3540-11.2012. [DOI] [PMC free article] [PubMed] [Google Scholar]
- Yasunaga S, Grati M, Cohen-Salmon M, El-Amraoui A, Mustapha M, Salem N, El-Zir E, Loiselet J, Petit C. A mutation in OTOF, encoding otoferlin, a FER-1-like protein, causes DFNB9, a nonsyndromic form of deafness. Nat Genet. 1999;21:363–369. doi: 10.1038/7693. [DOI] [PubMed] [Google Scholar]
- Yasunaga S, Grati M, Chardenoux S, Smith TN, Friedman TB, Lalwani AK, Wilcox ER, Petit C. OTOF encodes multiple long and short isoforms: genetic evidence that the long ones underlie recessive deafness DFNB9. Am J Hum Genet. 2000;67:591–600. doi: 10.1086/303049. [DOI] [PMC free article] [PubMed] [Google Scholar]
- Yu C, Feng W, Wei Z, Miyanoiri Y, Wen W, Zhao Y, Zhang M. Myosin VI undergoes cargo-mediated dimerization. Cell. 2009;138:537–548. doi: 10.1016/j.cell.2009.05.030. [DOI] [PubMed] [Google Scholar]
- Zampini V, Johnson SL, Franz C, Lawrence ND, Münkner S, Engel J, Knipper M, Magistretti J, Masetto S, Marcotti W. Elementary properties of CaV1.3 Ca2+ channels expressed in mouse cochlear inner hair cells. J Physiol. 2010;588:187–199. doi: 10.1113/jphysiol.2009.181917. [DOI] [PMC free article] [PubMed] [Google Scholar]