Abstract
Establishing the age of each mutation segregating in contemporary human populations is important to fully understand our evolutionary history1,2 and will help facilitate the development of new approaches for disease gene discovery3. Large-scale surveys of human genetic variation have reported signatures of recent explosive population growth4-6, notable for an excess of rare genetic variants, qualitatively suggesting that many mutations arose recently. To more quantitatively assess the distribution of mutation ages, we resequenced 15,336 genes in 6,515 individuals of European (n=4,298) and African (n=2,217) American ancestry and inferred the age of 1,146,401 autosomal single nucleotide variants (SNVs). We estimate that ~73% of all protein-coding SNVs and ~86% of SNVs predicted to be deleterious arose in the past 5,000-10,000 years. The average age of deleterious SNVs varied significantly across molecular pathways, and disease genes contained a significantly higher proportion of recently arisen deleterious SNVs compared to other genes. Furthermore, European Americans had an excess of deleterious variants in essential and Mendelian disease genes compared to African Americans, consistent with weaker purifying selection due to the out-of-Africa dispersal. Our results better delimit the historical details of human protein-coding variation, illustrate the profound effect recent human history has had on the burden of deleterious SNVs segregating in contemporary populations, and provides important practical information that can be used to prioritize variants in disease gene discovery.
As part of the NHLBI sponsored Exome Sequencing Project (ESP), we sequenced the exomes of 6,515 individuals (Supplementary Table 1) including 4,298 European-Americans (EAs) and 2,217 African-Americans (AAs). Exome data were subjected to standard quality control filters as previously described6 (Supplementary Information), resulting in a data set of 1,146,401 autosomal protein-coding SNVs with a known ancestral state (709,816 and 643,128 in EAs and AAs, respectively) distributed across 15,336 protein-coding genes. To quantitatively estimate the age of each SNV (i.e., allele age), we developed a simulation approach to generate a series of coalescent trees for a specified demographic model, and estimated allele age based upon the derivation of Griffiths and Tavaré7 (Supplementary Information). We verified the accuracy and robustness of this approach to factors including recombination rate heterogeneity, population growth, migration, and purifying selection. Extensive coalescent simulations demonstrated that we could accurately estimate the expected allele age in the simulated data, although the variance associated with any individual SNV can be large (Supplementary Fig. 6 and 7).
We estimated the age of all 1,146,401 SNVs using six different previously inferred demographic models5,6,8-11, three of which considered recent explosive population growth5,6,8 (Supplementary Table 2). Estimates of allele age were generally robust across different demographic models, with the largest discrepancies resulting in a two-fold difference in average age across all SNVs (Supplementary Table 3 and Supplementary Fig. 8a). However, because most SNVs arose recently (see below), differences among demographic models were highly concordant (Supplementary Information). Accordingly, we report results based on a modified Out-of-African model9 in which accelerated population growth began 5,115 years ago with a per generation growth rate of 1.95% and 1.66% for EAs and AAs, respectively6.
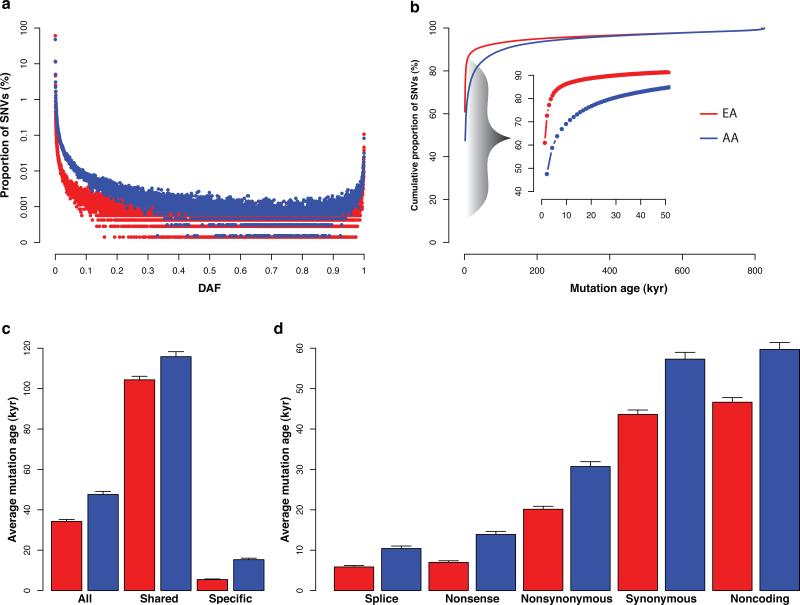
The site frequency spectrum (SFS) of protein-coding SNVs revealed an enormous excess of rare variants (Fig. 1a). Indeed, we observed a SNV approximately once every 52 bp and 57 bp in EAs and AAs, respectively, whereas in a population without recent explosive growth we would expect the SNVs to occur once every 257 bp and 152 bp in EAs and AAs, respectively (Supplementary Information). Thus, the EA and AA samples contain a ~5 and ~3-fold increase in SNVs, respectively, attributable to explosive population growth, resulting in a large burden of rare SNVs predicted to have arisen very recently (Fig. 1b). For example, the expected age of derived singletons, which comprise 55.1% of all SNVs, is 1,244 and 2,107 years for the EA and AA samples, respectively. Overall, 73.2% of SNVs (81.4% and 58.7% in EAs and AAs, respectively) are predicted to have arisen in the past 5,000 years. SNVs that arose >50 thousand years (kyr) ago were observed more frequently in the AA samples (Fig. 1b), which likely reflects stronger genetic drift in EAs associated with the out of Africa dispersal.
Figure 1. The vast majority of protein-coding SNVs arose recently.
a, The site frequency spectrum for EAs (red) and AAs (blue). b, Cumulative proportion of SNVs for a given allele age. The inset highlights the cumulative proportion of SNVs that are estimated to have arisen in the last 50 kyr. c, Average age for all SNVs, SNVs found in both the EAs and AAs (shared), and SNVs found in only one population (specific). d, Average age for different types of variants. Error bars denote standard deviations.
The average age across all SNVs was 34.2±0.9 (s.d.) kyr in EAs and 47.6±1.5 kyr in AAs, and these estimates were robust to sequencing errors (Supplementary Information; Supplementary Fig. 9). As expected, SNVs shared between EAs and AAs were significantly older (104.4 kyr and 115.8 kyr for EAs and AAs, respectively) than population-specific variants (5.4 kyr and 15.3 kyr in EAs and AAs, respectively; Fig. 1c) (t-test; p<10-5 by permutation). Furthermore, there were large and significant differences among the average allele age of SNVs stratified by functional type (t-test; p<10-5 by permutation). For instance, splice site, nonsense, and non-synonymous SNVs were two to eight times younger compared to synonymous and noncoding variants (Fig. 1d). Moreover, we classified amino acids into four groups (non-polar and neutral, polar and neutral, acidic and polar, and basic and polar), and nonsynonymous SNVs resulting in changes between groups were significantly younger than those within groups (t-test; p<10-5 by permutation; Supplementary Fig. 10a). These differences in average allele age are likely due to varying intensities of selective constraint among different classes of SNVs12. Consistent with this prediction, we observed significantly higher values of the neutrality index, a measure of the direction and degree of departure from neutral evolution, in genomic regions enriched for younger variants (Spearman's correlation; p=0.004 and 0.001 for EAs and AAs, respectively; Supplementary Fig. 11), indicating a higher burden of deleterious SNVs.
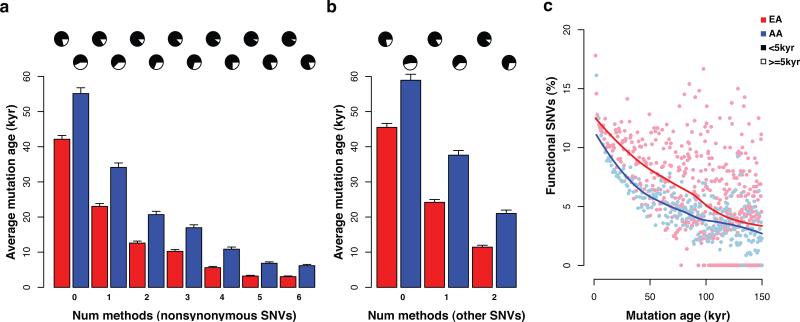
To more directly identify putatively deleterious SNVs, we used four functional prediction methods (SIFT13, PolyPhen214, a likelihood ratio test15, MutationTaster16) applicable to nonsynonymous SNVs and two conservation-based methods (GERP++17 and PhyloP18) applicable to all SNVs (Supplementary Information). We found a strong inverse relationship between average SNV age and the number of methods that predicted a variant to be deleterious (Fig. 2a and 2b). Thus, SNVs predicted to be deleterious by multiple methods likely experience (on average) more intense purifying selection and may be of particular interest in disease mapping studies, or to weight differently in rare variant association tests. The age of nonsynonymous SNVs predicted to be deleterious by all six methods was 3.0 and 6.2 kyr in EAs and AAs, respectively, and 88.7% were <5 kyr (92.9% and 80.6% in EAs and AAs, respectively).
Figure 2. Characteristics of allele age for deleterious SNVs.
a and b, average age of nonsynonymous and other SNVs as a function of the number of methods that predict the variant to be deleterious. Pie charts represent the proportion of SNVs that arose less than (black) or more than (white) 5 kyr. Error bars denote standard deviations. c, Relationship between the proportion of SNVs predicted to be deleterious and SNV age. Note, >99% of deleterious SNVs are estimated to have arisen in the past 150 Kyr. Solid lines represent a loess fit to the data.
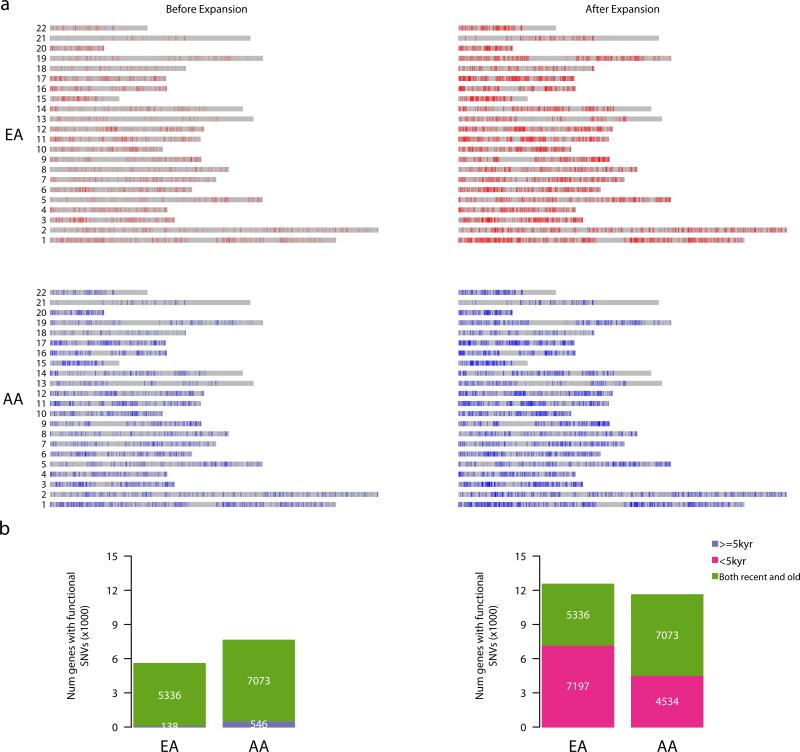
The strengths and weaknesses of functional prediction methods vary substantially and as a result the accuracy of any single method is modest15. Accordingly, we used a majority rule approach to identify a more conservative set of SNVs predicted to be deleterious6. Specifically, nonsynonymous SNVs predicted to be functionally significant by at least four methods and all other SNVs (synonymous, splice, and noncoding variants) predicted by two conservation-based methods were designated as deleterious. In total, 14.4% (164,688) of SNVs, including 152,633 nonsynonymous variants, met these criteria. We found that allele age was strongly related to the probability that a variant was predicted to be deleterious (Supplementary Fig. 12), with the fraction of SNVs predicted to be deleterious diminishing as allele age increased (Fig. 2c and Supplementary Fig. 13). The average age of conservatively defined deleterious variants was 5.2±0.3 kyr for EAs and 10.1±0.6 kyr for AAs. Moreover, 86.4% of these SNVs were predicted to have arisen in the past 5 kyr (91.2% and 77.0% for EAs and AAs, respectively), corresponding to the onset of accelerated population growth (Fig. 3a). In other demographic models, a similarly high proportion of deleterious SNVs were predicted to have arisen since the onset of accelerated growth rates, with the exact timing varying somewhat among models, but always in the timeframe of 5-10 kyr (Supplementary Table 3; Supplementary Fig. 8b and 8c).
Figure 3. Distribution of deleterious SNVs across the exome before and after recent accelerated population growth.
a, Rectangles represent the set of all protein-coding sequences for each chromosome. Vertical red and blue lines in EAs and AAs, respectively, denote deleterious SNVs. The distributions of deleterious SNVs across the exome before and after recent accelerated population growth are shown in the left and right panels, respectively. b, The bar plots summarize the number of genes segregating one or more deleterious SNVs that arose before (left) or after (right) recent accelerated population growth.
Moreover, 7,197 (57.4%) of the 12,533 genes in EAs and 4,534 (37.5%) of the 11,607 genes in AAs that harbor one or more deleterious variants only possess deleterious SNVs with an estimated age of < 5 kyr (Fig. 3b). Thus, recent accelerated population growth has had a large influence on the number of genes harboring deleterious variants in contemporary populations. Notably, after correcting for exon length of each gene, three and eighteen genes in EAs and in AAs, respectively, have a significant excess of deleterious variants that arose after the onset of recent accelerated growth (p≤3×10⁻⁶; Supplementary Table 4), including 12 genes that have been associated with human diseases19 such as LAMC1 (premature ovarian failure20), LRP1 (Alzheimer Disease21), CPE (coronary artery atherosclerosis22), and KIAA0196 (hereditary spastic paraplegia23).
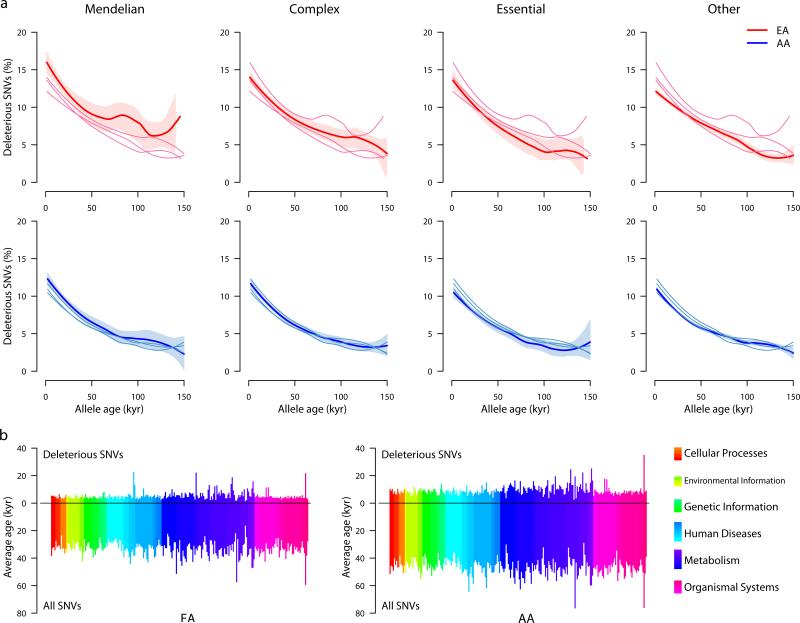
Next, we investigated the distribution of ages for conservatively defined deleterious SNVs in 849 genes that cause Mendelian disorders24, 2,663 genes associated with complex diseases19, 1,226 genes considered “essential” (i.e., a mouse knockout associated with lethality or sterility)25, and 11,711 genes classified as “other” (Supplementary Information). The proportion of deleterious SNVs in genes for Mendelian disorders (15.9%), essential genes (15.2%), and genes associated with complex diseases (15.1%) were each significantly higher (Fisher's exact test, p<10-16) compared to other genes (14.0%). In the EA samples, the proportion of deleterious SNVs did not decline monotonically as a function of age for Mendelian and essential genes. Rather, the proportion of deleterious variants with an estimated age of 50-100 kyr in Mendelian disease genes and 100-150 kyr in essential genes were elevated (Fig. 4a). This pattern was not observed in the AAs (Fig. 4a). To explore this observation, we performed simulations to estimate the probability that a deleterious SNV survives to the present day as a function of when the variant arose, the magnitude of selection, and presence or absence of an out of Africa bottleneck (Supplementary Information). Simulations of deleterious alleles in the presence of a bottleneck recapitulated the patterns observed in EAs (Supplementary Fig. 14). Specifically, in the presence of a bottleneck, weakly deleterious alleles (selection coefficient, s≤0.001) have an increased probability of survival precisely in the intervals 50-100 kyr and 100-150 kyr. Thus, our simulations suggest that genes underlying disease and essential genes are more functionally constrained relative to other genes, and the bottleneck associated with the out of Africa dispersal led to less efficient purging of weakly deleterious alleles26.
Figure 4. Heterogeneity of allele age across genes and pathways.
a, Distribution of the proportion of deleterious SNVs for Mendelian, complex, essential, and other genes in EAs (top) and AAs (bottom) versus age in kyr. Data for each of the four categories of genes is shown in each plot, with darker lines representing the specific gene class indicated by the column label. Shaded regions define 95% confidence intervals obtained by bootstrapping. b, Average ages for deleterious (projecting up) and all (projecting down) SNVs across 235 KEGG pathways that can be organized into six broad classes (see legend on the right). Each of the six classes is comprised of multiple sub-classes, indicated by the different color shadings.
Finally, we found that the average age of deleterious variants (and the proportion of deleterious variants; Supplementary Fig. 15) was significantly different across 235 KEGG pathways (Kruskal-Wallis Rank Sum Test; p=2.5×10⁻³ and 1.08×10⁻⁶ for EAs and AAs, respectively; Fig. 4b; Supplementary Information). The average age across pathways did not vary significantly when all SNVs were considered (Kruskal-Wallis Rank Sum Test; p=0.259 and 0.075 for EAs and AAs, respectively), indicating the differences observed for deleterious variants likely represent heterogeneity of functional constraint across pathways. In general, the average age of deleterious variants in metabolic pathways was older than that in other pathways (Mann-Whitney test, p=1.11×10⁻⁴ and 6.27×10⁻⁹ for EAs and AAs, respectively), suggesting they are subject to less functional constraint. Conversely, deleterious variants in human disease pathways (Mann-Whitney test, p=0.03 for AAs) and in pathways involved in organismal systems were significantly younger (Mann-Whitney test, p=0.04 and 0.002 for EAs and AAs, respectively).
In summary, the spectrum of protein-coding variation is considerably different today compared to what existed even as recently as 200 – 400 generations ago. 86.4% of putatively deleterious protein-coding SNVs arose in the last 5-10 kyr, which are enriched for mutations of large effect (Supplementary Fig. 14), as selection has not had sufficient time to purge them from the population. It thus seems likely that rare variants play a significant role inheritable phenotypic variation, disease susceptibility, and adverse drug responses. In principle, our results provide a framework for developing new methods to prioritize potential disease causing variants in gene mapping studies. More generally, the recent dramatic increase in human population size, resulting in a deluge of rare functionally important variation, has important implications for understanding and predicting current and future patterns of human disease and evolution. For instance, the increased mutational capacity of recent human populations has led to a larger burden of Mendelian disorders, increased the allelic and genetic heterogeneity of traits, and may have created a new repository of recently arisen advantageous alleles that adaptive evolution will act upon in subsequent generations27.
Methods Summary
Exome sequences were obtained for 6,823 individuals, who were sequenced to high-coverage (median depth > 100x) on an Illumina GAII or HiSeq2000. Library construction, exome capture, sequencing, mapping, calling and filtering were performed as previously described, with minor modifications6 (and see Supplementary Information). After quality control and removal of related individuals, 6,515 individuals were retained. Ancestry of each individual was inferred by PCA performed on the sequence data. We developed a simulation approach based on coalescent theory to estimate allele age, which was applied to 1,146,401 autosomal SNVs with known ancestral states. A complete description of the materials and methods is provided in Supplementary Information.
Supplementary Material
Acknowledgements
We acknowledge the support of the National Heart, Lung, and Blood Institute (NHLBI) and the contributions of the research institutions, study investigators, field staff and study participants in creating this resource for biomedical research; and the Population Genetics Project Team. We thank Jim Wilson and Ron Do for critical feedback on the manuscript. Funding for GO ESP was provided by NHLBI grants RC2 HL-103010 (HeartGO), RC2 HL-102923 (LungGO), and RC2 HL-102924 (WHISP). The exome sequencing was performed through NHLBI grants RC2 HL-102925 (BroadGO) and RC2 HL-102926 (SeattleGO).
Footnotes
Author Contributions
WF and JMA conceived the analyses. DAN, SG, and DA oversaw data generation and QC. GJ, HMK, and GA developed algorithms and called SNVs. WF performed the majority of analyses with contributions from TDO. WF, MJB, JS, and JMA analyzed the data and wrote the manuscript with contributions from all authors.
Author Information
Filtered sets of annotated variants and their allele frequencies are available at http://evs.gs.washington.edu/EVS/ and genotypes and phenotypes from a large subset of individuals are also available via dbGaP (http://www.ncbi.nlm.nih.gov/gap) using the following accession information: NHLBI GO-ESP: Women's Health Initiative Exome Sequencing Project (WHI) – WHISP, WHISP_Subject_Phenotypes, pht002246.v2.p2, phs000281.v2.p2; NHLBI GO-ESP: Heart Cohorts Exome Sequencing Project (JHS), ESP_HeartGO_JHS_LDLandEOMI_Subject_Phenotypes, pht002539.v1.p1, phs000402.v1.p1; NHLBI GO-ESP: Heart Cohorts Exome Sequencing Project (FHS), HeartGO_FHS_LDLandEOMI_PhenotypeDataFile, pht002476.v1.p1, phs000401.v1.p1; NHLBI GO-ESP: Heart Cohorts Exome Sequencing Project (CHS), HeartGO_CHS_LDL_PhenotypeDataFile, pht002536.v1.p1, phs000400.v1.p1; NHLBI GO-ESP: Heart Cohorts Exome Sequencing Project (ARIC), ESP_ARIC_LDLandEOMI_Sample, pht002466.v1.p1, phs000398.v1.p1; NHLBI GO-ESP: Lung Cohorts Exome Sequencing Project (Cystic Fibrosis), ESP_LungGO_CF_PA_Culture_Data, pht002227.v1.p1, phs000254.v1.p1; NHLBI GO-ESP: Early-Onset Myocardial Infarction (Broad EOMI), ESP_Broad_EOMI_Subject_Phenotypes, pht001437.v1.p1, phs000279.v1.p1; NHLBI GO-ESP: Lung Cohorts Exome Sequencing Project (Pulmonary Arterial Hypertension), PAH_Subject_Phenotypes_Baseline_Measures, pht002277.v1.p1, phs000290.v1.p1; NHLBI GO-ESP: Lung Cohorts Exome Sequencing Project (Lung Health Study of Chronic Obstructive Pulmonary Disease), LHS_COPD_Subject_Phenotypes_Baseline_Measures, pht002272.v1.p1, phs000291.v1.p1.
Supplementary Information is linked to the online version of the paper at www.nature.com/nature.
References
- 1.Kimura M, Ota T. The age of a neutral mutant persisting in a finite population. Genetics. 1973;75:199–212. doi: 10.1093/genetics/75.1.199. [DOI] [PMC free article] [PubMed] [Google Scholar]
- 2.Tishkoff SA, Verrelli BC. Patterns of human genetic diversity: implications for human evolutionary history and disease. Annu Rev Genomics Hum Genet. 2003;4:293–340. doi: 10.1146/annurev.genom.4.070802.110226. [DOI] [PubMed] [Google Scholar]
- 3.Slatkin M, Rannala B. Estimating allele age. Annu Rev Genomics Hum Genet. 2000;1:225–249. doi: 10.1146/annurev.genom.1.1.225. [DOI] [PubMed] [Google Scholar]
- 4.Keinan A, Clark AG. Recent explosive human population growth has resulted in an excess of rare genetic variants. Science. 2012;336:740–743. doi: 10.1126/science.1217283. [DOI] [PMC free article] [PubMed] [Google Scholar]
- 5.Nelson MR, et al. An Abundance of Rare Functional Variants in 202 Drug Target Genes Sequenced in 14,002 People. Science. 2012;337:100–104. doi: 10.1126/science.1217876. [DOI] [PMC free article] [PubMed] [Google Scholar]
- 6.Tennessen JA, et al. Evolution and Functional Impact of Rare Coding Variation from Deep Sequencing of Human Exomes. Science. 2012;337:64–69. doi: 10.1126/science.1219240. [DOI] [PMC free article] [PubMed] [Google Scholar]
- 7.Griffiths RC. Tavaré, S. The age of a mutation in a general coalescent tree. COMMUM. STATIST.-STOCHASTIC MODELS. 1998;14:273–295. [Google Scholar]
- 8.Coventry A, et al. Deep resequencing reveals excess rare recent variants consistent with explosive population growth. Nat Commun. 2010;1:131. doi: 10.1038/ncomms1130. [DOI] [PMC free article] [PubMed] [Google Scholar]
- 9.Gravel S, et al. Demographic history and rare allele sharing among human populations. Proc Natl Acad Sci U S A. 2011;108:11983–11988. doi: 10.1073/pnas.1019276108. [DOI] [PMC free article] [PubMed] [Google Scholar]
- 10.Gutenkunst RN, Hernandez RD, Williamson SH, Bustamante CD. Inferring the joint demographic history of multiple populations from multidimensional SNP frequency data. PLoS Genet. 2009;5:e1000695. doi: 10.1371/journal.pgen.1000695. [DOI] [PMC free article] [PubMed] [Google Scholar]
- 11.Schaffner SF, et al. Calibrating a coalescent simulation of human genome sequence variation. Genome Res. 2005;15:1576–1583. doi: 10.1101/gr.3709305. [DOI] [PMC free article] [PubMed] [Google Scholar]
- 12.Gibson G. Rare and common variants: twenty arguments. Nat Rev Genet. 2012;13:135–145. doi: 10.1038/nrg3118. [DOI] [PMC free article] [PubMed] [Google Scholar]
- 13.Kumar P, Henikoff S, Ng PC. Predicting the effects of coding non-synonymous variants on protein function using the SIFT algorithm. Nat Protoc. 2009;4:1073–1081. doi: 10.1038/nprot.2009.86. [DOI] [PubMed] [Google Scholar]
- 14.Adzhubei IA, et al. A method and server for predicting damaging missense mutations. Nat Methods. 2010;7:248–249. doi: 10.1038/nmeth0410-248. [DOI] [PMC free article] [PubMed] [Google Scholar]
- 15.Chun S, Fay JC. Identification of deleterious mutations within three human genomes. Genome Res. 2009;19:1553–1561. doi: 10.1101/gr.092619.109. [DOI] [PMC free article] [PubMed] [Google Scholar]
- 16.Schwarz JM, Rodelsperger C, Schuelke M, Seelow D. MutationTaster evaluates disease-causing potential of sequence alterations. Nat Methods. 2010;7:575–576. doi: 10.1038/nmeth0810-575. [DOI] [PubMed] [Google Scholar]
- 17.Davydov EV, et al. Identifying a high fraction of the human genome to be under selective constraint using GERP++. PLoS Comput Biol. 2010;6:e1001025. doi: 10.1371/journal.pcbi.1001025. [DOI] [PMC free article] [PubMed] [Google Scholar]
- 18.Pollard KS, Hubisz MJ, Rosenbloom KR, Siepel A. Detection of nonneutral substitution rates on mammalian phylogenies. Genome Res. 2009;20:110–121. doi: 10.1101/gr.097857.109. [DOI] [PMC free article] [PubMed] [Google Scholar]
- 19.Becker KG, Barnes KC, Bright TJ, Wang SA. The genetic association database. Nat Genet. 2004;36:431–432. doi: 10.1038/ng0504-431. [DOI] [PubMed] [Google Scholar]
- 20.Pyun JA, Cha DH, Kwack K. LAMC1 gene is associated with premature ovarian failure. Maturitas. 2012;71:402–6. doi: 10.1016/j.maturitas.2012.01.011. [DOI] [PubMed] [Google Scholar]
- 21.Liu Q, et al. Amyloid precursor protein regulates brain apolipoprotein E and cholesterol metabolism through lipoprotein receptor LRP1. Neuron. 2007;56:66–78. doi: 10.1016/j.neuron.2007.08.008. [DOI] [PMC free article] [PubMed] [Google Scholar]
- 22.Jia EZ, et al. Association of the mutation for the human carboxypeptidase E gene exon 4 with the severity of coronary artery atherosclerosis. Mol Biol Rep. 2009;36:245–54. doi: 10.1007/s11033-007-9173-4. [DOI] [PubMed] [Google Scholar]
- 23.Valdmanis PN, et al. Mutations in the KIAA0196 gene at the SPG8 locus cause hereditary spastic paraplegia. Am J Hum Genet. 2007;80:152–61. doi: 10.1086/510782. [DOI] [PMC free article] [PubMed] [Google Scholar]
- 24.Blekhman R, et al. Natural selection on genes that underlie human disease susceptibility. Curr Biol. 2008;18:883–889. doi: 10.1016/j.cub.2008.04.074. [DOI] [PMC free article] [PubMed] [Google Scholar]
- 25.Liao BY, Scott NM, Zhang J. Impacts of gene essentiality, expression pattern, and gene compactness on the evolutionary rate of mammalian proteins. Mol Biol Evol. 2006;23:2072–2080. doi: 10.1093/molbev/msl076. [DOI] [PubMed] [Google Scholar]
- 26.Lohmueller KE, et al. Proportionally more deleterious genetic variation in European than in African populations. Nature. 2008;451:994–997. doi: 10.1038/nature06611. [DOI] [PMC free article] [PubMed] [Google Scholar]
- 27.Hawks J, Wang ET, Cochran GM, Harpending HC, Moyzis RK. Recent acceleration of human adaptive evolution. Proc Natl Acad Sci U S A. 2007;104:20753–8. doi: 10.1073/pnas.0707650104. [DOI] [PMC free article] [PubMed] [Google Scholar]
Associated Data
This section collects any data citations, data availability statements, or supplementary materials included in this article.


