Abstract
Objective
This study assessed the normal growth and development of mastoid air cell system (MACS) geometry from infancy through adolescence.
Methods
This cross-sectional study evaluated the change with age in MACS volume, surface area and surface area/volume ratio in 36 (72 ears) individuals aged 1.6 to 18 years with no history of middle ear disease. The three MACS parameters were reconstructed using CT scans judged by a radiologist to be normal. Linear regression was used to determine the relationship between the left and right values of each parameter and between those parameters and age for male and female subjects.
Results
For all three MACS parameters, the right and left values were highly correlated. MACS volume and surface area for male and female subjects showed increased between 1 and 18 years. The surface area/volume ratio for males was independent of age but showed a shallow increase for females, when averaged across all ages, that ratio was similar to those previously reported.
Conclusions
The growth trajectory for MACS volume observed in this study was not consistent with other cross-sectional studies employing planimetry or CT of normal subjects which reported inconsistent results. Because of its potential role as a “susceptibility” factor for otitis media and other otologic problems, it is important to describe the growth and development of MACS geometry. Additional, well-controlled studies of this phenomenon are needed to clarify which of the growth trajectories actually describe the growth process for the three parameters of interest.
Keywords: Mastoid, Middle Ear, Geometry, Growth
Introduction
The middle ear can be anatomically and functionally subdivided into two normally air-filled cavities that communicate in the air-phase, the tympanum and the mastoid air-cell system (MACS). While the tympanum contains the middle ear ossicles that couple vibrations of the tympanic membrane to those of the oval window and serves a function in hearing, the function of the MACS is not clearly established (1).
Numerous studies show that MACS volume is inversely related to the predisposition of the middle ear to certain pathological conditions including cholesteatoma and otitis media (2-6). One hypothesis advanced to explain this relationship is that the MACS functions as a middle ear gas reserve such that middle ears with larger MACS require less frequent ET openings to maintain near-ambient total pressure (1). Other studies show that the efficiency of this mechanism depends on the surface area to volume (SA/V) ratio for the middle ear (i.e. MACS+tympanum) (7).
The significant left-right correlations for MACS volume and for MACS surface area documented in adults (8) suggests a strong genetic component to these measures as originally proposed by Diamant (9), but it is not known if those individuals with genetically programmed small mastoid volumes are “at risk” for otologic complications or if middle ear diseases stunt the genetically programmed growth of that structure as was demonstrated in animal models (10, 11) and suggested by studies in humans (6, 7, 12).
To begin to resolve this issue, cross-sectional data for MACS volume (and often surface area) in otherwise healthy ears as a function of age were collected and analyzed in an effort to develop growth curves for those measures. For example, Cinamon assembled data from a variety of studies in different populations that measured MACS pneumatization using planimetric techniques and documented increasing MACS pneumatization between the ages of 1 and 10 years and then stable values thereafter (13). Lee and colleagues used CT scans to reconstruct MACS volume and reported increasing volumes with age through the middle of the third decade of life and then a progressive decrease in volume to 80 years of age, though it should be noted that the age range of 0 to 9 years was under-represented in their data set (14). Finally, Csakanyi and colleagues reconstructed the MACS volume and surface area from CT scans in 40 children aged 2.5 to 18 years without a history of middle ear disease. They described a linear increase in volume and surface area to age 7, a plateau between 7 and 13 years and a resumed increase in volume to age 18 years (15). They also reported a significant left-right correlation in MACS volume and MACS surface area and noted in passing that the SA/V ratio for the MACS was independent of age.
Because of the wide variability in the “growth” trajectories for MACS volume reported in these studies, we performed a cross-sectional study of the change with age in MACS volume, surface area and SA/V ratio based on normal CT scans from 36 (72 ears) individuals with no history of middle ear disease. These MACS parameters were reconstructed from the CT scans of infants, children and adolescents ranging in age from 1.6 to 18 years and these data were used to develop growth curves for those parameters.
Methods
The goal of this study was to reconstruct and measure MACS volume, surface area and the SA/V ratio in a cross-section sample of infants, children and adolescents with no history of middle ear disease. For this study, we reviewed patient charts for children aged 1 to 18 years who had CT scans originally prescribed for diagnostic purposes by staff members of the ENT service at Children's Hospital of Pittsburgh. The set of CT scans accepted for this study had no evidence of abnormalities as recorded by the consulting radiologist and had no history of middle ear disease. An attempt was made to fulfill binned ranges of 2 scans per year of age from 1 to 18 years. The study was reviewed and approved by the University of Pittsburgh IRB.
The selected CT scans included the bilateral tympanum and MACSs and were acquired in the transverse plane using a GE LightSpeed VCT system (General Electric Health Care). The images were obtained using a field of view which included both temporal bones (138 to 180 mm) within a 512 × 512 matrix. The resolution averaged over the entire sample was 0.032 cm per pixel with a slice thickness of 0.063 cm. From each CT scan, the complete set of transverse images through the bilateral MACSs (superior to inferior) was used for the reconstructions. Using Image J software (http://rsbweb.nih.gov/ij/), these sections were imported, and the left and right MACSs and tympanums were identified, segmented out and analyzed. For each MACS, the perimeter and area of all air-cells were highlighted, measured with the appropriate calibration, and summed across images. These sums were multiplied by the section interval to yield MACS surface area (cm2) and volume (ml), and the MACS surface area was divided by volume to yield the SA/V ratio. This procedure is essentially identical to that used previously to measure MACS volume, surface area and the surface area/volume ratio in adult subjects (7, 8, 16).
All data for left and right MACS were entered into Microsoft Excel for analysis. For the three primary parameters, MACS volume, surface area and SA/V ratio, linear regression was used to determine the relationships between: 1) these parameters for the left and right MACS over all specimens, and 2) for each parameter, the average value for the left and right MACS in each individual and age in males and females, separately. The significance of the slope of the regression equations versus a value of 0 (no change with age) was calculated using the Student's t test evaluated at α=0.05 and the fit of the regression line was estimated by the square of the Pearson Product Moment Correlation coefficient (r2) which when multiplied by 100% corresponds to the percent of variance in the independent variable predicted by the dependent variable. Other comparisons between measures were done using a 2-tailed Student's t test. Throughout, the format average±standard error is used to summarize the data.
Results
A total of 36 CT scans (72 MACS) were included in the data analysis. Thirteen scans were from female subjects and 23 from male subjects. The average (±SE) age of the females scanned was 8.33±1.30 (range=1.6 to 16.7) years and of the males scanned was 10.16±1.15 (range=0.8 to 18) years.
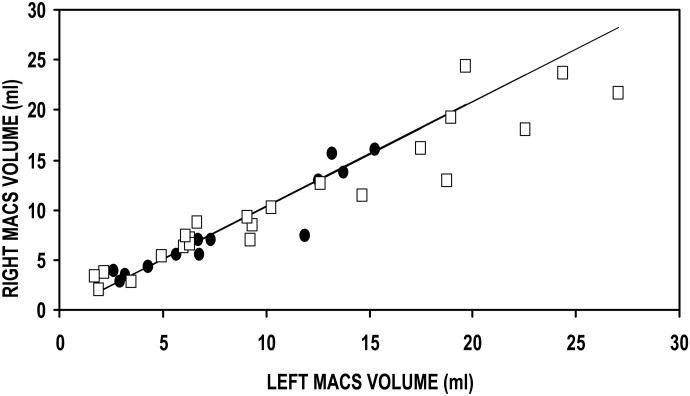
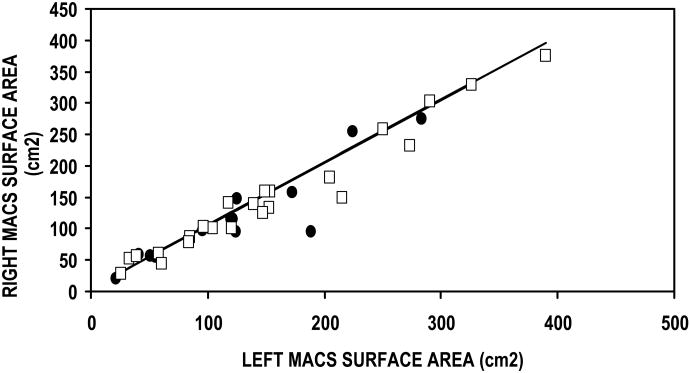
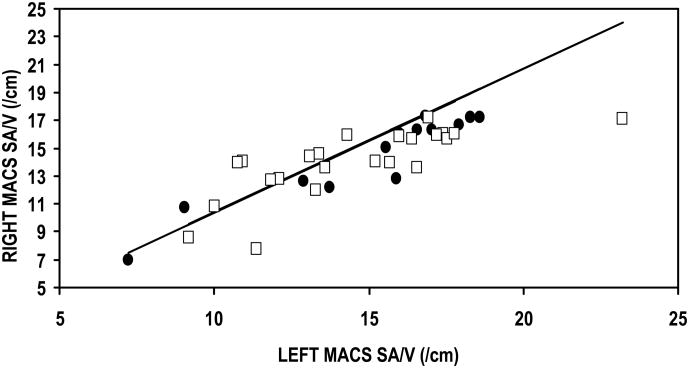
The Table summarizes the data for this study. The first three rows report the results of the linear regression of the right versus left MACS for the three parameters of interest (i.e. MACS volume, surface area and SA/V ratio). All comparisons had a slope that was not significantly different from 1, an intercept that was not significantly different from 0, and an explained variance (r2×100%) ranging between 70 and 93%. These results show that the left and right values of each of these three parameters of MACS geometry are not independent, but are linearly related with an approximate 1:1 correspondence (See Figure 1a, b, c). Consequently, to avoid artificially inflating the sample size, in subsequent analyses, the average values for the left and right MACS of each individual was calculated for each of the 3 parameters and these values were used to develop the age relationships presented for male and female subjects.
Table.
Parameters of linear regression equations including the Slope (±SE), Intercept (±SE), square of the correlation coefficient (r2), Student's t value (t-value) and the associated probability (p-value) for the regression of right on left MACS for each of the three parameters and for the regressions of the average values of the left and right MACSs for the three variables on age for female (n=13) and male (n=23) subjects.
| Comparison | Slope | SE | Intercept | SE | r2 | t-value | p-value | |
|---|---|---|---|---|---|---|---|---|
| Right vs. Left MACS | ||||||||
| Volume | 1.05 | 0.06 | -0.17 | 0.69 | 0.90 | 17.66 | <.001 | |
| Surface Area | 1.00 | 2.26 | 5.56 | 7.27 | 0.93 | 21.00 | <.001 | |
| SA/V Ratio | 1.03 | 0.17 | 0.10 | 1.67 | 0.70 | 8.87 | <.001 | |
| Female vs. Age | Volume | 0.60 | 0.23 | 3.13 | 2.20 | 0.38 | 2.59 | 0.025 |
| Male vs. Age | Volume | 0.81 | 0.22 | 2.79 | 2.50 | 0.40 | 3.75 | 0.001 |
| Female vs. Age | Surface Area | 12.31 | 5.64 | 19.23 | 28.67 | 0.60 | 4.06 | 0.002 |
| Male vs. Age | Surface Area | 10.37 | 3.03 | 45.00 | 34.93 | 0.36 | 3.42 | 0.003 |
| Female vs. Age | SA/V Ratio | 0.38 | 0.18 | 11.54 | 1.67 | 0.30 | 2.17 | 0.053 |
| Male vs. Age | SA/V Ratio | -0.07 | 0.10 | 14.99 | 1.20 | 0.02 | -0.68 | 0.506 |
Figure 1.
Right as a function of left MACS volume (A), Surface Area (B) and SA/V Ratio (C) for female (closed circles) and male (open squares) subjects. The solid line is the solution of the linear regression equation for each of these parameters.
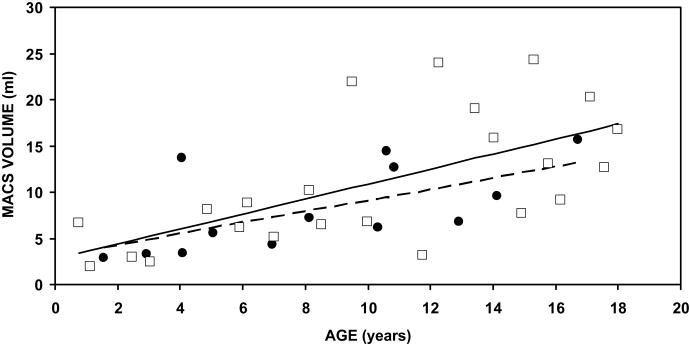
The fourth and fifth rows of the Table report the regression parameters for female and male MACS volumes as a function of age. For females, the intercept (projected value at age 0) was 3.13 ml, the slope (rate of change in the variable) was 0.60 ml/year and the r2 value was 0.38. For males, the intercept was 2.79 ml, the slope was 0.81 ml/year and the r2 value was 0.40. For both males and females the slope was significantly different from a value of 0 ml/year but the male-female difference in slopes was not statistically significant (t=-0.59, p=0.56). MACS volume as a function of age is shown in Figure 2A. For both females and males, MACS volume showed an approximately linear relationship with age. The fit of the respective regression lines to the data was relatively tight to age 10 years, but after that age, and especially in males, the data points were more scattered about the respective regression lines.
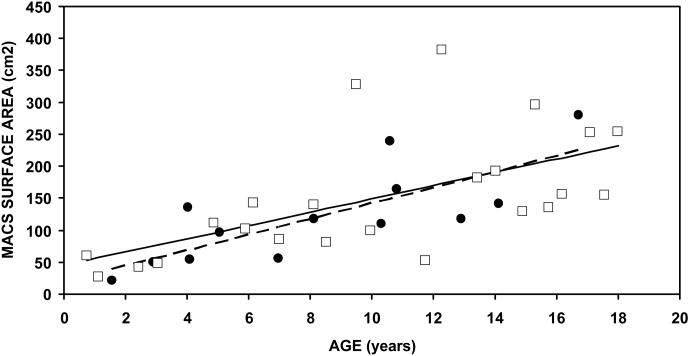
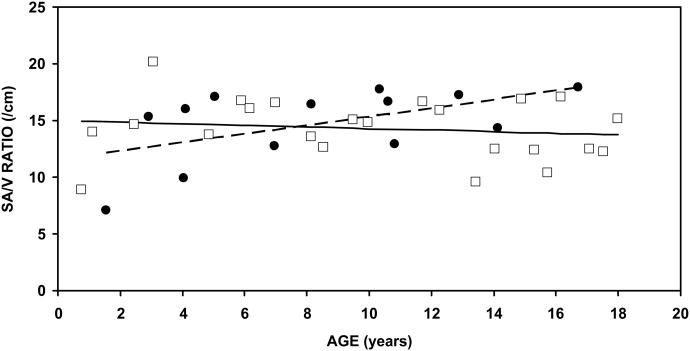
Figure 2.
Average left and right Volume (A), Surface Area (B) and the SA/V Ratio for each individual as a function of Age. Closed circles denote the MACS for female subjects and open squares denote the MACS for male subjects. The broken line is the solution of the regression equation for the data of female subjects and the solid line is the solution of the regression equation for the data of male subjects.
The sixth and seventh rows of the Table report the regression parameters for the MACS surface areas of female and male subjects as a function of age. The intercept was highly variable being 19.2 cm2 in females and 45.2 cm2 in males. The respective slopes were 12.3 and 10.4 cm2/year and both were significantly different from a value of 0 cm2/year. Like MACS volume, the difference in slopes between females and males was not statistically significant (t=-0.42, 0.68). The r2 values for females and males were 0.60 and 0.36, respectively. Figure 2b shows the MACS surface area as a function of age for females and males. The fit of regression lines to the MACS surface areas was relatively tight until age 10 years, but then showed a wider scatter.
The eight and ninth rows of the Table report the regression parameters for the SA/V ratios of females and males as function of age. In females, the slope was 0.4/cm/year, intercept was 11.5/cm and r2 was 0.30, and the difference of the measured slope from a value of 0/cm/year was statistically significant (p=0.05). In contrast, for males, the slope was -0.07/cm/year, intercept was 15.0/cm and r2 was 0.02, and the measured slope was not different from 0/cm/year (p=0.51). The difference in slopes between males and females was statistically significant (t=-2.38, p=0.02). These data indicate that the SA/V ratio is not affected by age in males but does show a shallow increase with age in females. Figure 3b shows the relationship between SA/V and age for females and males. Of interest, SA/V ratios averaged over all ages was 14.72/cm for females and 14.27 for males and the male-female difference was not statistically significant (t=0.45, p=0.66).
Discussion
The present study focused on the growth and development of MACS geometry as reflected in the volume, surface area and SA/V ratio. MACS geometry was reconstructed from CT scans obtained from a cross-sectional sample of subjects aged 0.8 to 18 years with no history of ear disease or any abnormalities detected on the CT scan. The results showed that the right and left values of these 3 parameters across ages were highly correlated; MACS volume and surface area for male and female subjects showed a continued increase from 1 to 18 years of age, and the SA/V ratio for males was independent of age but for females showed a shallow increase with advancing age. Moreover, for MACS volume and surface area, the data distribution about the respective regression lines was much wider after age 10 years when compared to that before age 10 years.
A number of past studies that addressed growth of MACS volume as measured planimetrically were reviewed by Cinamon (13). The resolution of three of these studies was too course (5 year average age bins) to provide clear patterns of the change in MACS pneumatization during growth and development. However, 3 other studies provided yearly data for the period from 1 to 6 years that estimated MACS volume from surface pneumatization in ears without a history of middle ear disease. MACS pneumatization for all three studies showed a linear growth over that age range (17-19). The studies by Qvarnberg and by Rubesohm had an extended yearly follow-up to age 18 years. The pattern of MACS pneumatization was characterized by a rather rapid change to a maximum of 10 to 12 cm2 at age 10 years but no further change after that age to at least age 18 years (the termination of follow-up) (17, 18). This pattern is not consistent with our data or those of other studies (14, 15).
The differences between the results of our study and those based on planimetric methods may reflect the superiority of the CT reconstructions for determining MACS geometry (20). In that regard, two past cross-sectional studies reconstructed MACS geometry using CT methodologies.
The first study reconstructed MACS volumes using CT scans from 199 ears of 102 Korean subjects aged 6 to 84 years (14). Because the younger age groups were absent or under-represented and averages were provided for binned age ranges of 10 years, the results are not strictly comparable to those of the present study, but maximum MACS volume and pattern of change can be examined. Their results showed that volume increased from 3 ml at age 6 to peak at 7.5 ml at age 20 to 29 years and then showed a progressive decrease to 2 ml at age 80 to 89 years. For the age-range included in both our and the Korean study, MACS volume was much smaller in the latter. As we did not collect scans for individuals older than 18 years, it is not possible to judge if the peak observed at 20 to 29 years is real or an artifact and it is difficult to understand the progressively lesser MACS volumes between the 30 to 80 year age groups. For the oldest age groups (70+years), the investigators suggest that the small MACS volume is a consequence of deprivations associated with the Korean War but the decrease began much earlier than that decade.
The second study by Csakanyi and colleagues reconstructed MACS geometry from the CT scans of 40 children without a history of middle ear disease aged 2.5 to 17.5 years (15). As with our study, they reported high left-right correlations for MACS volume, surface area and the SA/V ratio. The average MACS volumes were comparable to those measured in the present study but their estimated MACS surface areas were approximately 60% of that measured in our study. Also, while our data show a relatively linearity for surface area and volume over the studied age range, Csakanyi and colleagues reported an increase in surface area and volume to age 7 to 8 years followed by a plateau between 9 to 13 years and then a resumed increase. In passing, they commented that the SA/V ratio did not change with age.
Given that the SA/V ratio for our study was approximately 14.5/cm, the MACS surface area measured by Csakanyi was approximately 60% of that measured by us, and the MACS volumes measured in the two studies were similar, we can estimate a SA/V ratio of approximately 8.6/cm for the data presented by Csakanyi and colleagues. This value is inconsistent with that measured in the present study and in two studies of adults with a wide range of MACS volumes (15.9/cm and 17.1/cm) that used similar reconstruction techniques (8, 16). We suggest that the low SA/Vs measured by Csakanyi and colleagues are attributable to features of their segmentation and measurement routines that over estimate volume by including structures other than the MACS and by underestimating surface area because most, but not all MACS septa include gas exchange surfaces on both sides (15).
For bilateral structures, a high correlation between measures for the two sides is indicative of a strong genetic component. The high left-right correlations measured for MACS volume and surface area by us and others (15) during growth and in adults over a wide range of volumes (8) support this position. Small MACS have been related to a susceptibility to middle ear diseases (2-6), but it is not clear if genetically programmed small MACS predispose to otologic diseases or if otologic diseases stunt the growth of the MACS.
To date, only the study by Csakanyi used CT reconstruction of the MACS to compare its growth and development between children who did and did not (as presented above) have a history of middle ear disease over a wide age range (15). MACS volume and surface area did not change with age in those with a history of middle ear disease but showed the pattern reported above for those with no history of middle ear disease. When combined with the high left-right correlations for MACS surface area and volume, these results provide some support that MACS growth is stunted by middle ear disease. However, this evidence is weakened by the fact that all ears with a history of middle ear disease also had concurrent otitis media and therefore the cause-effect controversy cannot be resolved using these data.
One MACS parameter that contributes to the middle ear pressure balance is the SA/V ratio for the middle ear (8, 21). This cannot be estimated using planar X-rays but requires 3-D reconstructions using methods such as those used in this and other studies (7, 8, 15). Indeed, it may not be the volume of the MACS that determines the risk for middle ear disease but rather the SA/V ratio for the middle ear. This should be explored further in future studies.
In summary, the age-related change in MACS volume (and other parameters) for children with no history of middle ear disease have been measured using different techniques and different age resolutions. However, the MACS volume versus age trajectories for these studies are not consistent. Moreover, only one study explored the differences in MACS growth and development between children with and without a history of middle ear disease and few studies examined the age-related changes in other important MACS parameters such as surface area and the SA/V ratio. To clarify the relationship between MACS volume and risk for middle ear disease and the directional causality of this effect, future studies should be directed toward describing the growth and development of MACS geometry as represented by volume, surface area and the SA/V ratio in children with and without a history of middle ear disease with a particular focus on children with a history of unilateral middle disease.
Acknowledgments
We thank the members of the Radiology Department for their assistance with retrieval of the CT scans used in the present study.
Supported in part by a grant from the National Institutes of Health (DC007667).
Footnotes
Conflict Of Interest Statement: None of the authors have a conflict of interest associated with this manuscript.
References
- 1.Doyle WJ. The mastoid as a functional rate-limiter of middle ear pressure change. Int J Pediatr Otorhinolaryngol. 2007 Mar;71(3):393–402. doi: 10.1016/j.ijporl.2006.11.004. [DOI] [PMC free article] [PubMed] [Google Scholar]
- 2.Sade J, Fuchs C. A comparison of mastoid pneumatization in adults and children with cholesteatoma. Eur Arch Otorhinolaryngol. 1994;251(4):191–5. doi: 10.1007/BF00628421. [DOI] [PubMed] [Google Scholar]
- 3.Sade J, Fuchs C. Secretory otitis media in adults: I. The role of mastoid pneumatizationas a risk factor. Ann Otol Rhinol Laryngol. 1996 Aug;105(8):643–7. doi: 10.1177/000348949610500810. [DOI] [PubMed] [Google Scholar]
- 4.Sade J, Fuchs C. Secretory otitis media in adults: II. The role of mastoid pneumatization as a prognostic factor. Ann Otol Rhinol Laryngol. 1997 Jan;106(1):37–40. doi: 10.1177/000348949710600107. [DOI] [PubMed] [Google Scholar]
- 5.Lesinskas E. Factors affecting the results of nonsurgical treatment of secretory otitis media in adults. Auris Nasus Larynx. 2003 Feb;30(1):7–14. doi: 10.1016/s0385-8146(02)00100-1. [DOI] [PubMed] [Google Scholar]
- 6.Valtonen HJ, Dietz A, Qvarnberg YH, Nuutinen J. Development of mastoid air cell system in children treated with ventilation tubes for early-onset otitis media: a prospective radiographic 5-year follow-up study. Laryngoscope. 2005 Feb;115(2):268–73. doi: 10.1097/01.mlg.0000154731.08410.b8. [DOI] [PubMed] [Google Scholar]
- 7.Swarts JD, Cullen Doyle BM, Alper CM, Doyle WJ. Surface area-volume relationships for the mastoid air cell system and tympanum in adult humans: Implications for mastoid function. Acta Otolaryngol. Nov;130(11):1230–6. doi: 10.3109/00016489.2010.480982. [DOI] [PMC free article] [PubMed] [Google Scholar]
- 8.Swarts JD, Doyle BM, Doyle WJ. Relationship between surface area and volume of the mastoid air cell system in adult humans. J Laryngol Otol. Jan;5:1–5. doi: 10.1017/S0022215110002811. [DOI] [PMC free article] [PubMed] [Google Scholar]
- 9.Diamant M. Mastoid Pneumatization and Normal Curve Distribution. Acta Otolaryngol. 1965 Jul-Aug;60:167–74. [PubMed] [Google Scholar]
- 10.Aoki K, Esaki S, Honda Y, Tos M. Effect of middle ear infection on pneumatization and growth of the mastoid process. An experimental study in pigs. Acta Otolaryngol. 1990 Nov-Dec;110(5-6):399–409. doi: 10.3109/00016489009107461. [DOI] [PubMed] [Google Scholar]
- 11.Ikarashi F, Nakano Y, Okura T. The relationship between the degree of chronic middle ear inflammation and tympanic bulla pneumatization in the pig as animal model. Eur Arch Otorhinolaryngol. 1994;251(2):100–4. doi: 10.1007/BF00179901. [DOI] [PubMed] [Google Scholar]
- 12.Tos M, Stangerup SE. Mastoid pneumatization in secretory otitis. Further support for the environmental theory. Acta Otolaryngol. 1984 Jul-Aug;98(1-2):110–8. doi: 10.3109/00016488409107542. [DOI] [PubMed] [Google Scholar]
- 13.Cinamon U. The growth rate and size of the mastoid air cell system and mastoid bone: a review and reference. Eur Arch Otorhinolaryngol. 2009 Jun;266(6):781–6. doi: 10.1007/s00405-009-0941-8. [DOI] [PubMed] [Google Scholar]
- 14.Lee DH, Jun BC, Kim DG, Jung MK, Yeo SW. Volume variation of mastoid pneumatization in different age groups: a study by three-dimensional reconstruction based on computed tomography images. Surg Radiol Anat. 2005 Mar;27(1):37–42. doi: 10.1007/s00276-004-0274-7. [DOI] [PubMed] [Google Scholar]
- 15.Csakanyi Z, Katona G, Josvai E, Mohos F, Sziklai I. Volume and surface of the mastoid cell system in otitis media with effusion in children: a case-control study by three-dimensional reconstruction of computed tomographic images. Otol Neurotol. Jan;32(1):64–70. doi: 10.1097/MAO.0b013e3181fcec84. [DOI] [PubMed] [Google Scholar]
- 16.Park MS, Yoo SH, Lee DH. Measurement of surface area in human mastoid air cell system. J Laryngol Otol. 2000 Feb;114(2):93–6. doi: 10.1258/0022215001904969. [DOI] [PubMed] [Google Scholar]
- 17.Qvarnberg Y. Acute otitis media. A prospective clinical study of myringotomy and antimicrobial treatment. Acta Otolaryngol Suppl. 1981;375:1–157. [PubMed] [Google Scholar]
- 18.Rubensohn G. Mastoid Pneumatization in Children at Various Ages. Acta Otolaryngol. 1965 Jul-Aug;60:11–4. doi: 10.3109/00016486509126983. [DOI] [PubMed] [Google Scholar]
- 19.Kawamura S, Okabe K, Mogi S, Terao A. the Normal Development of the Mastoid Pneumatic Cells. Nippon Jibiinkoka Gakkai Kaiho. 1963 Jul;66:909–12. doi: 10.3950/jibiinkoka.66.909. [DOI] [PubMed] [Google Scholar]
- 20.Todd NW, Pitts RB, Braun IF, Heindel H. Mastoid size determined with lateral radiographs and computerized tomography. Acta Otolaryngol. 1987 Mar-Apr;103(3-4):226–31. [PubMed] [Google Scholar]
- 21.Alper CM, Kitsko DJ, Swarts JD, Martin B, Yuksel S, Cullen Doyle BM, et al. Role of the mastoid in middle ear pressure regulation. Laryngoscope. Feb;121(2):404–8. doi: 10.1002/lary.21275. [DOI] [PMC free article] [PubMed] [Google Scholar]


