Abstract
Background
Apamin-sensitive K currents (IKAS) are upregulated in heart failure (HF). We hypothesize that apamin can flatten action potential duration restitution (APDR) curve and reduce ventricular fibrillation (VF) duration in failing ventricles.
Methods and Results
We simultaneously mapped membrane potential and intracellular Ca (Cai) in 7 rabbits hearts with pacing-induced HF and in 7 normal hearts. A dynamic pacing protocol was used to determine APDR at baseline and after apamin (100 nM) infusion. Apamin did not change APD80 in normal ventricles, but prolonged APD80 in failing ventricles at either long (≥300 ms) or short (≤170 ms) pacing cycle length (PCL), but not at intermediate PCL. The maximal slope of APDR curve was 2.03 [95% CI, 1.73 to 2.32] in failing ventricles and 1.26 [95% CI, 1.13 to 1.40] in normal ventricles at baseline (p=0.002). After apamin administration, the maximal slope of APDR in failing ventricles decreased to 1.43 [95% CI, 1.01 to 1.84] (p=0.018) whereas no significant changes were observed in normal ventricles. During VF in failing ventricles, the number of phase singularities (baseline vs apamin, 4.0 vs 2.5), dominant frequency (13.0 Hz vs 10.0 Hz), and VF duration (160 s vs 80 s) were all significantly (p<0.05) decreased by apamin.
Conclusions
Apamin prolongs APD at long and short, but not at intermediate PCL in failing ventricles. IKAS upregulation may be antiarrhythmic by preserving the repolarization reserve at slow heart rate, but is proarrhythmic by steepening the slope of APDR curve which promotes the generation and maintenance of VF.
Keywords: ventricular fibrillation, optical mapping, experimental models heart failure, electrophysiology
Heart failure (HF) is associated with significant electrophysiological remodeling of the repolarization currents, including downregulation of most potassium currents and upregulation of late sodium and sodium-calcium exchange current.1 These changes tend to prolong action potential duration (APD). On the other hand, the APD in patients or animals with structural heart diseases, including HF, shortens more rapidly than normal ventricles during rapid pacing, leading to increased slope of APD restitution (APDR) curve.2, 3 A steep APDR curve promotes dynamical instability, wavebreaks and ventricular fibrillation (VF).4–8 The mechanisms by which HF lengthens APD at slow pacing rates but shortens APD and increases the slope of APDR at fast pacing rates remains incompletely understood. One possible explanation is that failing ventricular cells (but not normal ventricular cells) exhibit increased apamin-sensitive small conductance calcium activated K (SK) current (IKAS).9 The SK channels are first discovered in the brain,10 but it is also known to play an important role in cardiac repolarization.9, 11, 12 The importance of IKAS in human ventricular repolarization is further documented by studies in the cells isolated from the native hearts of the transplant recipients.13 The latter study showed that blocking IKAS by apamin lengthens the APD of failing human ventricular myocyte by an average of 11.8%. Because multiple other K currents are downregulated in heart failure,1 upregulation of IKAS plays an important role in ventricular repolarization in failing ventricles. The SK channel is sensitive to intracellular calcium (Cai). Because rapid pacing causes Cai accumulation, IKAS activation in failing but not normal ventricles could lead to more APD shortening at rapid pacing rate and steepened APDR curve. If this is true, then IKAS blockade by apamin (a specific IKAS blocker)14 should flatten the APDR, reduce wavebreaks and hinder the maintenance of VF. To determine the importance of IKAS on APDR, we simultaneously mapped the membrane potential (Vm) and Cai in normal and failing ventricles at different pacing cycle lengths (PCLs) before and after apamin administration. We also studied the wavebreaks and the duration of pacing-induced VF in these hearts. The results were used to test the hypotheses that (a) IKAS activation promotes steeper APDR in failing ventricles, and (b) that IKAS blockade by apamin flattens APDR curve, prevents wavebreaks and shortens VF duration in failing ventricles.
Methods
This study protocol was approved by the Institutional Animal Care and Use Committee of Indiana University School of Medicine and the Methodist Research Institute, and conforms to the Guide for the Care and Use of Laboratory Animals.15 New Zealand white female rabbits (N=27) were used. We attempted to induce HF in 10 rabbits by rapid pacing. Among them, 7 completed the pacing protocol and developed HF. The remaining 3 rabbits died 1.7 [95% CI, 0.2 to 3.1] days after the onset of tachycardia pacing at 250 bpm. We studied 7 normal rabbit hearts as controls. The other 10 hearts were used for western blot analyses (5 with pacing-induced HF and 5 normal controls). A detailed method section is included in an online supplement.
Pacing-induced Heart Failure and Optical Mapping
Rapid ventricular pacing was used to induce HF.9 The hearts were Langendorff perfused at 25 to 35 mL/min with oxygenated Tyrode’s solution (in mmol/L: NaCl 125, KCl 4.5, NaHCO3 24, NaH2PO4 1.8, CaCl2 1.8, MgCl2 0.5, and glucose 5.5) with a pH of 7.40. The hearts were stained with Rhod-2 AM (1.48 µmol/L) for Cai and RH237 (10 µmol/L) for Vm mapping. The double-stained hearts were illuminated with a laser at 532 nm wavelength. The fluorescence was filtered and recorded simultaneously 2ms/frame and 100×100 pixels with a spatial resolution of 0.35×0.35 mm2 per pixel. Optical signals were processed with both spatial (3×3 pixels Gaussian filter) and temporal (3 frames moving average) filtering. Phase mapping was performed to evaluate the location and evolution of phase singularities (PSs).
Statistical Analysis
Data are presented as mean and 95% confidence interval (CI). Wilcoxon rank sum test was used to compare the data within and between groups. Categorical parameters between groups were compared by Fisher’s exact test. Pearson correlation coefficient was used to measure the association of continuous measures. The p-values are corrected for multiple comparison in relevant analyses using Bonferonni adjustment. A two-sided p-value of ≤ 0.05 was considered statistically significant.
Results
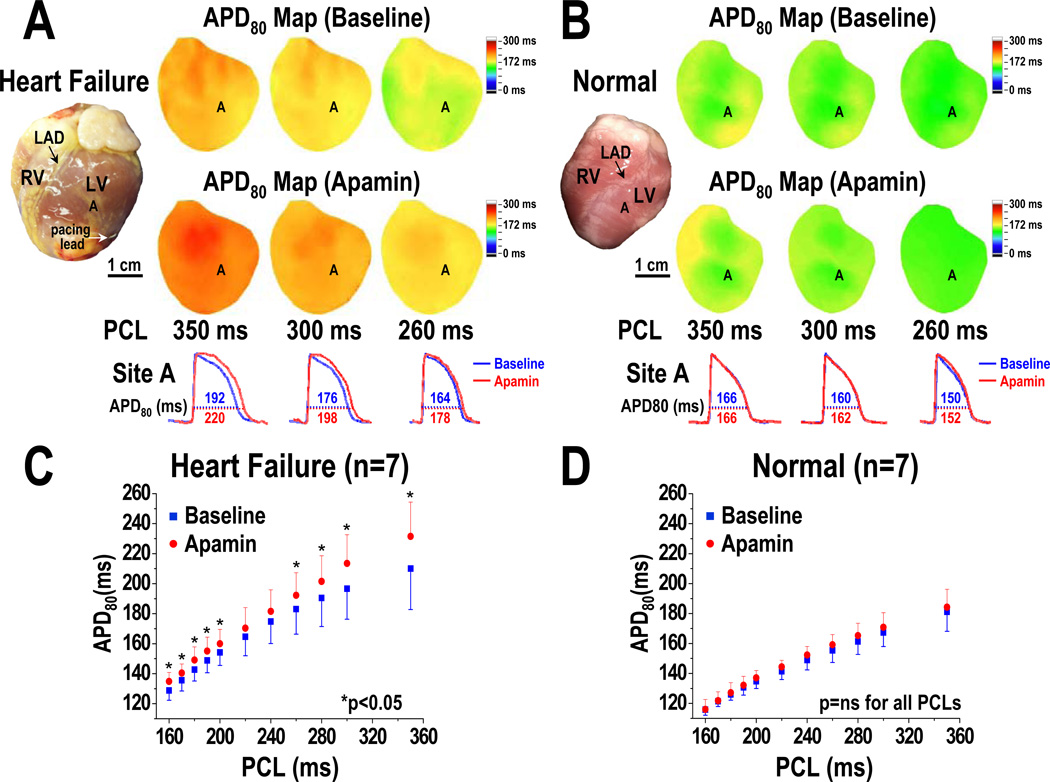
All rabbits that survived the rapid pacing protocol showed clinical signs of HF, including appetite loss, tachypnea, lethargy, pleural effusion, ascites, and visible congestion of lung, liver, and gastrointestinal tract. HF ventricles demonstrated significant increases in left ventricular end-diastolic dimension (12.7 [95% CI, 11.0 to 14.5] mm, 16.7 [95% CI, 15.4 to 17.9] mm, for normal and HF, respectively, p=0.017) and end-systolic dimension (8.2 [95% CI, 6.9 to 9.6] mm vs 14.8 [95% CI, 13.4 to 16.1] mm, p=0.012), decreases in fractional shortening (35.4 [95% CI, 30.5 to 40.2] % vs 11.4 [95% CI, 8.7 to 14.1] %, p=0.012) and ejection fraction (68.6 [95% CI, 62.5 to 74.8] % vs 26.8 [95% CI, 21.2 to 32.3] %, p=0.012). Figure 1 shows the marked cardiac enlargement typical for all failing hearts.
Figure 1.
PCL and the effects of apamin on APD prolongation. A and B show HF and normal ventricles, respectively. Note that HF ventricles have longer baseline APD than normal ventricles. Apamin prolonged APD in HF but not in normal ventricles. C and D, APD associated with different PCLs at baseline and after apamin infusion in HF and normal ventricles, respectively. Error bars represent standard deviation. The HF ventricles but not normal ventricles showed significant APD prolongation at long and short PCLs. The p-values in Figure 1C are corrected by Bonferroni method for multiple comparisons. Asterisks indicate corrected p<0.05. LAD, left anterior descending coronary artery; RV, right ventricle; LV, left ventricle.
Pacing Cycle Length and APD Prolongation Induced by Apamin
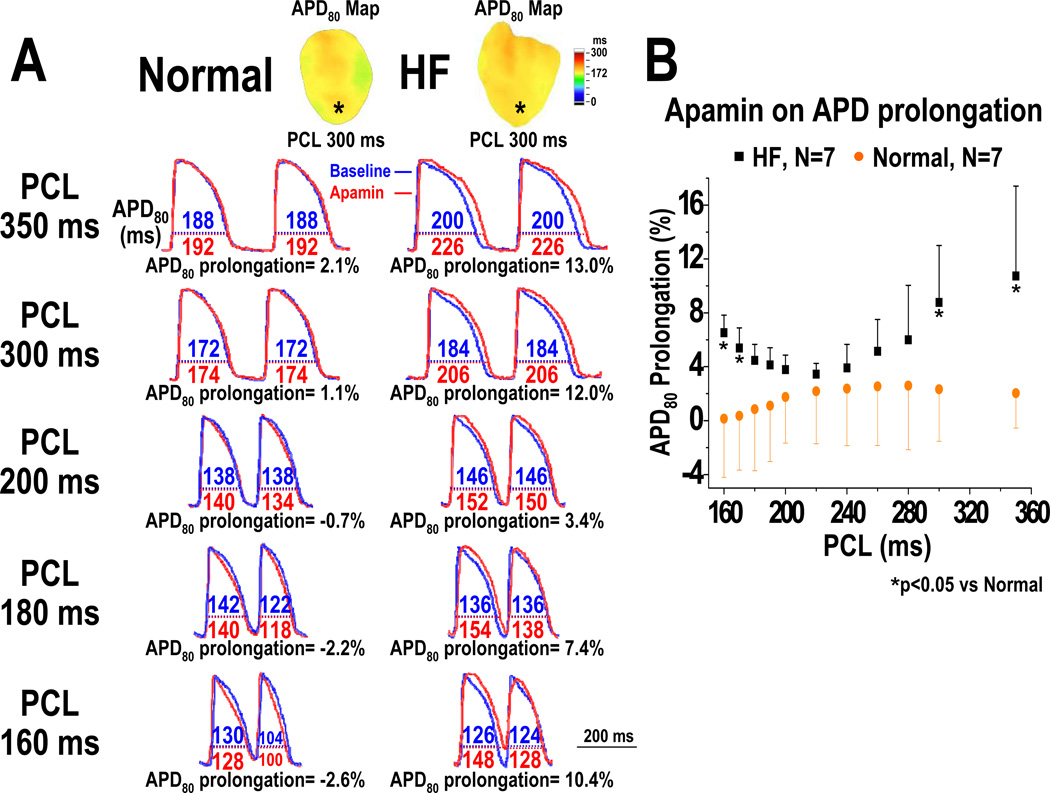
An unexpected finding is that blocking IKAS by apamin results in ventricular APD80 prolongation only with very short and very long PCLs, but not with intermediate PCLs. At baseline, HF ventricles have longer APD80 than normal ventricles at all PCLs (Figures 1A and 1B). Apamin administration did not prolong APD80 in normal ventricles at any PCL (i.e., at PCL 350 ms, baseline: 181 [95% CI, 167 to 195] ms, apamin: 184 [95% CI, 172 to 197] ms, p=0.14; at PCL 300 ms, baseline: 167 [95% CI, 159 to 176] ms, apamin: 171 [95% CI, 162 to 180] ms, p=0.24) (Figures 1B and 1D). In the failing ventricles, apamin prolonged APD80 at multiple PCLs (i.e., at PCL 350 ms, baseline: 210 [95% CI, 185 to 235] ms, apamin: 231 [95% CI, 210 to 253] ms, p=0.028; at PCL 200 ms, baseline: 154 [95% CI, 146 to 162] ms, apamin: 160 [95% CI, 151 to 169] ms, p=0.02; at PCL 170 ms, baseline: 136 [95% CI, 129 to 142] ms, apamin: 140 [95% CI, 133 to 148] ms, p=0.043) (Figure 1C). Here the p values are already adjusted by Bonferroni correction. In Figure 1C, 9 out of the 11 comparisons are statistically significant. In Figure 1D, all the p values remained non-significant (>0.05). The effects of apamin on the percentage of APD80 prolongation were PCL dependent (Figure 2). After adding apamin, the HF ventricles have larger percentage of APD80 prolongation than normal ventricles. The effects were more apparent at very long PCLs (at PCL 350 ms, normal: 2.0 [95% CI, −1.2 to 5.3] %, HF: 10.7 [95% CI, 4.6 to 16.9] %, p=0.04; at PCL 300 ms, normal: 2.3 [95% CI, −1.2 to 5.9] %, HF: 8.8 [95% CI, 4.9 to 12.7] %, p=0.02) than at very short PCLs (at PCL 170 ms, normal: 0.4 [95% CI, −3.4 to 4.1] %, HF: 5.4 [95% CI, 3.5 to 7.2] %, p=0.03; at PCL 160 ms, normal: 0.1 [95% CI, −3.9 to 4.2] %, HF: 6.5 [95% CI, 4.9 to 8.2] %, p=0.03). With the intermediate PCLs (280 ms-180 ms), the differences between normal and failing ventricles were not significant (Figure 2).
Figure 2.
Effect of apamin on the percentage of APD prolongation in normal and HF ventricles. A, APD80 before (blue line) and after (red line) apamin infusion, and the percentage of APD80 prolongation at PCL 350, 300, 200, 180, and 160 ms in a normal and a HF ventricle. B, PCL and the percentage of APD80 prolongation by apamin in all normal and HF ventricles. Note that the differences between HF and normal ventricles were significant only at very long (350 ms- 300 ms) and short (170 ms- 160 ms) PCLs (see asterisks), but not with intermediate (280 ms- 180 ms) PCLs.
Secondary Rise of Cai in HF Ventricles
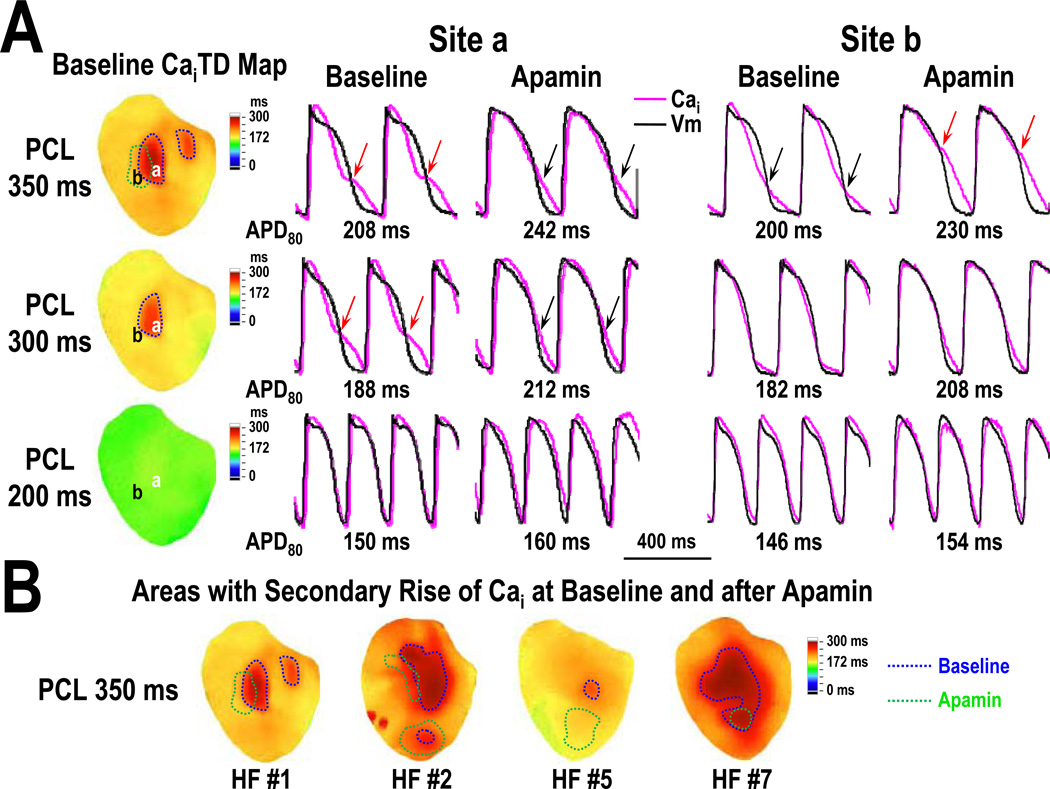
In 4 of the 7 HF ventricles, we observed that the initial short Cai transient was followed by a secondary rise of Cai when paced at 350 ms PCL (Figure 3A, red arrows at site a). Apamin administration lengthened APD80 and widened the initial phase of Cai transient, making the secondary rise of Cai less apparent (Figure 3A, black arrows at site a). However, apamin could also induce secondary rise of Cai in areas without secondary rise of Cai at baseline (Figure 3A, site b). Figure 3B shows the area of the mapped region exhibiting secondary rise of Cai in these 4 HF ventricles at PCL 350 ms. Before apamin infusion, the area averaged 19 [95% CI, −3 to 41] % of epicardial surface of 4 HF ventricles (Figure 3B, areas encircled by blue line). After apamin, the area with secondary rise of Cai (Figure 3B, areas encircled by green line) decreased to 9 [95% CI, −1 to 18] % (p=0.25). Apamin infusion could induce secondary rise of Cai in 6 [95% CI, −4 to 16] % of the mapped areas where no secondary rise of Cai was observed at baseline. Baseline APD80 at PCL 350 ms averaged 216 [95% CI, 188 to 243] ms in areas without Cai rise area and 245 [95% CI, 201 to 289] ms in areas with Cai rise (p=0.12). In 4 HF ventricles with secondary rises of Cai at PCL 350 ms, the standard deviation (SD) of APD80 was decreased from 17 [95% CI, 9 to 25] ms to 10 [95% CI, 6 to 13] ms by apamin (p=0.037). In contrast, in the remaining 3 HF ventricles without secondary rises of Cai at PCL 350 ms, the SD of APD80 was not significantly changed by apamin (baseline: 10 [95% CI, 1 to 19] ms, apamin: 7 [95% CI, 1 to 13] ms, p=0.068). The HF ventricles with secondary rise of Cai (N=4) showed increased thickness of interventricular septum after tachycardia pacing (by 36 [95% CI, −17 to 88] %). In comparison, the HF ventricles without secondary rise of Cai (N=3) showed a reduction of the thickness of interventricular septum (−37 [95% CI, −60 to −14] %, p=0.034). None of the 7 normal ventricles showed secondary rises of Cai at any PCL (p=0.021). Apamin did not prolong the APD80 or change action potential morphology in any normal ventricles.
Figure 3.
Secondary rise of Cai in HF ventricles. A, CaiTD map and optical Cai tracings at sites a and b. Red arrows on the tracing marks secondary rise of Cai. Area with secondary rise of Cai at baseline and after apamin infusion were encircled by blue and green lines respectively on the CaiTD map. Note that the area with secondary rise of Cai progressively diminished as PCL decrease. At site a with 350 ms PCL, apamin infusion made the secondary rise in Cai less apparent (black arrows) probably because of the increased duration of the initial Ca elevation during phase 2 of the action potential. In contrast, apamin infusion can also induce secondary rise of Cai in areas without them at baseline (site b, red arrows). B shows the CaiTD map of all 4 hearts with secondary rise in Cai at 350 ms PCL. Note that the distribution of these areas is heterogeneous before and after apamin infusion. CaiTD, intracellular Ca transient duration.
Effects of Apamin on Spatial Heterogeneity of APD
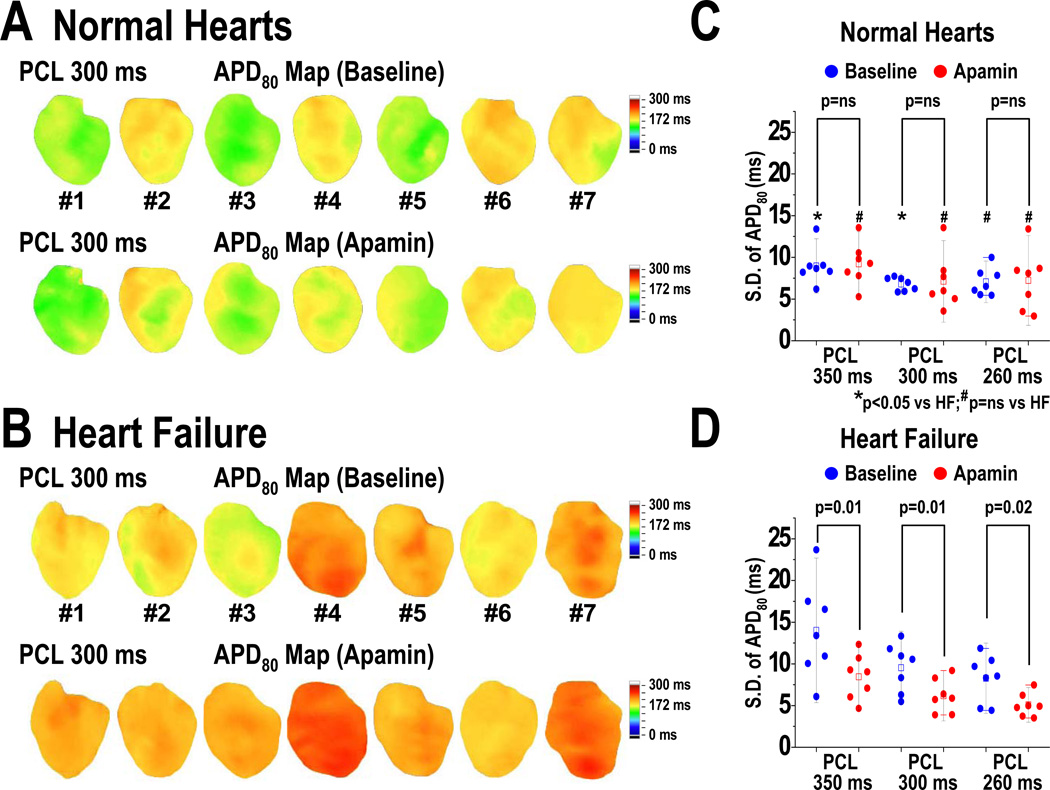
Long PCLs are also associated with significant spatial heterogeneity of APD in failing ventricles. We used the SD of APD80 at all mapped pixels to measure the spatial heterogeneity of APD. Figure 4 shows the APD80 maps before and after apamin infusion in normal (4A) and HF ventricles (4B) at 300 ms PCL. At baseline, APD80 distribution is more heterogeneous in HF than normal ventricles (Figure 4A, 4B). The average SD of APD80 was consistently higher in HF than normal ventricles (at PCL 350 ms, HF: 14 [95% CI, 9 to 19] ms, normal: 8 [95% CI, 7 to 9] ms, p=0.04; at PCL 300 ms, HF: 10 [95% CI, 7 to 12] ms, normal: 7 [95% CI, 6 to 8] ms, p=0.048) (Figures 4C and 4D, asterisks). In normal ventricles, apamin did not change the SD of APD80 at any PCL (Figure 4C). In HF ventricles after apamin infusion, APD80 distribution became more homogenous than baseline (Figure 4B). The SD of APD80 was consistently decreased by apamin (Figure 4D). Furthermore, the SDs after apamin in HF and normal ventricles were not statistically different (at PCL 350 ms, HF: 8 [95% CI, 6 to 11] ms, normal: 9 [95% CI, 6 to 12] ms, p=0.63; at PCL 300 ms, HF: 6 [95% CI, 4 to 8] ms, normal: 7 [95% CI, 4 to 10] ms, p=0.53; at PCL 260 ms, HF: 5 [95% CI, 4 to 6] ms, normal: 7 [95% CI, 4 to 11] ms, p=0.18). These findings indicate that heterogeneous distribution of IKAS is largely responsible for the repolarization heterogeneity in HF ventricles.
Figure 4.
Effect of apamin on spatial heterogeneity of APD in normal and HF ventricles. A and B, APD80 maps of all normal and HF ventricles, respectively, at baseline and after apamin infusion at 300 ms PCL. C and D show SD of APD80 in normal and HF ventricles, respectively, before and after apamin infusion during 3 different PCLs. Apamin significantly reduced the SD of APD80 to the level observed in normal ventricles. SD, standard deviation. Error bars represent SD. The small squares in the data box indicate the mean value.
Correlation between Delta APD and Baseline APD
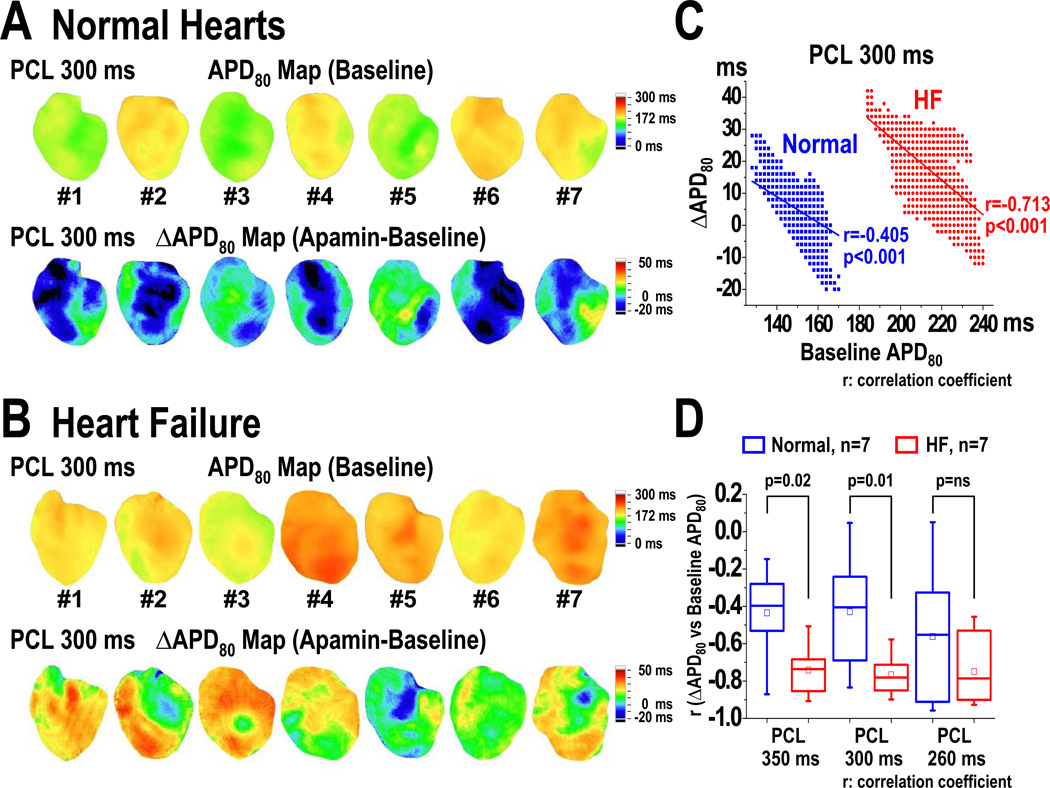
APD difference (ΔAPD, apamin-treated APD80 minus baseline APD80) maps were used to characterize the 2D distribution of IKAS (Figure 5). In normal ventricles, apamin did not significantly prolong the APD80. The ΔAPD map showed variable changes of APD80 including areas of APD80 shortening (blue) and prolongation (green) (Figure 5A). In HF ventricles, the ΔAPD map showed greater and more heterogeneously distributed ΔAPD than normal ventricles (Figure 5B). Figure 5C shows the correlation between ΔAPD and baseline APD80 in a HF and a normal ventricle. HF ventricles showed a steeper negative correlation than normal ventricles at longer PCL (at PCL 350 ms, HF r= −0.74 [95% CI, −0.86 to −0.62], normal r= −0.44 [95% CI, −0.70 to −0.17], p=0.02; at PCL 300 ms, HF r= −0.77 [95% CI, −0.86 to −0.67], normal r= −0.43 [95% CI, −0.70 to −0.15], p=0.01) but not at intermediate PCL (260 ms) (Figure 5D). The negative correlation indicates that apamin induces more APD80 prolongation in areas with short APD80 than with long APD80 at baseline.
Figure 5.
Effects of apamin on the correlation between delta APD (ΔAPD, apamin-treated APD80 minus baseline APD80) and baseline APD80 in normal and HF ventricles. A and B, baseline APD80 map and ΔAPD maps of all normal (A) and HF (B) ventricles at PCL 300 ms. In HF ventricles (B), apamin prolonged APD80 in a heterogeneous manner, leading to a heterogeneously distributed APD-prolonging area. C, correlation between ΔAPD and baseline APD80 in a HF and a normal ventricle at PCL 300 ms. The longer the baseline APD, the smaller the delta APD. D, correlation coefficient (r) between ΔAPD and baseline APD80 in 7 HF and 7 normal ventricles. Note that HF ventricles have steeper (negative) r than normal ventricles at PCL 350 and 300 ms. The small squares in the data box indicate the mean value.
Effect of Apamin on the Maximal Slope of APDR Curves
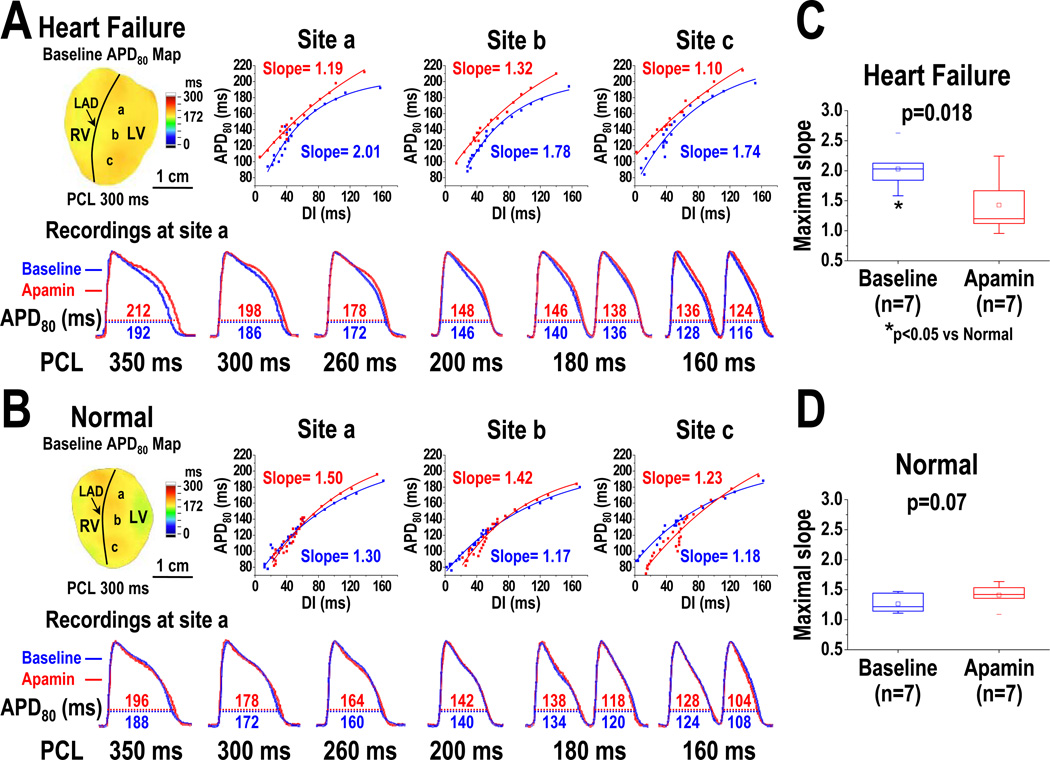
APDR curves were sampled at a basal (site a), a middle (site b), and an apical (site c) area in each heart studied (Figure 6A, 6B). In a representative HF ventricle (Figure 6A), APDR curve at these 3 sites (Figure 6A, upper panels) consistently showed that apamin prolonged APD80 at both very long (350 and 300 ms) and short (160 ms) PCLs, leading to a steepened APDR at long PCL and a flattened APDR at short PCL. In a representative normal ventricle (Figure 6B), APDR was not significantly changed by apamin. At baseline, HF ventricles have higher maximal slopes of APDR than normal ventricles (HF: 2.03 [95% CI, 1.73 to 2.32], normal: 1.26 [95% CI, 1.13 to 1.40], p=0.002) (Figure 6C, asterisk). After apamin infusion, the maximal slope of APDR decreased significantly in failing ventricles (Figure 6C); while the maximal slope did not change in normal ventricles (Figure 6D).
Figure 6.
Effects of apamin on the maximal slope of APDR curve in HF and normal ventricles. A, APDR curves and maximal slopes of the curves sampled at a basal (site a), a middle (site b), and an apical (site c) area of a failing left ventricle. Lower panel showed the APD80 before (blue line) and after (red line) apamin infusion at site a. Note that apamin prolonged APD80 at very long (350 and 300 ms) and short (160 ms) PCLs. As a result, it steepened the APDR at long PCL and flattened the APDR at short PCL. B, APDR curves and maximal slopes of the curves in a normal left ventricle. Lower panel showed the APD changed by apamin at site a. C and D, effects of apamin on the maximal slopes of APDR in HF and normal ventricles. Note that HF ventricles at baseline have higher maximal slopes than normal ventricles (asterisk in C). Apamin decreased the maximal slope in HF ventricles, but did not change the slope in normal ventricles. The small squares in the data box indicate the mean value. LAD, left anterior descending coronary artery; RV, right ventricle; LV, left ventricle.
Effect of Apamin on VF Dynamics in Failing Ventricles
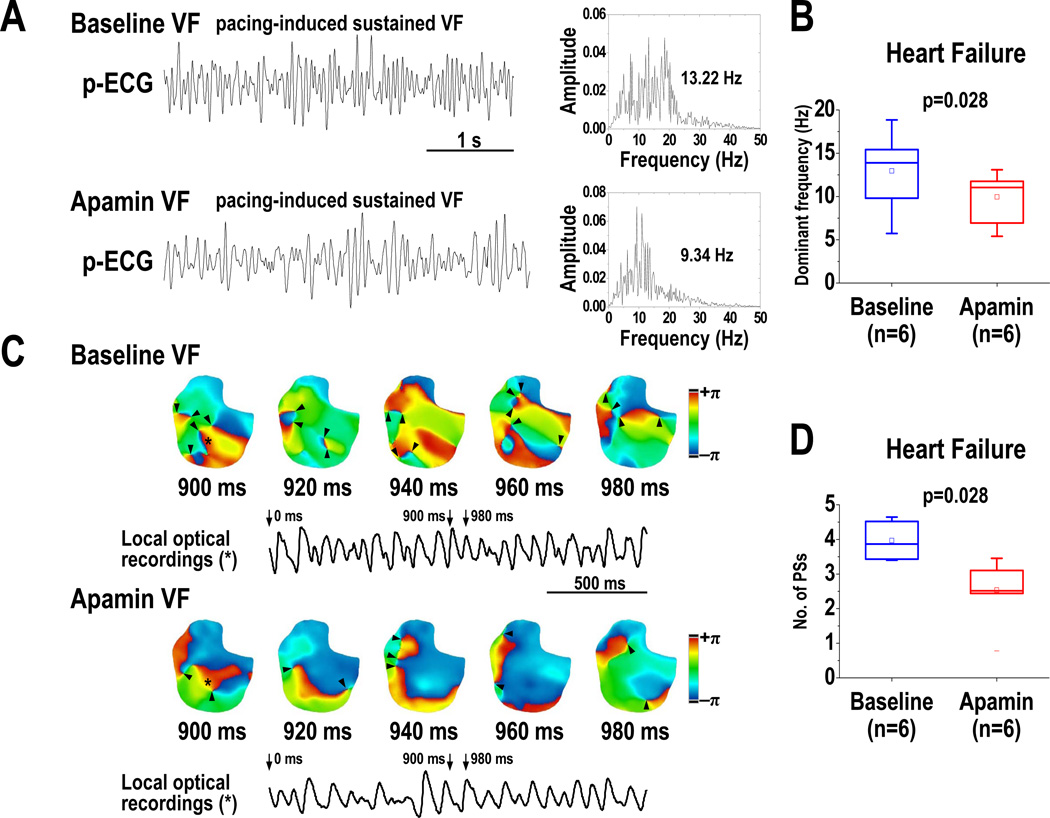
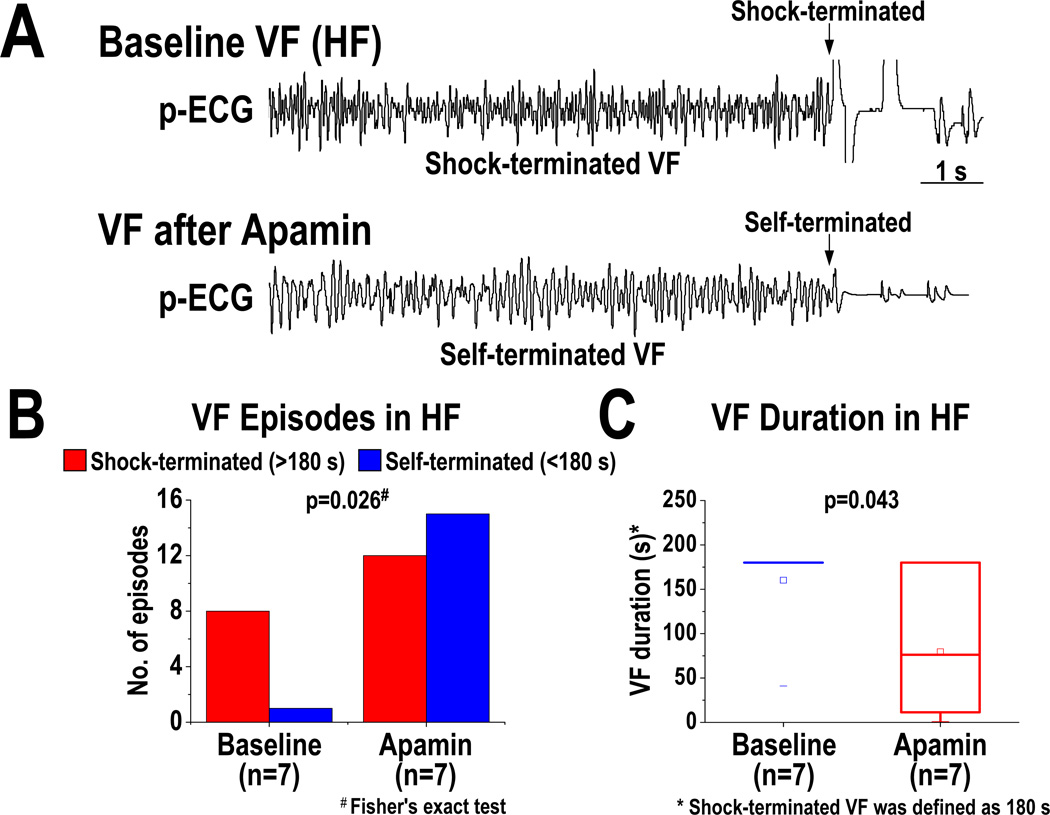
At baseline, VF was inducible in all 7 HF ventricles, but in only 1 out of the 7 normal ventricles (p<0.01). A total of 36 VF episodes (9 at baseline, 27 after apamin) were induced in HF ventricles. Figure 7A shows the p-ECG recordings of VF at baseline and after apamin infusion in a HF ventricle. The DF of VF was decreased from 13.0 [95% CI, 8.2 to 17.8] Hz at baseline to 10.0 [95% CI, 6.8 to 13.2] Hz after apamin infusion (p=0.028) (Figure 7B). Consecutive phase maps sampled at 20-ms intervals during VF were analyzed for PSs (wavebreaks). Figure 7C shows consecutive phase maps with PSs (black arrows) at baseline and after apamin infusion in a failing ventricle. Apamin decreased the number of PSs (p=0.028) (Figure 7D). Figure 8 shows the outcomes of VF episodes in HF ventricles. At baseline, most (8 out of 9) VF were shock-terminated (>180 s in duration) episodes (Figure 8A, upper panel, and Figure 8B). After apamin infusion, most (15 out of 27) VF became self-terminated (<180 s in duration) episodes (Figure 8A, lower panel, and Figure 8B) (p=0.026). We defined 180 s as the duration of VF if VF did not terminate at that time. The VF duration was decreased from 160 [95% CI, 112 to 209] s at baseline to 80 [95% CI, 8 to 151] s after apamin infusion in HF ventricles (p=0.043) (Figure 8C). Furthermore, there is a positive correlation between SD of APD80 at all mapped pixels and the duration of VF in failing ventricles (at PCL 300 ms, r=0.57, p=0.03; at PCL 260 ms, r=0.61, p=0.02).
Figure 7.
Effects of apamin on the dominant frequency (DF) and wavebreaks of VF in HF ventricles. A, p-ECG recordings of pacing-induced sustained VF episodes at baseline and after apamin infusion in a HF ventricle. Right panel shows the DF distribution of VF at baseline and after apamin infusion. B, effects of apamin on DF of VF in 6 HF ventricles. Note that the DF was decreased by apamin. C, consecutive phase maps sampled at 20-ms interval during VF at baseline and after apamin infusion. Phase singularities (wavebreaks) are indicated by black arrowheads. Lower panels showed corresponding optical recording of VF at asterisk site. D, effects of apamin on the number of phase singularities before and after apamin infusion in HF ventricles. Note that the numbers of phase singularity are decreased by apamin. The small squares in the data box indicate the mean value. PS, phase singularity; VF, ventricular fibrillation.
Figure 8.
Effects of apamin on the maintenance of VF in HF ventricles. A, p-ECG recordings of pacing-induced VF episodes at baseline and after apamin infusion in a HF ventricle. Before apamin infusion, the pacing-induced VF episode is shock-terminated (>180 s in duration, upper panel). After apamin infusion, the pacing-induced VF episode became self-terminated (<180 s in duration, lower panel). B and C, effects of apamin on the types (B) and duration (C) of VF episodes. Note that apamin increases self-terminated VF episodes and shortens VF duration. The small squares in the data box indicate the mean value.
Discussion
We found that IKAS activation is important in preserving repolarization reserve of failing ventricles at slow heart rates. However, IKAS activation is also a major factor that underlies the repolarization heterogeneity. At very short PCLs, Cai accumulation activates IKAS and steepens the APDR curve, which facilitates the generation and maintenance of VF. Apamin flattens the APDR at short PCL, decreases wavebreaks during VF activation, reduces the DF of VF and shortens the duration of VF. These findings suggest that IKAS blockade can potentially be antiarrhythmic by flattening APDR, but pro-arrhythmic by prolonging APD during bradycardia in failing ventricles.
Secondary Rise of Cai at Long PCLs
Secondary rise of Cai during the late action potential plateau is commonly observed in HF but not normal ventricular cells.16 The mechanism of secondary rise of Cai is attributed to reduced sarcoplasmic reticulum (SR) Ca release, resulting in less Ca induced inactivation of L-type Ca current (ICa,L) at the phase 2 and 3 of the action potential.17 As repolarization continues, the driving force for Ca entry increases and promotes greater Ca entry and additional SR Ca release during the latter phase of the plateau. Under these conditions, the combination of the increased late ICa,L, together with increased Na-Ca exchange current (INCX), cause further APD prolongation. In the present study, we showed that nearly 20% of the epicardial cells demonstrated secondary rises of Cai. These same areas also had longer baseline APD80 which was less responsive to apamin, compared to areas without secondary Cai rises, although the differences were not statistically significant. A possible explanation is that these areas exhibited less upregulation of IKAS than areas without secondary Cai rises. That is, in the areas without secondary Cai rises, the upregulation of IKAS was sufficient to compensate for the increased inward currents, preventing the secondary Cai rises and APD prolongation. This notion is supported by the observation that IKAS blocker can induce secondary rise of Cai in nearly 6% of the mapped areas where no secondary rise of Cai was observed at baseline in failing ventricle. Electrophysiological heterogeneity is commonly observed in failing ventricles, and contributes to the mechanisms of arrhythmogenesis.1, 18, 19 These heterogeneities are related in part to the differential remodeling of various K channels transmurally. In this study, we found that significant heterogeneity of APD is also present in different regions of the epicardium in failing ventricles at long PCL, which was decreased by apamin. These findings suggest that heterogeneous IKAS upregulation contributes to the repolarization heterogeneity in failing ventricles.
IKAS at Short and Long PCLs
The ventricular APD and the DI both shorten during rapid pacing. The relationship between APD and the previous DI can be used to construct an APDR curve.20 The APDR curve can be measured experimentally by delivering a single extrastimulus after a train of stimuli (extrastimulus technique) or by dynamic pacing protocol with progressively shortened PCL (dynamic pacing technique).6 As compared with the APDR curve determined by extrastimulus techniques, the dynamic protocol generates steeper slopes of the APDR curve that better mimic APD dynamics during rapid ventricular arrhythmias, such as VF.6 In the present study using dynamic pacing protocol, we found that APD shortening at very short PCL could be prevented by IKAS inhibition, consistent with the hypothesis that short PCL causes Cai accumulation and activates IKAS, leading to a steeper APDR.9 If Cai accumulation is important for APD response to rapid pacing, then epicardial cells of the failing ventricles should exhibit greater shortening of APD in failing ventricles because those cells have the highest expression of IKAS.9 The latter prediction was confirmed by Harada et al,21 who reported that epicardium of the failing rabbit ventricles undergoes significant APD shortening at short PCL, and that shortened APD is important to the generation of ventricular arrhythmias in that model.
A steep slope of APDR curve is associated with increased propensity for cardiac arrhythmias.4, 5, 20, 22 In the present study, IKAS inhibition flattened the APDRs which in turn decreased wavebreaks, shortened VF durations and hindered the maintenance of VF. Taken together, these data suggest that upregulation of IKAS in HF ventricles plays important roles of APD shortening during rapid pacing, which in turn steepens the slope of APDR curve and promotes the initiation and maintenance of VF.
We also found that apamin significantly lengthens APD and steepens the APDR curve at long PCL, suggesting IKAS is also important for ventricular repolarization at slow heart rates. A possible explanation is that failing hearts have increased intracellular Na concentration. At slow pacing rates, the reverse mode of NCX current may promote Cai transport and SR Ca loading with enhanced SR Ca release.23, 24 The increased Cai results in more IKAS activation. Apamin therefore has greater effects at very long PCL than at the intermediate PCL.
Apamin as a Selective Blocker of SK Currents
Apamin is a highly selective blocker of SK currents.14, 25, 26 Even among the SK channels, apamin only selectively blocks SK2 and SK3. It does not block SK1 at 100 nM,26 the concentration used in the present study. Due to its subtype selectivity, we have used the term IKAS rather than IK(Ca) to describe the K current that is blocked by apamin. The only other current blocked by apamin is the fetal L-type Ca2+ current.27 Blocking that inward current should not prolong the APD as observed in the present study. However, it might explain the APD shortening observed in some areas of normal ventricles after apamin administration. Therefore, we propose that the changes of APD and arrhythmia inducibility after apamin administration are due to the blockade of the currents conducted by SK channels.
Clinical Implications
K currents are vital for cardiac repolarization. Downregulation of the K currents in HF is thought to contribute significantly to reduced repolarization reserve that promotes afterdepolarizations, ventricular arrhythmias and sudden death.1, 28 Upregulation of IKAS during bradycardia might increase repolarization reserve and prevent afterdepolarizations. On the other hand, IKAS upregulation at tachycardia (short CL) might shorten APD and steepen APDR, promoting ventricular arrhythmia. Therefore, similar to other K channel blockers, our data suggests that IKAS blockers can be both proarrhythmic and antiarrhythmic depending on the clinical situations associated with arrhythmogenesis. IKAS blockade may prevent transition from ventricular tachycardia to VF and also prevent the spontaneous reinitiation of VF and electrical storm.9 On the other hand, if the arrhythmia is bradycardia dependent, such as those induced by early afterdepolarizations, IKAS blockers may promote triggered activity and ventricular arrhythmia.
Study Limitation
A limitation of the study is that the mapping was performed only on the epicardial surface. These findings may not be applicable to midmyocardial or endocardial layers of the cells. A second limitation is that, due to a lack of specific antibody against SK2 channels in rabbits, we were not able to obtain reliable data on SK protein levels in failing rabbit ventricles. We have attempted to use a commercial antibody (Abcam, ab83733) for Western blot analyses of the SK2 protein levels in HF and normal controls rabbit ventricles. Due to low signal to noise ratio, the results showed a statistically insignificant increase of SK2 protein in failing ventricles (see online supplement). However, reliable anti-SK2 antibody is available for failing human ventricles. Chang et al13 showed that the native hearts of transplant recipients have both increased IKAS and SK2 protein concentrations. We did not measure the SK current in this study with patch clamp techniques. However, two other studies from our laboratory9, 13 have documented the presence of apamin-sensitive K currents in failing ventricles using patch clamp techniques.
Supplementary Material
Acknowledgments
We thank Nicole Courtney, Lei Lin, Jessica Warfel and Janet Hutcheson for their assistance.
Funding Sources: This study was supported in part by NIH Grants P01HL78931, R01HL78932, R01HL71140, R21HL106554, the Kawata and Laubisch Endowments (J.N.W.), a Medtronic-Zipes Endowment (P.-S.C.) and the Indiana University Health-Indiana University School of Medicine Strategic Research Initiative.
Footnotes
Publisher's Disclaimer: This is a PDF file of an unedited manuscript that has been accepted for publication. As a service to our customers we are providing this early version of the manuscript. The manuscript will undergo copyediting, typesetting, and review of the resulting proof before it is published in its final citable form. Please note that during the production process errors may be discovered which could affect the content, and all legal disclaimers that apply to the journal pertain.
Conflict of Interest Disclosures: Medtronic Inc, St Jude Inc, Cryocath Inc and Cyberonics Inc donated research equipment used in this study. Dr Chen is a consultant to Cyberonics Inc.
References
- 1.Aiba T, Tomaselli GF. Electrical remodeling in the failing heart. Curr Opin Cardiol. 2010;25:29–36. doi: 10.1097/HCO.0b013e328333d3d6. [DOI] [PMC free article] [PubMed] [Google Scholar]
- 2.Watanabe T, Yamaki M, Yamauchi S, Minamihaba O, Miyashita T, Kubota I, Tomoike H. Regional prolongation of ari and altered restitution properties cause ventricular arrhythmia in heart failure. Am J Physiol Heart Circ Physiol. 2002;282:H212–H218. doi: 10.1152/ajpheart.2002.282.1.H212. [DOI] [PubMed] [Google Scholar]
- 3.Koller ML, Maier SK, Gelzer AR, Bauer WR, Meesmann M, Gilmour RF., Jr Altered dynamics of action potential restitution and alternans in humans with structural heart disease. Circulation. 2005;112:1542–1548. doi: 10.1161/CIRCULATIONAHA.104.502831. [DOI] [PubMed] [Google Scholar]
- 4.Nolasco JB, Dahlen RW. A graphic method for the study of alternation in cardiac action potentials. J Appl Physiol. 1968;25:191–196. doi: 10.1152/jappl.1968.25.2.191. [DOI] [PubMed] [Google Scholar]
- 5.Riccio ML, Koller ML, Gilmour RF., Jr Electrical restitution and spatiotemporal organization during ventricular fibrillation. Circ Res. 1999;84:955–963. doi: 10.1161/01.res.84.8.955. [DOI] [PubMed] [Google Scholar]
- 6.Koller ML, Riccio ML, Gilmour RF., Jr Dynamic restitution of action potential duration during electrical alternans and ventricular fibrillation. Am J Physiol. 1998;275:H1635–H1642. doi: 10.1152/ajpheart.1998.275.5.H1635. [DOI] [PubMed] [Google Scholar]
- 7.Garfinkel A, Kim YH, Voroshilovsky O, Qu Z, Kil JR, Lee MH, Karagueuzian HS, Weiss JN, Chen PS. Preventing ventricular fibrillation by flattening cardiac restitution. Proc Natl Acad Sci U.S.A. 2000;97:6061–6066. doi: 10.1073/pnas.090492697. [DOI] [PMC free article] [PubMed] [Google Scholar]
- 8.Weiss JN, Qu Z, Chen PS, Lin SF, Karagueuzian HS, Hayashi H, Garfinkel A, Karma A. The dynamics of cardiac fibrillation. Circulation. 2005;112:1232–1240. doi: 10.1161/CIRCULATIONAHA.104.529545. [DOI] [PubMed] [Google Scholar]
- 9.Chua SK, Chang PC, Maruyama M, Turker I, Shinohara T, Shen MJ, Chen Z, Shen C, Rubartvon der Lohe M, Lopshire JC, Ogawa M, Weiss JN, Lin SF, Ai T, Chen PS. Small-conductance calcium-activated potassium channel and recurrent ventricular fibrillation in failing rabbit ventricles. Circ Res. 2011;108:971–979. doi: 10.1161/CIRCRESAHA.110.238386. [DOI] [PMC free article] [PubMed] [Google Scholar]
- 10.Kohler M, Hirschberg B, Bond CT, Kinzie JM, Marrion NV, Maylie J, Adelman JP. Small-conductance, calcium-activated potassium channels from mammalian brain. Science. 1996;273:1709–1714. doi: 10.1126/science.273.5282.1709. [DOI] [PubMed] [Google Scholar]
- 11.Li N, Timofeyev V, Tuteja D, Xu D, Lu L, Zhang Q, Zhang Z, Singapuri A, Albert TR, Rajagopal AV, Bond CT, Periasamy M, Adelman J, Chiamvimonvat N. Ablation of a ca2+-activated k+ channel (sk2 channel) results in action potential prolongation in atrial myocytes and atrial fibrillation. J Physiol. 2009;587:1087–1100. doi: 10.1113/jphysiol.2008.167718. [DOI] [PMC free article] [PubMed] [Google Scholar]
- 12.Xu Y, Tuteja D, Zhang Z, Xu D, Zhang Y, Rodriguez J, Nie L, Tuxson HR, Young JN, Glatter KA, Vazquez AE, Yamoah EN, Chiamvimonvat N. Molecular identification and functional roles of a ca(2+)-activated k+ channel in human and mouse hearts. J Biol Chem. 2003;278:49085–49094. doi: 10.1074/jbc.M307508200. [DOI] [PubMed] [Google Scholar]
- 13.Chang PC, Turker I, Lopshire JC, Masroor S, Nguyen BL, Tao W, Rubart M, Chen PS, Chen Z, Ai T. Heterogeneous upregulation of apamin-sensitive potassium currents in failing human ventricles. JAHA. 2012 doi: 10.1161/JAHA.112.004713. [DOI] [PMC free article] [PubMed] [Google Scholar]
- 14.Adelman JP, Maylie J, Sah P. Small-conductance ca(2+)-activated k(+) channels: Form and function. Annu Rev Physiol. 2012;74:245–269. doi: 10.1146/annurev-physiol-020911-153336. [DOI] [PubMed] [Google Scholar]
- 15.National Research Council Committee. Guide for the care and use of laboratory animals. Washington (DC): National Academies Press (US); 2011. [Google Scholar]
- 16.Piacentino V, III, Weber CR, Chen X, Weisser-Thomas J, Margulies KB, Bers DM, Houser SR. Cellular basis of abnormal calcium transients of failing human ventricular myocytes. Circ Res. 2003;92:651–658. doi: 10.1161/01.RES.0000062469.83985.9B. [DOI] [PubMed] [Google Scholar]
- 17.Eisner DA, Trafford AW, Diaz ME, Overend CL, O'Neill SC. The control of ca release from the cardiac sarcoplasmic reticulum: Regulation versus autoregulation. Cardiovasc Res. 1998;38:589–604. doi: 10.1016/s0008-6363(98)00062-5. [DOI] [PubMed] [Google Scholar]
- 18.Li GR, Feng J, Yue L, Carrier M. Transmural heterogeneity of action potentials and ito1 in myocytes isolated from the human right ventricle. Am J Physiol. 1998;275:H369–H377. doi: 10.1152/ajpheart.1998.275.2.H369. [DOI] [PubMed] [Google Scholar]
- 19.Li GR, Lau CP, Ducharme A, Tardif JC, Nattel S. Transmural action potential and ionic current remodeling in ventricles of failing canine hearts. Am J Physiol Heart Circ Physiol. 2002;283:H1031–H1041. doi: 10.1152/ajpheart.00105.2002. [DOI] [PubMed] [Google Scholar]
- 20.Weiss JN, Karma A, Shiferaw Y, Chen PS, Garfinkel A, Qu Z. From pulsus to pulseless: The saga of cardiac alternans. Circ Res. 2006;98:1244–1253. doi: 10.1161/01.RES.0000224540.97431.f0. [DOI] [PubMed] [Google Scholar]
- 21.Harada M, Tsuji Y, Ishiguro YS, Takanari H, Okuno Y, Inden Y, Honjo H, Lee JK, Murohara T, Sakuma I, Kamiya K, Kodama I. Rate-dependent shortening of action potential duration increases ventricular vulnerability in failing rabbit heart. Am J Physiol Heart Circ Physiol. 2011;300:H565–H573. doi: 10.1152/ajpheart.00209.2010. [DOI] [PubMed] [Google Scholar]
- 22.Kim YH, Garfinkel A, Ikeda T, Wu TJ, Athill CA, Weiss JN, Karagueuzian HS, Chen PS. Spatiotemporal complexity of ventricular fibrillation revealed by tissue mass reduction in isolated swine right ventricle. Further evidence for the quasiperiodic route to chaos hypothesis. J Clin Invest. 1997;100:2486–2500. doi: 10.1172/JCI119791. [DOI] [PMC free article] [PubMed] [Google Scholar]
- 23.Hasenfuss G, Pieske B. Calcium cycling in congestive heart failure. J Mol Cell Cardiol. 2002;34:951–969. doi: 10.1006/jmcc.2002.2037. [DOI] [PubMed] [Google Scholar]
- 24.Schillinger W, Teucher N, Christians C, Kohlhaas M, Sossalla S, Van Nguyen P, Schmidt AG, Schunck O, Nebendahl K, Maier LS, Zeitz O, Hasenfuss G. High intracellular na+ preserves myocardial function at low heart rates in isolated myocardium from failing hearts. Eur J Heart Fail. 2006;8:673–680. doi: 10.1016/j.ejheart.2006.01.013. [DOI] [PubMed] [Google Scholar]
- 25.Castle NA, Haylett DG, Jenkinson DH. Toxins in the characterization of potassium channels. Trends Neurosci. 1989;12:59–65. doi: 10.1016/0166-2236(89)90137-9. [DOI] [PubMed] [Google Scholar]
- 26.Ishii TM, Maylie J, Adelman JP. Determinants of apamin and d-tubocurarine block in sk potassium channels. J Biol Chem. 1997;272:23195–23200. doi: 10.1074/jbc.272.37.23195. [DOI] [PubMed] [Google Scholar]
- 27.Bkaily G, Sculptoreanu A, Jacques D, Economos D, Menard D. Apamin, a highly potent fetal l-type ca2+ current blocker in single heart cells. Am J Physiol. 1992;262:H463–H471. doi: 10.1152/ajpheart.1992.262.2.H463. [DOI] [PubMed] [Google Scholar]
- 28.Weiss JN, Garfinkel A, Karagueuzian HS, Chen PS, Qu Z. Early afterdepolarizations and cardiac arrhythmias. Heart Rhythm. 2010;7:1891–1899. doi: 10.1016/j.hrthm.2010.09.017. [DOI] [PMC free article] [PubMed] [Google Scholar]
Associated Data
This section collects any data citations, data availability statements, or supplementary materials included in this article.


