

Abstract
Complete arginase I deficiency is the least severe urea cycle disorder, characterized by hyperargininemia and infrequent episodes of hyperammonemia. Patients suffer from neurological impairment with cortical and pyramidal tract deterioration, spasticity, loss of ambulation, and seizures, and is associated with intellectual disability. In mice, onset is heralded by weight loss beginning around day 15; gait instability follows progressing to inability to stand and development of tail tremor with seizure-like activity and death. Here we report that hyperargininemic mice treated neonatally with an adeno-associated virus expressing arginase and followed long-term lack any presentation consistent with brain dysfunction. Behavioral and histopathological evaluation demonstrated that treated mice are indistinguishable from littermates and that putative compounds associated with neurotoxicity are diminished. In addition, treatment results in near complete resolution of metabolic abnormalities early in life; however there is the development of some derangement later with decline in transgene expression. Ammonium challenging revealed that treated mice are affected by exogenous loading much greater than littermates. These results demonstrate that AAV-based therapy for hyperargininemia is effective and prevents development of neurological abnormalities and cognitive dysfunction in a mouse model of hyperargininemia; however nitrogen challenging reveals that these mice remain impaired in the handling of waste nitrogen.
Keywords: Hyperargininemia, AAV, Gene Therapy, Brain
Introduction
Arginase deficiency is a rare autosomal recessive metabolic disorder resulting from a loss of arginase I (ARG1), the final enzyme in the urea cycle1, which is the major pathway for the detoxification of ammonia in mammals. ARG1 is expressed most prevalently in hepatocytes, where in coordination with the other enzymes of the urea cycle, sequestration of nitrogen as urea occurs2. ARG1 hydrolyzes arginine into ornithine which can then re-enter the urea cycle; urea is then excreted as waste. Arginase deficiency is the least severe of the urea cycle disorders and results in hyperargininemia.
Neonatal and early infantile presentation of ARG1 deficiency with severe hyperammonemia does occur but is rare3–4; ARG1 deficiency usually presents later in life beginning in late infancy to the second year of life with microcephaly, spasticity, seizures, clonus, loss of ambulation, progressive mental impairment, growth retardation, periodic episodes of hyperammonemia and failure to thrive associated with hyperargininemia5. Patients often manifest spastic diplegia; while the exact mechanism is not completely defined, it appears that the origin of this abnormality is in upper motor neuron function impacting the motor cortex, the basal ganglia and the corticospinal tract. Affected nerves (here, the ones controlling the lower extremities) perpetually activate their corresponding muscles resulting in rigidity and hypertonicity that may be indistinguishable from cerebral palsy. While the exact cause is not known, the neurologic manifestations seen in arginase deficiency may arise from the accumulation of arginine or its metabolites, or an increase in guanidino compounds (putative neurotoxins) present from hyperargininemia. ARG1 deficient patients usually avoid the catastrophic hyperammonemic crises characteristic of the other urea cycle disorders and tend to survive much longer 2. Currently long-term therapy rests on provision of a low-protein diet and administration of sodium benzoate and sodium phenylbutyrate. While these onerous dietary and pharmaceutical interventions can partially alleviate ARG1 deficiency, there is no completely effective therapy available today.
Arg1-deficient mice were previously generated in our laboratory by replacing exon 4, the active site, of the Arg1 gene with the neomycin resistance gene6. No Arg1 RNA was found on Northern blot nor was any cross-reacting material detected. These mice completely lack hepatic arginase 1 activity. In contrast to the human disease in which patients can survive into adulthood, NIH-Swiss mice with Arg1 deficiency typically die between postnatal days 14 and 21 (average day 17) with severe hyperammonemia6. We have previously described the neurodevelopmental phenotype of the untreated Arg1−/− mice6. These mice demonstrate microcephaly, spasticity, loss of ambulation, seizure-like activity, and failure to thrive followed by death. Plasma ammonia levels of Arg1−/− mice in metabolic crisis are increased greater than 10-fold and their livers are abnormal with histopathologic features similar to those seen in human arginase-deficient patients who died with hyperammonemia later in life6.
We have developed a serotype rh10 adeno-associated virus (AAV)-mediated gene transfer approach where 3×10¹³ viral particles/kilogram are administered intravenously on the second day of life to correct the biochemical defect in a neonatal murine model of arginase I deficiency.7–8 The vector contains the ubiquitously-expressing chicken β-actin promoter/CMV enhancer; however it is unclear if functional protein can be produced in extrahepatic tissues. We have previously described using this vector for reporter gene studies9 and long-term factor VIII expression using a similar neonatal approach in the murine model of hemophilia A10. The treated Arg1-deficient mice have survival comparable to littermate controls and while being slightly smaller and demonstrating less visceral and subcutaneous fat than littermates otherwise appear grossly phenotypically indistinguishable. Enzymatic activity is sustained as demonstrated by an examination of plasma ammonia levels and amino acid profiles: plasma ammonia levels are ~2.5 times that of littermate controls and arginine levels are normal in these mice.
A detailed examination of the neurological system and cognitive abilities of these mice has not been previously performed. The goal of the studies described herein was to 1) systematically examine the brain and cognitive development of AAV-mArg1−/−-treated animals and determine if subtle findings suggestive of neurologic abnormalities may be present; 2) examine brain amino acids and other compounds (i.e. guanidino compounds) that have been hypothesized to be important in the cause of the neurological dysfunction in hyperargininemia and examine for level of correction with AAV-based gene therapy; and 3) assess the durability of the gene-based therapy of these animals to an exogenous ammonium challenge.
Results
Gene therapy results in normal brain development
While Arg1−/− mice are indistinguishable in phenotype from littermate controls at birth, the onset of central nervous system dysfunction is heralded initially by gait instability that leads to ataxia, lethargy, seizure-like activity and death over the subsequent 24 hours. With an effective therapy, the treated animals survive; however it is unclear if the anatomic and functional brain developments are normal, if there are histopathological abnormalities, or if there is overt or subtle behavioral dysfunction. To address these questions, treated Arg1−/− mice and littermate controls were observed and weighed for one year (n = 13 AAV-mArg1-treated Arg1−/− mice, n = 20 littermate controls) (Figure 1). At 4 months (n = 3), groups were euthanized and brains were examined grossly and histologically and computed axial tomography was performed of the brain and skull (Figure 2). And at 1 year of age (n = 8), brains were examined grossly and histologically (Figure 3). As the animals were followed over one year, they did demonstrate overall similar length, AAV-treated Arg1−/− mice remain lean while littermate controls develop obesity (Figure 1). The olfactory bulbs, cerebral cortex, basal ganglia, hippocampus, thalamus, mid brain, cerebellum, pons and medulla were examined with comparable regions from littermate control section. The brains of littermate control (A, B, C, D) and treated (E, F, G, H) Arg1−/− mice at 4 months (Figure 2) and littermate control (A, B, C) and treated mice (D, E, F) at 1 year (Figure 3) were found to be similar and there were no lesions in any of these main regions. CT imaging of the cranial vault at 4 months (Figure 2 I, J, K, L) demonstrated similar size and shape compared to littermate controls with no evidence of microcephaly. Average skull width (± SD) of heterozygote littermates was 10.0 ± 0.3 mm vs. 9.6 ± 0.5 mm for treated Arg1−/− mice (n=3 per group, p = 0.33). Average skull length (± SD) of heterozygote littermates was 21.7 ± 0.5 vs. 21.3 ± 0.4 mm for treated Arg1−/− mice (n = 3 per group, p = 0.26).
Figure 1. Growth of mice after AAV-mArg1 gene therapy.

Weight of mice over the first year of life comparing treated and with littermate controls. The graph shows the monthly weights of AAV-mArg1-injected Arg1−/− mice compared to littermate controls over the first year of life. The AAV-mArg1-injected Arg1−/− mice remain lean as littermate control mice develop obesity. Error bars represent standard deviation.
Figure 2. Brains and calvaria of mice after AAV-mArg1 gene therapy at 4 months demonstrate no differences.

Brains of littermate controls (A-D) and AAV-mArg1-treated Arg1−/− (E-H) mice at 4 months of age. The olfactory bulbs (A, E), cerebral cortex (B, F), basal ganglia, hippocampus, thalamus, mid brain (C, G), and cerebellum, pons and medulla (D, H) were examined and found to be similar and there were no lesions in any of these main regions. CT imaging of the cranial vault at 4 months (volume rendering in 3D [I, K] and single slice view [J, L]) from littermate controls (I, J) and AAV-mArg1-treated Arg1−/− (K, L) demonstrated similar size and shape compared to littermate controls with no evidence of microcephaly.
Figure 3. Brains and calvaria of mice after AAV-mArg1 gene therapy at 1 year demonstrate no differences.
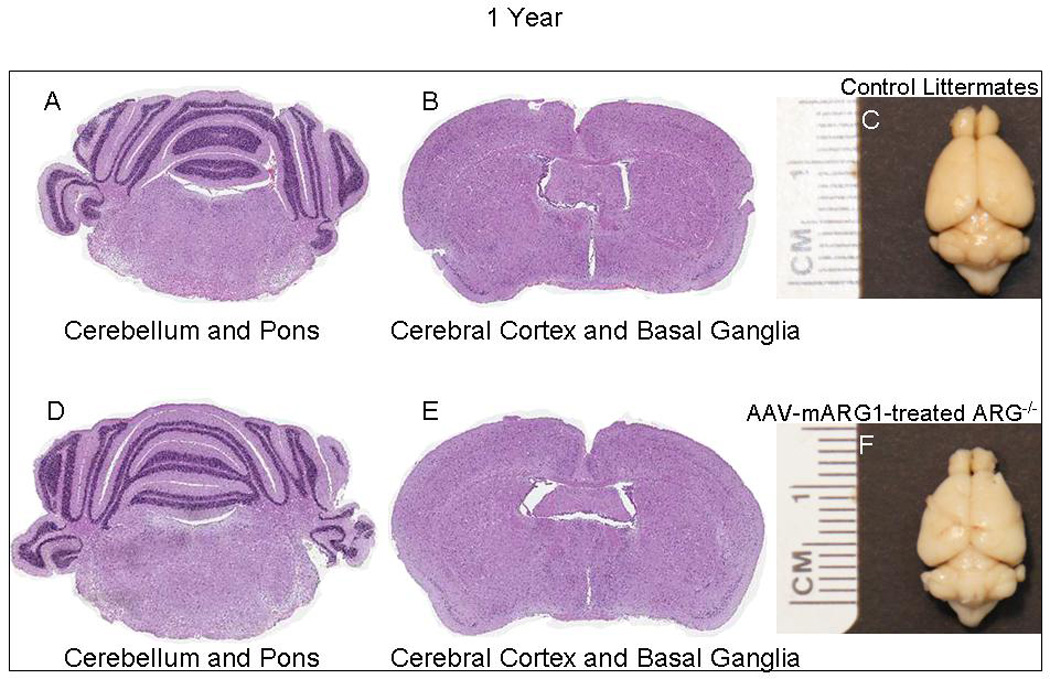
Brains of littermate controls (A-C) and AAV-mArg1-treated Arg1−/− (D-F) mice at 1 year of age. The cerebellum and pons (A, D) and cerebral cortex and basal ganglia (B, E) were examined and found to be similar and there were no lesions in any of these regions. Whole brain examination (C, F) demonstrated no gross pathology.
Neurobehavioral testing suggests treated animals are similar to littermate controls
To determine if treated Arg1−/− mice had any cognitive or motor deficits, AAV-mArg1-treated Arg1−/− mice (n = 8) and littermate controls (n = 8) at 11–12 weeks of age were subjected to a battery of behavioral tests by a blinded examiner to determine the central nervous system function of these animals. These studies included 1) the SmithKline Beecham Pharmaceuticals; Harwell, MRC Mouse Genome Centre and Mammalian Genetics Unit; Imperial College School of Medicine at St Mary's Royal London Hospital, St Bartholomew and the Royal London School of Medicine; Phenotype Assessment (SHIRPA) to score defects in gait, posture, motor control and coordination, changes in excitability and aggression, autonomic function such as lacrimation, piloerection, defecation and muscle tone; 2) Open Field (OF) to examine exploratory activity; 3) Elevated Plus Maze (EPM) to measure anxiety; 4) Morris Water Maze (MWM) to test spatial learning; 5) Hot Plate Pain Assay for pain detection; and 6) Rotarod to test cerebellar function. No significant differences were found by any of these tests comparing treated Arg1−/− mice with littermate controls (Table 1, and Figure 4, 5, 6, 7, 8) and mice did demonstrate evidence of learning with the MWM.
Table 1. SHIRPA primary screening score.
SHIRPA primary screening score in littermate controls (n = 8) and Arg1−/−-treated mice (n = 8) at 4 months of age. Values are given as mean ± SEM
| Controls | AAV-mARG1- treated ARG−/− |
P-value | |
|---|---|---|---|
| Viewing Jar | |||
| Body Position | 3.00 ± 0.00 | 3.00 ± 0.00 | 1.00 |
| Spontaneous Activity | 1.63 ± 0.18 | 1.88 ± 0.13 | 0.28 |
| Tremor | 0.00 ± 0.00 | 0.25 ± 0.16 | 0.17 |
| Urination | 0.00 ± 0.00 | 0.00 ± 0.00 | 1.00 |
| Defecation | 2.13 ± 0.48 | 1.25 ± 0.31 | 0.15 |
| Arena | |||
| Transfer Arousal | 3.13 ± 0.13 | 3.25 ± 0.16 | 0.55 |
| Locomotor Activity | 20.00 ± 2.20 | 19.00 ± 3.57 | 0.82 |
| Palpebral Closure | 0.00 ± 0.00 | 0.00 ± 0.00 | 1.00 |
| Piloerection | 0.00 ± 0.00 | 0.00 ± 0.00 | 1.00 |
| Startle Response | 0.75 ± 0.16 | 1.00 ± 0.00 | 0.17 |
| Gait | 0.00 ± 0.00 | 0.00 ± 0.00 | 1.00 |
| Pelvic Elevation | 2.00 ± 0.00 | 2.00 ± 0.00 | 1.00 |
| Tail Elevation | 1.00 ± 0.00 | 1.25 ± 0.16 | 0.17 |
| Touch Escape | 3.00 ± 0.00 | 2.88 ± 0.13 | 0.35 |
| Above Arena | |||
| Positional Passivity | 4.00 ± 0.00 | 4.00 ± 0.00 | 1.00 |
| Visual Placing | 3.00 ± 0.00 | 3.00 ± 0.00 | 1.00 |
| Reflex | |||
| Grip Strength | 3.00 ± 0.00 | 3.00 ± 0.00 | 1.00 |
| Body Tone | 1.00 ± 0.00 | 1.00 ± 0.00 | 1.00 |
| Toe Pinch | 3.00 ± 0.00 | 3.00 ± 0.00 | 1.00 |
| Wire Maneuver | 0.38 ± 0.38 | 0.00 ± 0.00 | 0.35 |
| Other | |||
| Righting Reflex | 0.00 ± 0.00 | 0.00 ± 0.00 | 1.00 |
| Contact Righting Reflex | 1.00 ± 0.00 | 1.00 ± 0.00 | 1.00 |
| Negative Geotaxis | 0.00 ± 0.00 | 0.50 ± 0.33 | 0.17 |
Unpaired t-test, significance is achieved at P < 0.05
Figure 4. Open field testing of littermate controls and Arg1−/− mice after AAV-mArg1 gene therapy demonstrate normal exploratory activity.

Distance traveled (A) and percent time spent (B) for littermate control (Arg1+/-) and AAV-mArg1-treated Arg1−/− mice (20 minutes). (Data presented as mean ± SEM).
Figure 5. Elevated plus maze testing of littermate controls and Arg1−/− mice after AAV-mArg1 gene therapy demonstrate no anxiety abnormalities.

Time spent leaving the center to enter the open arm or closed arm (A) or in the open (B) or closed arms (C) (5 minutes). (Data presented as mean ± SEM).
Figure 6. Morris water maze training demonstrates ability to learn in Arg1−/− mice after AAV-mArg1 gene therapy and littermate controls.

(A) Learning curve as indicated by the latency to locate a hidden platform (up to 60 seconds) during a 5 day training period. The average of four trials per day is presented. (B) Probe test 1 on day 3 (the platform is removed), showing the percentage of time spent in each pool quadrant (in 60 seconds); note additional time spent in target (T) area by AAV-treated Arg1−/− mice indicating learning; however with Probe test 2 on day 6 (C), time spent in the four quadrants is roughly equivalent between both types of mice. (T = Target, R = Right, O = Opposite, L = Left) (Data presented as mean ± SEM).
Figure 7. Hot plate testing demonstrates no hyperreactivity to thermal sensory stimuli in Arg1−/− mice after AAV-mArg1 gene therapy compared to and littermate controls.
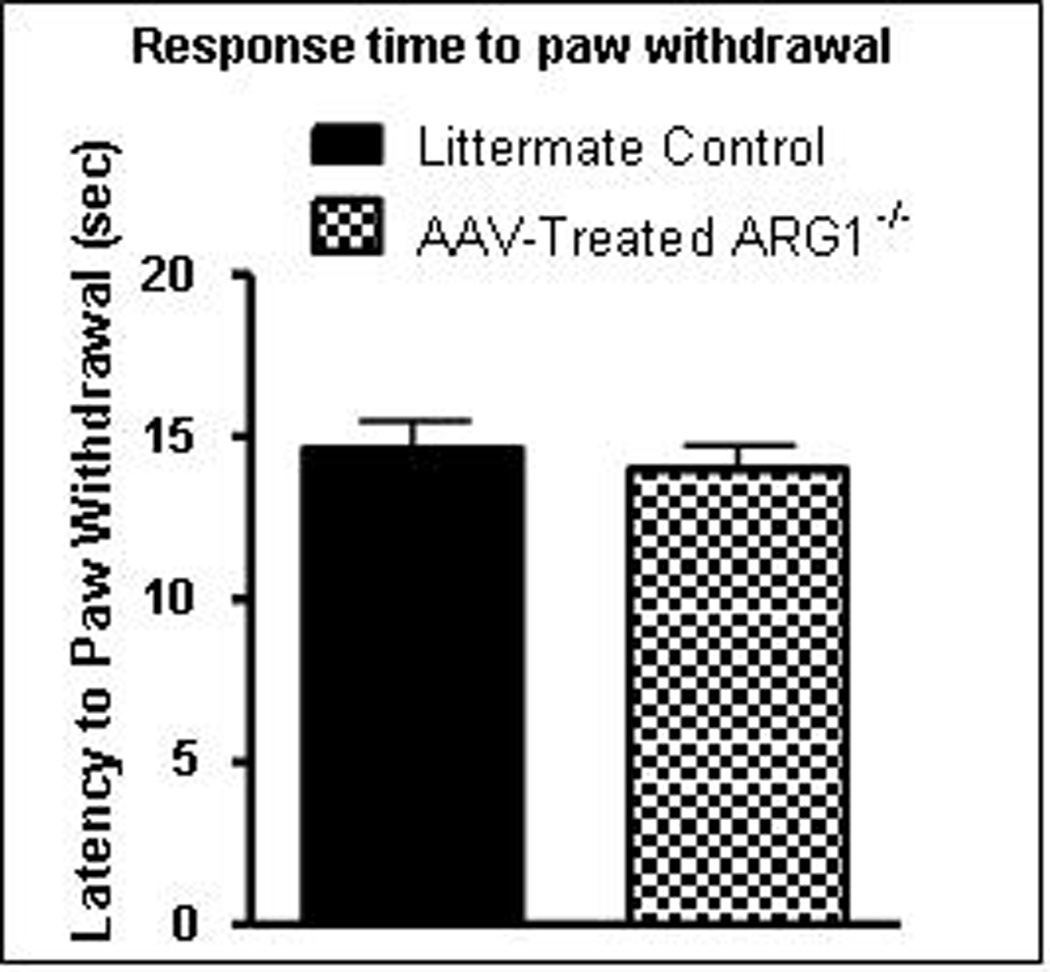
Latency to paw withdrawal from a plate at 52.5°C (up to 45 seconds) demonstrated no difference between treated mice and littermate controls. (Data presented as mean ± SEM).
Figure 8. Rotarod testing demonstrated no cerebellar dysfunction in Arg1−/− mice after AAV-mArg1 gene therapy.

Latency to fall was tested from the rotarod (up to 180 seconds) in the constant (A) and accelerating (B) speed tasks. (Data presented as mean ± SEM).
1) SHIRPA primary screen
Quantitative measures of SHIRPA primary screen are presented (Table 1). No differences were observed between littermate controls (n = 8 mice and treated Arg1−/− mice n = 8 mice).
2) The open field test (OFT)
OFT is a commonly used qualitative and quantitative measure of general locomotor activity and willingness to explore in mice. Time spent in the center and periphery of the field and total distance travelled in first twenty minutes of activity were examined. We found no significant differences (± SEM) from littermate controls and the treated-Arg1−/− mice on the distance traveled in the open field (35,291 ± 2,765 mm vs. 25,571 ± 2,768 mm, respectively [p = 0.89] Figure 4A). We also calculated the average velocity (± SEM) for each group and found no significant differences in the treated-Arg1−/− compared to littermate controls (22.12 ± 2.69 mm/sec vs. 29.80 ± 2.445 mm/sec [p = 0.81]). Finally, we calculated the amount of time mice spent in the central zone away from the wall of the open field, and once again found no significant differences of treated Arg1−/− compared to littermate controls (p = 0.80) (Figure 4B). Thus there were no deficits detected on a task requiring simple locomotion in an open field comparing the treated Arg1−/− mice with the littermate controls.
3) The elevated plus maze (EPM)
EPM tests the innate fear response (anxiety). The anxiety is induced by the height off of the ground of 100 cm and animals can choose to go to a safe place where they will not fall. The open-arm is considered anxiety-provoking and the closed arm is considered safe. The data does not add up to 100% due to the time animals spend in the center while the number of entries refers to leaving the center to the open arms or closed arms and further assesses anxiety level (Figure 5A). There was no statistically significant difference detected between the littermate controls and the AAV-treated Arg1−/− mice of time spent leaving the center to enter the open arm or closed arm (p = 0.85) (Figure 5A) or in the open (Figure 5B) (p = 0.85) or closed arms (Figure 5C) (p = 0.43).
4) The Morris water maze (MWM)
Mental retardation is an important comorbidity of hyperargininemia. To examine whether treated Arg1−/− mice have adversely affected spatial cognition, we trained treated mice and littermate controls on the hidden version of the Morris water maze. Over a training period of 5 days, time was measured from being placed in the chamber to finding the platform. In littermate controls and the AAV-treated Arg1−/− mice, training in the visible version of the Morris water maze revealed normal escape latencies (Figure 6A).
As escape latencies generally are a poor indicator of spatial learning,11 we tested the accuracy with which the platform location was learned by delivering a probe trial (during which the platform was removed from the pool) after completion of acquisition training. The entire procedure took six consecutive days. In brief, mice were trained to locate a hidden platform based on distalvisual cues to escape from the pool. Mice received four training trials per day (with different start points) for 5 consecutive days. In addition to training trials, only on day 3, before trials, the platform was removed and probe test 1 was performed to measure the animal’s long-term memory; the assessment was made as to the time spent looking for the platform after a random location of entry. While we do detect a trend for learning in the treated animals with the probe 1 test (if learning, more time is spent in target quadrant [Figure 6B, AAV-treated Arg1−/− target bar]), these animals may not be completely suitable for the MWM due to potential, previously described (however unknown to us) visual impairment in the NIH Swiss mouse strain [rd1 mutation at the Pde6b locus conferring retinal degeneration12]. On day 6, the platform was removed and a probe test 2 was performed. This time there was no preference for the target quadrant (T) in littermate controls or AAV-treated Arg1−/− mice (Figure 6C). However, we do know that the mice have some visual acuity by the results of the SHIRPA evaluation (where the contextual cues are in part visual).
5) The hot plate pain assay
Hot plate pain assay testing examines time to lifting and licking hind paw (supraspinal response) when animal steps on a surface at 52 °C. Between the treated Arg1−/− mice and littermate controls, there was no difference in pain perception (± SEM) as demonstrated by latency to paw withdrawal (14.00 ± 0.73 vs. 14.63 ± 0.87 seconds, respectively [p = 0.67] (Figure 7)).
6) The Rotarod test
Mice were tested by being placed on a rotating rod that starts at 5 revolutions per minute (rpm) and then accelerates to 20 rpm in 10 seconds and remains at that velocity for 180 seconds (constant velocity testing) with scoring based on latency to fall (Figure 8A). In a second test, the rod turns at 5 rpm and increases to 60 rpm over 60 seconds, remaining at that velocity for 2 minutes (accelerating velocity testing) (Figure 8B). There was no cerebellar-dependent deficit detected in either test (± SEM) between groups [constant velocity: littermate control 24.50 ± 14.57 seconds, treated Arg1−/− mice 33.25 ± 11.91 seconds [p = 0.75]); accelerating velocity: littermate control 17.50 ± 4.79 seconds, treated Arg1−/− mice 22.25 ± 7.53 seconds [p=0.48])].
Serum ammonia and brain amino acids are improved with AAV-mArg1 gene therapy
Untreated Arg1−/− mice die as juveniles before weaning. While they die with evidence of cerebral dysfunction, it has been previously unclear as to the extent of the biochemical derangement in their central nervous system and whether this can be mitigated with gene therapy. By analyzing intracellular metabolites and amino acids in brain tissue of untreated animals demonstrating signs of cerebral dysfunction at day 20 of life (n =5 per group), we detected diffuse alterations in the levels of amino acids and other compounds in brain tissue (Table 2A). Elevations are detected in alanine, the branched chain amino acids, proline, histidine, threonine, the aromatic amino acids, arginine, citrulline, ornithine, asparagine, and methionine, with a marked elevation in glutamine. Decreased levels of cystine, lysine, glutamic and aspartic acid, and homocarnosine are also detected; γ-aminobutyric acid (GABA) is not statistically different from littermate controls.
Table 2A. Brain Amino Acid Levels (nanomoles/mL per 100 mg tissue).
Brain amino acids levels in 3-week-old untreated Arg1−/−, AAV-mArg1-injected Arg1−/−, and littermate control mice. Values are given as mean ± SD (as nanomoles/mL per 100 mg of tissue). GB = γ-aminobutyric acid.
| Monoamino, Monocarboxylic | Branched Chain | Mercapto | Heterocyclic | ||||||
|---|---|---|---|---|---|---|---|---|---|
| 3 Weeks | Alanine | Glycine | Isoleucine | Leucine | Valine | Cystathionine | Cystine | Taurine | Proline |
| Control Littermates | 96.2 ± 19.3 | 122.2 ± 55.5 | 6.4 ± 2.0 | 13.6 ± 3.1 | 13.6 ± 3.0 | 6.8 ± 6.7 | 1.0 ± 0.7 | 1156.8 ± 77.8 | 14.8 ± 2.5 |
| Treated ARG1−/− | 105.2 ± 16.4 | 89.0 ± 18.3 | 6.8 ± 1.2 | 12.8 ± 1.9 | 14.0 ± 1.7 | 2.6 ± 0.8 | 0.4 ± 0.5 | 1183.2 ± 69.0 | 14.2 ± 1.9 |
| Untreated ARG1−/− | 276.8 ± 135.2 | 133.0 ± 18.7 | 11.6 ± 2.7 | 26.2 ± 7.7 | 23.6 ± 6.1 | 13.2 ± 4.6 | 0.0 ± 0.0 | 1088.2 ± 179.0 | 59.8 ± 18.1 |
| p-value Treated* | 0.50 | 0.29 | 0.73 | 0.67 | 0.82 | 0.25 | 0.23 | 0.63 | 0.71 |
| p-value Untreated* | 0.03 | 0.72 | 0.01 | 0.02 | 0.02 | 0.15 | 0.05 | 0.50 | 0.001 |
| Diamino, Monocarboxylic | Monoamino, Dicarboxylic | Hydroxy | Brain-Related | ||||||
|---|---|---|---|---|---|---|---|---|---|
| 3 Weeks | Histidine | Lysine | Glutamic acid | Aspartic acid | Serine | Threonine | Homocarnosine | Carnosine | GABA |
| Control Littermates | 9.4 ± 1.0 | 38.8 ± 7.4 | 860.8 ± 29.8 | 365.2 ± 30.9 | 84.6 ± 6.6 | 47.4 ± 13.4 | 2.4 ± 1.2 | 3.8 ± 1.3 | 329.6 ± 74.8 |
| Treated ARG1−/− | 11.8 ± 1.0 | 32.0 ± 4.7 | 918.6 ± 70.4 | 372.2 ± 18.4 | 89.0 ± 13.8 | 29.6 ± 3.5 | 2.4 ± 0.5 | 5.0 ± 1.1 | 289.6 ± 26.9 |
| Untreated ARG1−/− | 30.0 ± 10.5 | 18.2 ± 5.5 | 661.4 ± 84.9 | 221.8 ± 13.0 | 73.2 ± 9.2 | 62.2 ± 41.1 | 0.6 ± 0.5 | 7.2 ± 4.7 | 274.0 ± 23.8 |
| p-value Treated* | 0.01 | 0.16 | 0.17 | 0.71 | 0.58 | 0.03 | 1.00 | 0.20 | 0.34 |
| p-value Untreated* | 0.005 | 0.002 | 0.002 | 2.7E-05 | 0.08 | 0.51 | 0.02 | 0.20 | 0.19 |
| Aromatic | Urea Cycle Related | Carboxamide | Thioether | ||||||
|---|---|---|---|---|---|---|---|---|---|
| 3 Weeks | Phenylalanine | Tyrosine | Tryptophan | Arginine | Citrulline | Ornithine | Asparagine | Glutamine | Methionine |
| Control Littermates | 7.4 ± 1.0 | 8.4 ± 1.0 | 2.2 ± 0.4 | 25.2 ± 6.2 | 3.8 ± 1.6 | 1.2 ± 0.4 | 17.2 ± 1.6 | 433.4 ± 68.2 | 6.6 ± 1.5 |
| Treated ARG1−/− | 7.4 ± 0.5 | 6.6 ± 1.0 | 2.6 ± 0.5 | 13.6 ± 2.9 | 3.4 ± 0.8 | 2.4 ± 0.8 | 18.6 ± 1.7 | 581.0 ± 78.8 | 8.6 ± 1.4 |
| Untreated ARG1−/− | 21.4 ± 5.9 | 43.2 ± 12.5 | 9.6 ± 6.1 | 57.6 ± 10.9 | 10.2 ± 3.9 | 2.2 ± 0.4 | 23.4 ± 5.0 | 2697.0 ± 246.7 | 11.0 ± 3.3 |
| p-value Treated* | 1.00 | 0.04 | 0.24 | 0.01 | 0.67 | 0.03 | 0.27 | 0.02 | 0.08 |
| p-value Untreated* | 0.002 | 0.001 | 0.04 | 0.001 | 0.02 | 0.01 | 0.05 | 1.1E-07 | 0.04 |
Compared to Heterozygote
With AAV-mArg1 administration, three-week-old AAV-mArg1-treated Arg1−/− mice demonstrate resolution of nearly all of these metabolic abnormalities at this early time point (Table 2A). In fact brain arginine and citrulline are at levels below that of control animals, as are tyrosine and threonine while ornithine is twice that of littermate controls. Only the elevation in CNS glutamine suggests there is some underlying urea cycle dysfunction (34% above controls).
The level of Arg1 transgene expression declines with vector loss over time as was previously described7; but it does persists to at least one year of age (See Supplementary Figure 1). Over this time, development of CNS amino acid and related compound abnormalities occurs as detected by analysis of brain tissue at 1 year of life (Table 2B). Along with citrulline, ornithine is elevated with a marked increase in CNS glutamine. Elevations are also detected in methionine, as taurine, threonine, arginine and the aromatic amino acids all demonstrate decreased levels. In addition, homocarnosine (which is present in excitable tissues but whose function is unknown), was normal at 3 weeks, decreases while GABA is not statistically different from heterozygous controls.
Table 2B.
Brain amino acids levels in 1-year-old untreated Arg1−/−, AAV-mArg1-injected Arg1−/−, and littermate control mice. Values are given as mean ± SD (as nanomoles/mL per 100 mg of tissue). GB = γ-aminobutyric acid.
| Monoamino, Monocarboxylic | Branched Chain | Mercapto | Heterocyclic | ||||||
|---|---|---|---|---|---|---|---|---|---|
| 1 Year | Alanine | Glycine | Isoleucine | Leucine | Valine | Cystathionine | Cystine | Taurine | Proline |
| Control Littermates | 92.1 ± 13.0 | 88.7 ± 10.8 | 4.7 ± 0.6 | 10.3 ± 1.2 | 11.9 ± 1.2 | 1.9 ± 0.4 | 0.36 ± 0.05 | 915.1 ± 81.7 | 8.4 ± 1.4 |
| Treated ARG1−/− | 100.1 ± 11.2 | 86.1 ± 9.9 | 5.3 ± 1.0 | 12.1 ± 1.4 | 11.6 ± 1.1 | 2.3 ± 1.0 | 0.22 ± 0.4 | 437.1 ± 76.7 | 9.4 ± 1.0 |
| p-value | 0.38 | 0.73 | 0.26 | 0.10 | 0.69 | 0.50 | 0.08 | 2.7E-05 | 0.27 |
| Diamino, Monocarboxylic | Monoamino, Dicarboxylic | Hydroxy | Brain-Related | ||||||
|---|---|---|---|---|---|---|---|---|---|
| 1 Year | Histidine | Lysine | Glutamic acid | Aspartic acid | Serine | Threonine | Homocarnosine | Carnosine | GABA |
| Control Littermates | 9.6 ± 0.6 | 17.2 ± 1.4 | 1001.1 ± 80.8 | 368.5 ± 22.0 | 78.4 ± 12.9 | 32.4 ± 2.9 | 4.2 ± 1.0 | 14.5 ± 8.2 | 370.4 ± 62.7 |
| Treated ARG1−/− | 21.3 ± 4.4 | 17.4 ± 1.5 | 969.2 ± 96.3 | 319.7 ± 43.6 | 76.9 ± 11.7 | 13.3 ± 2.7 | 2.4 ± 0.9 | 12.6 ± 4.4 | 310.0 ± 45.9 |
| p-value | 0.0008 | 0.87 | 0.62 | 0.08 | 0.86 | 1.0E-05 | 0.03 | 0.69 | 0.16 |
| Aromatic | Urea Cycle Related | Carboxamide | Thioether | ||||||
|---|---|---|---|---|---|---|---|---|---|
| 1 Year | Phenylalanine | Tyrosine | Tryptophan | Arginine | Citrulline | Ornithine | Asparagine | Glutamine | Methionine |
| Control Littermates | 7.7 ± 0.6 | 9.8 ± 1.1 | 2.9 ± 0.4 | 16.7 ± 1.8 | 2.0 ± 0.3 | 0.48 ± 0.1 | 9.8 ± 0.4 | 424.3 ± 48.2 | 5.6 ± 0.5 |
| Treated ARG1−/− | 10.2 ± 1.3 | 12.8 ± 1.6 | 4.3 ± 1.2 | 13.5 ± 1.3 | 2.9 ± 0.6 | 1.5 ± 0.3 | 10.4 ± 0.8 | 1304.8 ± 104.3 | 6.7 ± 0.4 |
| p-value | 0.009 | 0.01 | 0.07 | 0.03 | 0.03 | 0.0003 | 0.20 | 3.3E-07 | 0.008 |
Serum ammonia was followed long-term in littermate control and treated Arg1−/− mice. Untreated Arg1−/− mice before death (n = 7) at about 3 weeks of life (range 19 to 23 days of life) have ammonia levels of 1829.6 ± 1073.4 µmol/L. Littermate controls (n = 11) and AAV-treated Arg1−/− (n = 4) mice have ammonia levels of 124.5 ± 65.7 and 101.6 ± 18.4 µmol/L, respectively. By 6 months of age, ammonia levels of littermate controls (n = 4) are 92.7 ± 23.4 µmol/L while AAV-treated Arg1−/− (n = 4) mice have ammonia levels of 236.3 µmol/L. By 1 year of life, ammonia levels of littermates is 90.5 ± 19.6 µmol/L and in AAV-treated Arg1−/− mice the ammonia level is 258.3 ± 15.1 µmol/L.
Serum arginine was also followed long-term in littermate control and treated Arg1−/− mice. Untreated Arg1−/− mice before death (n = 4) at about 3 weeks of life (range 19 to 23 days of life) have arginine levels of 1825.2 ± 52.5 µmol/L. Littermate controls (n = 5) and AAV-treated Arg1−/− (n = 4) mice have arginine levels of 198.6 ± 100.8 and 101.8 ± 24.3 µmol/L, respectively. By 6 months of age, arginine levels of littermate controls (n = 4) are 178.2 ± 35.2 µmol/L while AAV-treated Arg1−/− (n = 4) mice have arginine levels of 155.8 ± 9.8 µmol/L. By 1 year of life, arginine levels of littermates is 132.7 ± 40.6 µmol/L and in AAV-treated Arg1−/− mice the arginine level is 182.1 ± 60.9 µmol/L (p = 0.22).
Elevated guanidino compounds are improved with AAV-mArg1gene therapy
The serum guanidino compounds α-keto-δ-guanidinovaleric acid (α-K-δ-GVA), guanidinoacetic acid (GAA), α-N-acetylarginine (α-N-AA), β-GPA (β-guanidinopropionic acid) (data not shown), CTN (creatinine), CT (creatine), γ-GBA (γ-guanidinobutyric acid), HARG (homoarginine), and argininic acid (ArgA) were all markedly elevated in the untreated Arg1−/− mice (n=5 per group) (Table 3) while serum GSA (guanidinosuccinic acid), G (guanidine), and MG (methylguanidine) were low. However, while not completely normalized, all elevated GCs demonstrated substantial reductions and all depressed GCs demonstrated substantial increases with AAV-based treatment when examined at 4 months of age (n = 3 in treated group, n = 5 littermate controls).
Table 3.
Guanidino compound levels (µM) in serum of 4-month-old untreated Arg1−/−, AAV-mArg1-injected Arg1−/−, and littermate control mice. Values are given as mean ± SD. α-K-δ-GVA = α-keto-δ-guanidinovaleric acid, GSA = guanidinosuccinic acid, CT = creatine, GAA = guanidinoacetic acid, α-N-AA = α-N-acetylarginine, ArgA = argininic acid, CTN = creatinine, γ-GBA = γ-guanidinobutyric acid, Arg = Arginine, HARG = homoarginine, G = guanidine, and MG = methylguanidine.
| αKδ-GVA | GSA | CT | GAA | α-N-AA | ArgA | |
|---|---|---|---|---|---|---|
| Control Littermates | 0.43 ± 0.06 | 0.18 ± 0.05 | 151.67 ± 15.04 | 2.49 ± 0.57 | 1.79 ± 0.40 | 0.10 ± 0.02 |
| Treated Arg1−/− | 1.24 ± 0.92 | 0.06 ± 0.07 | 138.14 ± 74.05 | 1.96 ± 0.88 | 1.65 ± 0.71 | 0.37 ± 0.30 |
| Untreated Arg1−/− | 23.00 ± 4.68 | 0.03 ± 0.03 | 234.60 ± 65.64 | 14.82 ± 6.19 | 13.85 ± 3.94 | 20.46 ± 9.23 |
| p-value Treated* | 0.00000006 | 0.0007 | 0.20 | 0.58 | 0.40 | 0.00001 |
| p-value Untreated* | 0.000002 | 0.0005 | 0.02 | 0.002 | 0.0001 | 0.0009 |
| CTN | γ-GBA | Arg | HArg | G | MG | |
|---|---|---|---|---|---|---|
| Control Littermates | 13.10 ± 2.56 | 0.35 ± 0.08 | 223.0 ± 54.47 | 0.70 ± 0.32 | 3.43 ± 4.42 | 0.08 ± 0.02 |
| Treated Arg1−/− | 10.91 ± 5.33 | 0.44 ± 0.24 | 175.29 ± 69.15 | 1.11 ± 0.76 | 3.21 ± 1.18 | 0.04 ± 0.02 |
| Untreated Arg1−/− | 19.53 ± 10.03 | 0.99 ± 0.48 | 1948.60 ± 489.37 | 4.04 ± 2.20 | 0.36 ± 0.08 | 0.01 ± 0.00 |
| p-value Treated* | 0.95 | 0.003 | 0.50 | 0.04 | 0.80 | 0.02 |
| p-value Untreated* | 0.21 | 0.02 | 0.00003 | 0.009 | 0.21 | 0.0002 |
Compared to Heterozygote
Values are expressed as µM.
Effect of ammonium challenge on nitrogen metabolism reveals persistent urea cycle dysfunction
Amino acids and ammonia were measured in blood collected before and 20 minutes after challenge with 4 mmol/kg NH4Cl (Figure 9) in 8 to 10-month-old male AAV-treated Arg1−/− mice and male littermate controls (n = 5 per group); an additional ammonia level was also measured at 1 hour after injection. Baseline serum ammonia and some amino acids were different in treated Arg1−/− mice compared with littermate controls. In particular, concentrations (± SD) of serum ammonia (263.2 ± 65.3 µmol/L in treated Arg1−/− mice [n=5] versus 100.7 ± 45.3 µmol/L in littermate controls [n = 5], p = 0.01) and glutamine (1459.9 ± 302.5 µmol/L in treated Arg1−/− mice [n = 5] versus 519.7 ± 89.6 µmol/L in littermate controls [n = 5], p < 0.05) were higher in the treated Arg1−/− mice. In the littermate controls, the 4 mmol/kg NH4Cl challenge resulted in an increase in serum ammonia levels to 793.1 ± 269.5 µmol/L 20 minutes after administration; this declined to 231.4 ± 93.3 µmol/L 1 hour after administration. In the treated Arg1−/− mice, serum ammonia increased to 2591.4 ± 725.2 µmol/L (p=0.004) after 20 minutes; at one hour, the ammonia level was unchanged at 2591.4 ± 820.4 µmol/L (p=0.002).
Figure 9. Ammonia challenging of ARG1−/− mice after AAV-mArg1 gene therapy demonstrate reduced nitrogen clearance.

AAV-mArg1-treated Arg1−/− mice and littermate controls (n = 5 per group) were injected with 0.4 M ammonium chloride and serum ammonia was measured 20 and 60 minutes after administration. AAV-mArg1-treated Arg1−/− mice demonstrated substantially reduced ammonia clearance (p < 0.05 between groups at both 20 and 60 minutes). (Data are presented as mean ± SD).
Examining activity scores (± SD) fifteen minutes after injection, littermate controls demonstrated an average activity score of 7.0 ± 0.0 (perfect = 7, moribund = 0) while AAV-treated Arg1−/− mice demonstrated scores of 4.8 ± 1.5 (p = 0.01) (For scoring method see supplementary Table 1). At one hour after ammonium chloride administration, heterozygous littermate controls demonstrated an unchanged average activity score of 7.0 ± 0.0 while AAV-treated Arg1−/− mice demonstrated a score of 4.0 ± 2.0 (p = 0.01); two of these mice were hypothermic at one hour.
The most substantial changes in the serum amino acids noted from baseline to 20 minutes after injection were of citrulline and ornithine. Both groups demonstrated a decline in ornithine levels after ammonium chloride injection. AAV-treated Arg1−/− mice demonstrated baseline ornithine levels of only 58.3% of littermate controls pre-ammonium challenge (49.9 µm/l vs. 85.6 µmol/L, respectively). Serum ornithine in heterozygous controls declined 46.1% after ammonium chloride administration to 46.2 µmol/L, while ornithine declined only 34.6% in treated Arg1−/− mice to 32.7 µmol/L. Citrulline, however, followed a different relationship. Owing to the administration of ammonium with normal ornithine transcarbamoylase enzymatic activity, an increase in citrulline (± SD) occurred in heterozygous control mice after ammonium chloride administration from 73.5 ± 12.2 µmol/L to 97.7 ± 17.9 µmol/L (a 33% increase). However, in the treated Arg1−/− mice, on average citrulline declined after the administration of ammonium chloride from 127.6 ± 17.1 µmol/L to 125.5 ± 16.7 µmol/L (a 1.7% decrease) suggesting that the baseline deficiency in ornithine may be insufficient to produce enough citrulline to compensate for the increased nitrogen loading.
Discussion
While the primary function of arginase 1 in the liver is to catalyze the urea cycle, it is believed that the same reaction, in extrahepatic sites, may direct metabolites into other, quite different, pathways (Figure 10). In this setting, arginine and its hydrolytic products become substrates for the synthesis of a number of important neurotransmitters, secondary signaling molecules and DNA support molecules, including glutamate, γ-aminobutyric acid (GABA), proline, creatine, nitric oxide, citrulline, and polyamines2, 13–14. Deficiency of the enzyme may lead to abnormalities in these other pathways and that likely these abnormalities are the cause of the characteristic phenotype detected in these patients. The purpose of the present series of investigations was to examine in gene therapy-corrected animals if 1) there are metabolic or structural abnormalities of the brain in AAV-mArg1-treated Arg1−/− mice; 2) determine if genetic correction could lead to normal behavioral and cognitive development in treated animals; 3) examine the durability of the gene correction by analyzing the metabolites in the serum and brain of long-term treated animals; and 4) determine the treated animal’s responses to ammonium loading, all with an eye toward obtaining a clue as to the cause of the unique features of this urea cycle disorder in humans.
Figure 10. The arginine metabolic pathway.

The arginine metabolic pathway showing the relationship of arginine with the urea cycle and side reactions to amino acid biosynthesis, guanidino biosynthesis pathways, and the polyamine biosynthesis pathways. (ADC = arginine decarboxylase, AGMase = agmatinase, ODC = ornithine decarboxylase, OAT = ornithine aminotransferase, HG = hydrogenation, AS = argininosuccinate, AI = arginase I, AII = arginase II; AGAT = arginine:glycine amidinotransferase; Harg = homoarginine; GSA = guanidinosuccinic acid, GAA = guanidinoacetic acid, CT = creatine, CTN = creatinine, α-N-AA = α-N-acetylarginine, α-K-δ-GVA = α-K-δ-guanidinovaleric acid.
While human patients do demonstrate growth retardation, in these studies, calvarial size and brain development demonstrated no difference from littermate controls. Utilizing a sophisticated battery of tests to examine behavior comparing AAV-mArg1-treated Arg1−/− mice with age-matched littermate controls, there was no demonstrated difference in learning, pain detection, general activity, cerebellar function, exploratory activity, gait or posture, motor control and coordination, excitability and aggression, autonomic function (such as lacrimation, piloerection, defecation) and muscle tone. There was mildly elevated ammonia levels throughout the life of these animals and some alteration in amino acids did develop with time; however, sophisticated testing demonstrated that these did not appear to affect brain function. While complete restoration of circulating amino acids and metabolites did not occur, arginine levels demonstrated no difference from littermate controls at least 1 year after AAV injection; glutamine, however, remained substantially elevated (~3 times littermate controls at 1 year [data not shown]), demonstrating that transamination and transamidation remain necessary to keep ammonia levels (which remain mildly elevated) under control.
Administration of ammonium to treated Arg1−/− animals has provided a clue to the underlying remaining dysfunction of the urea cycle. It appears that the defect in the distal urea cycle that is partially alleviated by AAV-mArg1 administration results in insufficient ornithine to overcome the metabolic load of exogenously administered ammonia. This relative starvation of ornithine could lead to insufficient levels of citrulline such that ammonia accumulates or is not metabolized quickly enough to prevent serious neurological abnormalities. This appears to be an interesting aspect of metabolic partitioning in that distal metabolite starvation (i.e. ornithine) results in metabolite accumulation (i.e. ammonia) in the proximal urea cycle. These findings may have implications for the treatment of human arginase deficient patients.
The low number of hyperammonemic crises in these patients together with spasticity (i.e. spastic diplegia), only seen in human arginase I deficient patients and not in patients with other urea cycle disorders, suggests that candidates other than ammonia may be associated with the pathophysiology and symptomatology of hyperargininemia. This has led to the hypothesis that arginine itself, or its catabolites, are the proximate toxins15, metabolites which would be expected to be low in the relative arginine-deficiency state of other urea cycle disorders. Tissue levels of arginine and their derivatives (guanidino compounds, [GC]) are increased in human hyperargininemia15, 16 and in this mouse model, and it has been suggested that these guanidino compounds may be contributing to the unique central nervous system pathology detected in these patients (progressive dementia, epilepsy and spasticity, as well as cortical and pyramidal tract deterioration2). This includes increased plasma α-keto-δ-guanidinovaleric, N-acetylarginine, homoarginine, and argininic acid 15–17.
Supporting this hypothesis was data that demonstrated intravenous loading of arginine resulted in a pronounced increase in the formation of α-keto-δ-guanidinovaleric acid, argininic acid and α-N-acetylarginine in patients with arginase I deficiency while the corresponding increase in healthy children was slight18–19; α-K-δ-GVA, α-N-AA, and ArgA have been demonstrated as epileptogenic compounds in rabbits and rats and it is hypothesized that this occurs through inhibition of neuronal responses to GABA and glycine by the blockage of chloride channels, which has been demonstrated in culture20–22. As compared to arginine, α-K-δ-GVA, α-NAA, and ArgA were all previously found to be much more potent GABA receptor antagonists, with ArgA being the most potent 21.
In the studies performed herein, substantial improvement of guanidino compounds occurred in the group treated with AAV-based gene therapy. However, while the levels are improved, they are not corrected while CNS function in these animals is normal. A recent examination of human patients with arginase 1 deficiency has raised doubt as to whether GCs are the culprit leading to CNS dysfunction23. While the exact cause of the unique neurological features of human patients with hyperargininemia has not been determined, the finding of abnormal levels of GCs and normal CNS function in the treated animals in this study further raises question as to the effect of GCs in the CNS dysfunction of this disorder.
These studies demonstrate that the metabolic abnormalities present in hyperargininemia can be mitigated or improved in mice with AAV-based gene therapy beginning in the neonatal period and that long-term survival (of at least 1 year) is possible. Furthermore, these studies demonstrate that the unique neurologic features characteristic of this disorder can be prevented and result in normal brain development, cognition, and activity. These studies support further investigation of using AAV-based gene therapy for this urea cycle disorder.
Materials and Methods
Mouse Procedures
The targeted Arg1 allele contains a deletion in exon 4 of the Arg1 gene6 and were generated and backcrossed to achieve a homogeneous NIH-Swiss strain background, genotyped and housed in 12-hour light and 12-hour dark cycle and maintained in approved mouse housing areas. All mice were housed under specific pathogen-free conditions; food and water were provided ad libitum. All mice were kept according to the National Institutes of Health guidelines and all experimental procedures were conducted in accordance with guidelines for the care and use of research animals at our institution. Newborn pups on the second day of life were injected with 3.0×10¹³ gc/kg of AAVrh10 CBA-mArg1-WPRE diluted in pharmaceutical grade saline by the superficial facial vein. The injections were performed in a total volume of 50 µl. Males and females were equally represented throughout the behavioral studies. Because of sensitivity of female mice to ammonium challenge (also reported with ornithine transcarbamylase mice [personal communication Lily Wang PhD, University of Pennsylvania, January 11, 2012]), only male mice were used for ammonium challenge. Serum was frozen immediately and stored at −80°C until analysis. Mice were fed standard mouse chow (Labdiet/PMI Nutrition International, St. Louis, MO., [Picolab Rodent diet 20, Catalogue Number 5053]).
PCR genotyping
Genomic DNA was prepared from tail tip by standard methods. Anion-exchange column-purified genomic DNA was subjected to PCR for genotyping. Primer sets for wild type gene: KO reverse primer: Exon5 reverse 5’-ACGATGTCTTTGGCAGATATGC -3’ and Wt forward primer: mAI forward 5’-AACCAGCACCTCTAAGGTCTATGG-3’. Primer sets for KO: Wt/KO reverse primer: Exon5 reverse 5’-ACGATGTCTTTGGCAGATATGC -3’ and KO forward primer: Neo forward 5’-GCCCATTCGACCACCAAG-3’. Cycle parameters: Denaturation: 94°C for 30 sec, Annealing: 60°C for 30 sec, Elongation: 72°C for 3 min for 40 cycles using DNA polymerase (Catalog Number RR006A (Takara, Mountain View, CA).
Biochemical Analysis of Serum
Serum amino acid analysis was performed on a Biochrom 30 HPLC amino acid analyzer. In brief, 30–50 µl of serum was mixed with equal volumes of Biochrom Seraprep and Lithium dilution buffer. Protein was precipitated by centrifugation and 10 µl supernatant was injected to the analyzer. Physiological amino acid standard (Sigma-Aldridge) was used to calibrate and determine analyte concentration. Results analysis was performed using EZchrom Elite software.
Determination of guanidino compound levels was accomplished with a Biotronic LC 5001 (Biotronik, Maintal, Germany) amino acid analyzer adapted for determination of guanidino compounds (GCs)24–25. The GCs were separated over a cation exchange column using sodium citrate buffers and detected with the fluorescence ninhydrin method as previously reported in detail24. A Jasco Model FP-920 fluorescence detector (Jasco International, Tokyo, Japan) was used at 395 and 500 nm for excitation and emission, respectively. Detected compounds include creatine (CT), creatinine (CTN), α-keto-δ-guanidinovaleric acid (α-K-δ-GVA), guanidinoacetic acid (GAA), guanidinosuccinic acid (GSA), arginine (Arg), argininic acid (ArgA), homoarginine (Harg), α-N-acetylarginine (α-N-AA), β-guanidinopropionic acid (β-GPA), and γ-guanidinobutyric acid (γ-GBA). Urea was determined in serum/plasma using the method of Ceriotti 26.
Biochemical Analysis of Brain Tissue
Brain amino acid levels were measured in Arg1−/−, AAV-mArg1-injected Arg1−/−, and Arg1+/− mice injected and collected at 3 weeks and 1 year. For each sample, the tissue was weighed and homogenized in water to a concentration of 0.2 g/ml. The supernatant was then removed and sonicated, 1 ml was removed and 70 mg of sulfosalicylic acid was added. The samples were then centrifuged. Supernatants were removed and sent on dry ice to the laboratory of Stephen Goodman (University of Colorado Health Sciences Center, Denver, CO) for amino acid analysis on a Beckman System 6300 Amino Acid Analyzer utilizing a 3-Lithium buffer method, as described previously 27 and presented as nanomoles per milliliter per 100 mg starting tissue.
Ammonia Analysis of Serum
Ammonia was determined in serum samples, by reductive amination of 2-oxoglutarate and oxidation of NADPH, employing a commercial kit (Sigma-Aldrich, St. Louis, MO) using 20 µl of serum for each sample tested. Results are presented as mean ± SD.
Behavioral Analysis
Eight mice per genotype were evaluated for each behavioral test (except Rotarod where it was 4 mice per group). Mice were tagged with either an ear tag number. Experimenters were blinded to the genotype during testing and analysis. Behavioral tests were performed in the UCLA behavioral test core and analyzed with TopScan (Clever Sys, Inc.) automated system.
SHIRPA (or SmithKline Beecham Pharmaceuticals; Harwell, MRC Mouse Genome Centre and Mammalian Genetics Unit; Imperial College School of Medicine at St Mary's Royal London Hospital, St Bartholomew and the Royal London School of Medicine; Phenotype Assessment): Before testing any mouse, we used the SHIRPA as a quantitative and standardized method to provide phenotypic data about an individual animal's general health and performance28. This primary observational screen based on a modified Irwin profile29 was performed as described previously30. Behavioral and functional profile screen included quantitative scoring to detect defects in gait or posture, motor control and coordination, changes in excitability and aggression, autonomic function such as lacrimation, piloerection, defecation and muscle tone.
Open Field
Exploratory activity was measured in a square Plexiglas enclosure (27.5 cm × 27.5 cm) for 20 minutes. Movement within the open-field area was recorded by the computerized Topscan Package (Clever Sys Inc.) Measured parameters included distance traveled, distance traveled and time spent in peripheral and center zones of the box, average velocity, stereotypic behavior time, resting time. Zone analysis was performed to determine inner sector occupancy of mice; low scores in this measure can indicate high levels of anxiety. Results are presented as mean ± SEM.
Elevated Plus Maze
The elevated plus maze contained four arms (each arm 29 cm long and 8 cm wide), two of which were open, while the other two arms had walls on the sides (16.5 cm high). The maze was mounted 65 cm above the floor. For the behavioral session, mice were placed in the center part of the elevated plus maze and were allowed to explore the maze for 5 min. The behavior was recorded and analyzed using Topscan tracking system (Clever Sys Inc.). We used both the time spent exploring the open arms and closed arms. Animals were considered to be exploring the open arms when all four paws were on one of the open arms. This assay has good face, construct and predictive validity with respect to measuring anxiety31–32. Low scores in the measure “time spent in open arms” indicate high levels of anxiety. An unpaired t-test was used to statistically compare the time spent exploring the open arms across genotypes. Results are presented as mean ± SEM.
Morris Water Maze
The Morris water maze (MWM) is a test of spatial learning for rodents that relies on distal cues to navigate from start locations around the perimeter of an open swimming arena to locate a submerged escape platform. Spatial learning is assessed across repeated trials and reference memory is determined by preference for the platform area when the platform is absent33. Results are presented as mean ± SEM.
For the hidden version of the Morris water maze, we trained mice with four training trials per day for 5 consecutive days. The escape platform was hidden 1 cm under the water surface in a constant location of the pool. We released mice into the pool from one of seven starting locations. Training trials ended when the mouse was on the platform or 60 seconds had elapsed, whichever came first. Mice remained for 5 seconds on the platform before they were removed from the pool. We gave training trials in blocks of two spaced about 90 minutes apart. We assessed spatial learning with a probe trial (during which the platform was removed from the pool) on 3rd day and 6th day. We used two-way ANOVA with repeated measures followed by Bonferroni-Dunn posthoc tests. Tracking information was processed by the Topscan Package (Clever Sys Inc).
Hot Plate Pain Assay
The Hot Plate assay involved placing the subject on all four feet onto a hot aluminum surface (52.5°C) and recording the latency to lick or lift one of the hindpaws or jump with all 4 feet leaving the hotplate to the nearest 0.1 second34. The subjects were first habituated to the hot plate before it is turned on by individually placing each mouse on the plate for 30 seconds. The habituation is then repeated while the plate is still cold. After all the mice have been habituated, the hot plate was turned on and heated to a constant temperature of 52.5°C. Results are presented as mean ± SEM.
Subjects were not placed on the plate during the 15 minute heating period. Heating takes about 15 minutes and the temperature remained constant during the actual test period. Once the subject responded by lifting or licking a hindpaw, or by jumping, they were immediately removed from the hot plate. The cutoff time was the maximum time a subject is allowed to stay on the hotplate and is chosen to prevent burn injury. For hot plate testing at 52.5°C the cutoff time was 45 seconds.
Accelerating Rotarod
Motor coordination and ability of the mice to handle a complex motor task that involves balance, coordination and motor skill learning, we used an accelerating Rotarod (RotoRod 3375-5; TSE Systems, Hamburg, Germany). Each trial started either at a constant forward rotational speed of 5 rpm. For a constant velocity the rod rotates at 5 rpm and then accelerates to 20 rpm in 10 seconds and remains at 20 rpm for 180. For accelerating, speed begins at 5 rpm and increases to 60 rpm over 60 seconds, remaining at that velocity for 2 minutes. Trials were completed after experimental subjects fell off the rod or 300s at a maximum speed of 60 rpm had elapsed, whichever came first. One received one trial on constant speed and 4 hours later received another trial on accelerating speed. Primary measure of interest was latency to fall. Results are presented as mean ± SEM.
Histology
Mice were euthanized by inhalation of isoflurane. For light microscopy, brains were carefully dissected out of the skull and immersion-fixed in 4% formalin for 48 hours followed by immersion in 70% alcohol solution. The brain was then coronally sectioned into four parts after routine processing and embedding in a single paraffin block using standard techniques. 4-μm sections of the block were routinely cut, stained with hematoxylin-eosin and analyzed using an Olympus BX40 microscope. Microscope slides were digitized with a ScanScope scanner and viewed with AperioImageScope software V11.1.2.752 (both from Aperio, Vista, CA).
Immunohistochemistry for Arginase Expression
Livers were removed from euthanized animals and placed in 4% PFA for 18–24 hours. After rinsing with tap water for 15 minutes tissues were placed in 70% ethanol followed by routine processing and embedding in paraffin. Tissues on slides were deparaffinized and rehydrated with ethanol and xylene by routine procedures. Slides were removed from tap water and placed in a microwaveable vessel filled with sodium citrate buffer (10mM sodium citrate, 0.05% Tween 20, pH 6.0) for antigen retrieval. Tissues were then permeabilized with 1x TBS + 0.2% Triton X-100 for 5–10 minutes followed by 1x TBS + 0.025% Triton X-100 for 5 minutes. Tissues were blocked with protein blocker + 0.1% Tween 20 for 20 minutes. Primary antibody was applied to the sections: Rabbit arginase I antibody (Santa Cruz Biotechnology Inc., Santa Cruz, CA) diluted in protein blocker plus 0.1% Tween 20 at 1:50 ratio and incubated overnight at 4°C. After rinsing twice for 5 minutes with 1XTBS 0.025% Triton the slides were incubated in 0.3% H2O2 in TBS for 15 minutes followed by application of the secondary antibody (Goat anti-rabbit IgG-HRP (Santa Cruz Biotechnology Inc.) [1:100 in protein blocker + 0.1% Tween 20]) and incubated for 1 hour at room temperature. After rinsing three times with 1XTBS, slides were developed with ImmPACT DAB kit (Vector, Burlingame, CA) for 3 minutes at room temperature. Slides were counterstained with hematoxylin and coverslipped.
Imaging Protocol
All mice were imaged in a multimodality chamber designed to allow maintaining the mice on isoflurane anesthesia at 1–2% during imaging and provide heating to maintain the mice’s body temperature35. The chamber also enables reproducible positioning to less than 1 mm, thus minimizing any attenuation variability due to animal positioning. Mice were imaged in a MicroCAT II small animal CT system (Siemens Preclinical Solutions, Knoxville, TN, USA). Exposure settings were 70 kVp, 500 mAs, 500 ms exposure time and 360° rotation in 1° steps with 2.0 mm aluminum filtration. Images were reconstructed using a modified Feldkamp process to a cubic voxel size of 0.20 mm. Results are presented as mean ± SD.
Ammonium Challenge
To simulate a nitrogen challenge, mice (control and virus-treated) were injected with a 0.4 M solution of NH4Cl intraperitoneally. All ammonium challenges were performed at the same time of day, between 1400 hours and 1500 hours, to minimize the effect of food consumption on plasma amino acids. At 15 minutes after injection, the mice were evaluated behaviorally by scoring from two blinded observers using the scale outlined developed by Ye et al 36 (See supplementary Table 1). Blood was collected from the retro-orbital plexus prior to beginning the studies, 20 minutes after injection, and at 1 hour after the injection when they were euthanized. The serum was collected and immediately frozen until analyzed for ammonium and amino acids. Results are presented as mean ± SD.
Statistical Analysis
For analysis of behavioral data, GraphPad Prism 5 (GraphPad Software, La Jolla, CA) was used. For SHIRPA, open field, hot plate, and elevated plus maze analyses, unpaired t test was used. For the Morris Water maze, two-way repeated measures ANOVA was used followed by Bonferroni-Dunn posthoc tests. Unpaired t test was used to analyze the calvarial size and metabolite analyses.
Supplementary Material
Acknowledgements
The authors thank Waldemar Ladno for assistance with CT imaging of mice and Daniela Markovic for assistance with the statistical evaluation, and both the Semel Institute for Neuroscience and the Intellectual and Developmental Disabilities Research Center at UCLA for their support. The authors declare no financial or other conflict of interest. This work was supported by grants from the National Institutes of Health (5K08HD057555-05 and 1R01NS071076-02A1).
Footnotes
Conflict of Interest
The authors declare no competing financial interests in relation to the work described in this manuscript.
Supplementary information is available at Gene Therapy's website.
References
- 1.Brusilow SW, Horwich A. The metabolic and Molecular Bases of Inherited Disease. In: Scriver CR, Beaudet AL, Sly WS, Valle D, editors. The metabolic and Molecular Bases of Inherited Disease. 8th edn. New York: McGraw-Hill; 2001. pp. 1909–1963. [Google Scholar]
- 2.Iyer R, Jenkinson CP, Vockley JG, Kern RM, Grody WW, Cederbaum S. The human arginases and arginase deficiency. J Inherit Metab Dis. 1998;21(Suppl 1):86–100. doi: 10.1023/a:1005313809037. [DOI] [PubMed] [Google Scholar]
- 3.Jain-Ghai S, Nagamani SC, Blaser S, Siriwardena K, Feigenbaum A. Arginase I deficiency: severe infantile presentation with hyperammonemia: more common than reported? Mol Genet Metab. 2011;104(1–2):107–111. doi: 10.1016/j.ymgme.2011.06.025. [DOI] [PMC free article] [PubMed] [Google Scholar]
- 4.Picker JD, Puga AC, Levy HL, Marsden D, Shih VE, Degirolami U, et al. Arginase deficiency with lethal neonatal expression: evidence for the glutamine hypothesis of cerebral edema. J Pediatr. 2003;142(3):349–352. doi: 10.1067/mpd.2003.97. [DOI] [PubMed] [Google Scholar]
- 5.Prasad AN, Breen JC, Ampola MG, Rosman NP. Argininemia: a treatable genetic cause of progressive spastic diplegia simulating cerebral palsy: case reports and literature review. J Child Neurol. 1997;12(5):301–309. doi: 10.1177/088307389701200502. [DOI] [PubMed] [Google Scholar]
- 6.Iyer RK, Yoo PK, Kern RM, Rozengurt N, Tsoa R, O'Brien WE, et al. Mouse model for human arginase deficiency. Mol Cell Biol. 2002;22(13):4491–4498. doi: 10.1128/MCB.22.13.4491-4498.2002. [DOI] [PMC free article] [PubMed] [Google Scholar]
- 7.Lee EK, Hu C, Bhargava R, Rozengurt N, Stout D, Grody WW, et al. Long-term Survival of the Juvenile Lethal Arginase Deficient Mouse with AAV Gene Therapy. Molecular Therapy. 2012 doi: 10.1038/mt.2012.129. (in press) [DOI] [PMC free article] [PubMed] [Google Scholar]
- 8.Lee EK, Hu C, Bhargava R, Rozengurt N, Stout D, Grody WW, et al. Long-term Survival of the Juvenile Lethal Arginase-deficient Mouse With AAV Gene Therapy. Mol Ther. 2012 doi: 10.1038/mt.2012.129. [DOI] [PMC free article] [PubMed] [Google Scholar]
- 9.Hu C, Busuttil RW, Lipshutz GS. RH10 provides superior transgene expression in mice when compared with natural AAV serotypes for neonatal gene therapy. J Gene Med. 2010;12(9):766–778. doi: 10.1002/jgm.1496. [DOI] [PMC free article] [PubMed] [Google Scholar]
- 10.Hu C, Lipshutz GS. AAV-based neonatal gene therapy for hemophilia A: long-term correction and avoidance of immune responses in mice. Gene Ther. 2012 doi: 10.1038/gt.2011.200. [DOI] [PMC free article] [PubMed] [Google Scholar]
- 11.Wolfer DP, Stagljar-Bozicevic M, Errington ML, Lipp HP. Spatial Memory and Learning in Transgenic Mice: Fact or Artifact? News Physiol Sci. 1998;13:118–123. doi: 10.1152/physiologyonline.1998.13.3.118. [DOI] [PubMed] [Google Scholar]
- 12.Clapcote SJ, Lazar NL, Bechard AR, Wood GA, Roder JC. NIH Swiss and Black Swiss mice have retinal degeneration and performance deficits in cognitive tests. Comp Med. 2005;55(4):310–316. [PubMed] [Google Scholar]
- 13.Jenkinson CP, Grody WW, Cederbaum SD. Comparative properties of arginases. Comp Biochem Physiol B Biochem Mol Biol. 1996;114(1):107–132. doi: 10.1016/0305-0491(95)02138-8. [DOI] [PubMed] [Google Scholar]
- 14.Singh R, Pervin S, Karimi A, Cederbaum S, Chaudhuri G. Arginase activity in human breast cancer cell lines: N(omega)-hydroxy-L-arginine selectively inhibits cell proliferation and induces apoptosis in MDA-MB-468 cells. Cancer Res. 2000;60(12):3305–3312. [PubMed] [Google Scholar]
- 15.Marescau B, Qureshi IA, De Deyn P, Letarte J, Ryba R, Lowenthal A. Guanidino compounds in plasma, urine and cerebrospinal fluid of hyperargininemic patients during therapy. Clin Chim Acta. 1985;146(1):21–27. doi: 10.1016/0009-8981(85)90120-2. [DOI] [PubMed] [Google Scholar]
- 16.Marescau B, De Deyn PP, Lowenthal A, Qureshi IA, Antonozzi I, Bachmann C, et al. Guanidino compound analysis as a complementary diagnostic parameter for hyperargininemia: follow-up of guanidino compound levels during therapy. Pediatr Res. 1990;27(3):297–303. doi: 10.1203/00006450-199003000-00020. [DOI] [PubMed] [Google Scholar]
- 17.Mizutani N, Hayakawa C, Ohya Y, Watanabe K, Watanabe Y, Mori A. Guanidino compounds in hyperargininemia. Tohoku J Exp Med. 1987;153(3):197–205. doi: 10.1620/tjem.153.197. [DOI] [PubMed] [Google Scholar]
- 18.Terheggen HG, Lavinha F, Colombo JP, Van Sande M, Lowenthal A. Familial hyperargininemia. J Genet Hum. 1972;20(1):69–84. [PubMed] [Google Scholar]
- 19.Wiechert P, Mortelmans J, Lavinha F, Clara R, Terheggen HG, Lowenthal A. Excretion of guanidino-derivates in urine of hyperargininemic patients. J Genet Hum. 1976;24(1):61–72. [PubMed] [Google Scholar]
- 20.De Deyn PP, Marescau B, Macdonald RL. Effects of alpha-keto-delta-guanidinovaleric acid on inhibitory amino acid responses on mouse neurons in cell culture. Brain Res. 1988;449(1–2):54–60. doi: 10.1016/0006-8993(88)91023-2. [DOI] [PubMed] [Google Scholar]
- 21.De Deyn PP, Marescau B, Macdonald RL. Guanidino compounds that are increased in hyperargininemia inhibit GABA and glycine responses on mouse neurons in cell culture. Epilepsy Res. 1991;8(2):134–141. doi: 10.1016/0920-1211(91)90081-p. [DOI] [PubMed] [Google Scholar]
- 22.Balz D, de Souza Wyse AT, Morsch VM, da Silva AC, Vieira VL, Morsch AL, et al. In vitro effects of L-arginine and guanidino compounds on NTPDase1 and 5'-nucleotidase activities from rat brain synaptosomes. Int J Dev Neurosci. 2003;21(2):75–82. doi: 10.1016/s0736-5748(02)00138-7. [DOI] [PubMed] [Google Scholar]
- 23.Deignan JL, De Deyn PP, Cederbaum SD, Fuchshuber A, Roth B, Gsell W, et al. Guanidino compound levels in blood, cerebrospinal fluid, and post-mortem brain material of patients with argininemia. Mol Genet Metab. 2010;100(Suppl 1):S31–S36. doi: 10.1016/j.ymgme.2010.01.012. [DOI] [PubMed] [Google Scholar]
- 24.Marescau B, De Deyn PP, Qureshi IA, De Broe ME, Antonozzi I, Cederbaum SD, et al. The pathobiochemistry of uremia and hyperargininemia further demonstrates a metabolic relationship between urea and guanidinosuccinic acid. Metabolism. 1992;41(9):1021–1024. doi: 10.1016/0026-0495(92)90131-s. [DOI] [PubMed] [Google Scholar]
- 25.Marescau B, Nagels G, Possemiers I, De Broe ME, Becaus I, Billiouw JM, et al. Guanidino compounds in serum and urine of nondialyzed patients with chronic renal insufficiency. Metabolism. 1997;46(9):1024–1031. doi: 10.1016/s0026-0495(97)90273-0. [DOI] [PubMed] [Google Scholar]
- 26.Ceriotti G. Ultramicrodetermination of plasma urea by reaction with diacetylmonoxime--antipyrine without deproteinization. Clin Chem. 1971;17(5):400–402. [PubMed] [Google Scholar]
- 27.Wang T, Lawler AM, Steel G, Sipila I, Milam AH, Valle D. Mice lacking ornithine-delta-aminotransferase have paradoxical neonatal hypoornithinaemia and retinal degeneration. Nat Genet. 1995;11(2):185–190. doi: 10.1038/ng1095-185. [DOI] [PubMed] [Google Scholar]
- 28.Rogers DC, Fisher EM, Brown SD, Peters J, Hunter AJ, Martin JE. Behavioral and functional analysis of mouse phenotype: SHIRPA, a proposed protocol for comprehensive phenotype assessment. Mamm Genome. 1997;8(10):711–713. doi: 10.1007/s003359900551. [DOI] [PubMed] [Google Scholar]
- 29.Irwin S. Comprehensive observational assessment: Ia. A systematic, quantitative procedure for assessing the behavioral and physiologic state of the mouse. Psychopharmacologia. 1968;13(3):222–257. doi: 10.1007/BF00401402. [DOI] [PubMed] [Google Scholar]
- 30.Rafael JA, Nitta Y, Peters J, Davies KE. Testing of SHIRPA, a mouse phenotypic assessment protocol, on Dmd(mdx) and Dmd(mdx3cv) dystrophin-deficient mice. Mamm Genome. 2000;11(9):725–728. doi: 10.1007/s003350010149. [DOI] [PubMed] [Google Scholar]
- 31.Hogg S. A review of the validity and variability of the elevated plus-maze as an animal model of anxiety. Pharmacol Biochem Behav. 1996;54(1):21–30. doi: 10.1016/0091-3057(95)02126-4. [DOI] [PubMed] [Google Scholar]
- 32.Walf AA, Frye CA. The use of the elevated plus maze as an assay of anxiety-related behavior in rodents. Nat Protoc. 2007;2(2):322–328. doi: 10.1038/nprot.2007.44. [DOI] [PMC free article] [PubMed] [Google Scholar]
- 33.Vorhees CV, Williams MT. Morris water maze: procedures for assessing spatial and related forms of learning and memory. Nat Protoc. 2006;1(2):848–858. doi: 10.1038/nprot.2006.116. [DOI] [PMC free article] [PubMed] [Google Scholar]
- 34.Bryant CD, Eitan S, Sinchak K, Fanselow MS, Evans CJ. NMDA receptor antagonism disrupts the development of morphine analgesic tolerance in male, but not female C57BL/6J mice. Am J Physiol Regul Integr Comp Physiol. 2006;291(2):R315–R326. doi: 10.1152/ajpregu.00831.2005. [DOI] [PubMed] [Google Scholar]
- 35.Stout DB, Chatziioannou AF, Lawson TP, Silverman RW, Gambhir SS, Phelps ME. Small animal imaging center design: the facility at the UCLA Crump Institute for Molecular Imaging. Mol Imaging Biol. 2005;7(6):393–402. doi: 10.1007/s11307-005-0015-2. [DOI] [PMC free article] [PubMed] [Google Scholar]
- 36.Ye X, Robinson MB, Pabin C, Quinn T, Jawad A, Wilson JM, et al. Adenovirus-mediated in vivo gene transfer rapidly protects ornithine transcarbamylase-deficient mice from an ammonium challenge. Pediatr Res. 1997;41(4 Pt 1):527–534. doi: 10.1203/00006450-199704000-00012. [DOI] [PubMed] [Google Scholar]
Associated Data
This section collects any data citations, data availability statements, or supplementary materials included in this article.