Abstract
Membrane curvature of a biological cell is actively involved in various fundamental cell biological functions. It has been discovered that membrane curvature and binding of peripheral membrane proteins follow a symbiotic relationship. The exact mechanism behind this interplay of protein binding and membrane curvature has not yet been properly understood. To improve understanding of the mechanism, we study curvature sorting of proteins in a model system consisting of a tether pulled from a giant unilamellar vesicle using mechanical-thermodynamic models. The concentration of proteins bound to the membrane changes significantly due to curvature. This has also been observed in experiments by other researchers. We also find that there is a phase transition based on protein concentration and we discuss the coexistence of phases and stability of solutions. Furthermore, when sorting is favorable, the increase in protein concentration stabilizes the tether in the sense that less pulling force is required to maintain the tether. A similar mechanism may be in place, when motor proteins pull tethers from donor membranes.
I. INTRODUCTION
Membrane curvature is no longer considered a passive geometric feature of a biological cell membrane. It plays an active role in the fundamental cell biological processes by controlling the spatial organization [1–3]. Proteins play an equally important role in these activities. One of the key aspects for many of these cellular functions is the membrane curvature sensing and generation (MC-S&G) through the binding of peripheral membrane proteins [1].
The mechanisms of MC-S&G have been classified into four main categories based on their distinct qualitative features. They are briefly mentioned below. More details can be found in the literature (e.g., Refs. [1,4]). Using the scaffolding mechanism, proteins with intrinsic curvature locally concentrate to induce curvature within the membrane [3]. Depending on the type of proteins involved, this mechanism leads to cylindrical or spherical curvature [3,5–7]. A second mechanism is hydrophobic insertion. In this mechanism, the proteins involved insert their hydrophobic domains into the membrane bilayer (wedging) to generate curvature [8]. The inserting domains are either helical [9–11] or nonhelical [12–14]. Certain proteins individually can not bend or sense membranes significantly. However, due to a cooperative effect these proteins oligomerize into a latticelike coats. Using this polymerization mechanism proteins can amplify MC-S&G [6,15–19]. It has also been observed that many proteins involved in MC-S&G lack intrinsic curvature (hence no scaffolding), hydrophobic inserting domains, or the tendency to cooperatively aggregate (i.e., oligomerize). Such proteins may induce curvature via local crowding [4,20,21].
Researchers have identified and classified proteins that are involved in MC-S&G based on their structures. The first family of proteins contain a BAR (Bin/Amphiphysin/RVs) domain. BAR domains are crescent-shaped α-helical bundles. They bind to a membrane mainly via hydrophobic insertion mechanism or electrostatic interaction, and use the scaffolding mechanism while interacting with membrane curvature. The second family of proteins, the dynamin family of proteins [22], also interacts with membrane curvature using the scaffolding mechanism, however, it does not contain a BAR domain. The third class involves proteins that do not use the scaffolding mechanism based on their structure. They use the inserting mechanism to generate curvature. Typically, these proteins have an intrinsically unfolded components. Upon binding to the membrane they undergo folding transition to form amphipathic α-helices.
Most theoretical studies on protein binding are concerned with adsorption on a flat lipid bilayer. Chatelier and Minton [23] modeled proteins as regular convex hard particles and predicted that the cooperativity among proteins (tendency of self-association) influences the protein adsorption isotherm and it deviates from the Langmuir isotherm (for adsorption of ideal gases). Later Minton [24,25] extended the study by incorporating different protein conformations, effects of area exclusion, and clustering via a kinetic model. Zhdanov and Kasemo [26], using a chemical kinetics model for protein adsorption and desorption, predicted an existence of a critical protein coverage fraction above which adsorption is negatively affected. Heimburg et al. [27] developed a model and conducted experiments for peripheral protein binding on a DOPG/DOPC bilayer. The model takes into account the long-range electrostatic interaction among proteins, along with an equation of state for protein distribution, and a statistical thermodynamics model for lipid distribution in the bilayer while predicting the binding isotherms.
Studies involving the curvature sorting and binding of proteins in giant unilamellar vesicles (GUVs) have been gaining attention in recent times. Reynwar et al. [28] conducted coarse-grained molecular simulations that show that the curvature inducing proteins get absorbed on lipid bilayer experience attractive interaction due to curvature. Sorre and coworkers [18,29], in their experimental investigation, observed that proteins, apart from sensing and generating curvature, also facilitate and amplify lipid segregation near a critical point. Furthermore, the nature of MC-S&G depends on protein concentration. Curvature sorting of lipids and its influence on the bending stiffness of the bilayer membrane was studied by Tian et al. [19,30]. In the dynamic sorting of lipids and proteins, studied by Heinrich et al. [31], nucleation of disordered membrane domains have been observed to occur at the junction between the tether and the GUV. Incidentally, solution of membrane shape equations obtained from bending elasticity model, shows that the curvature is highest at the junction. Capraro et al. [32] investigated the curvature sensing of the protein epsin via N-terminal homology (ENTH) and derived the spontaneous curvature of the ENTH/PIP2 complex. It was also noted that ENTH binds preferentially to membranes with large curvature.
In this contribution, we investigate curvature sorting of proteins in a tether pulled from a GUV using mechanical-thermodynamic models. We employ the Helfrich model for bending elasticity of the membrane with membrane spontaneous curvature proportional to protein concentration, and Van der Waals or Bragg-Williams models with interaction for the proteins binding to the membrane. We first discuss sorting on a catenoid-like shape and, subsequently, sorting on a cylindrical tube. We observe that, except for the neck region of the catenoid the two scenarios are almost identical. We discuss sorting in a tube in detail including the phase transition based on protein concentration, coexistence of phases, and stability of solutions. Finally, we fit model predictions to recent experimental data, obtained from Refs. [29,33], and estimate various parameters including the intrinsic curvature of proteins.
II. CURVATURE SORTING IN A CATENOID
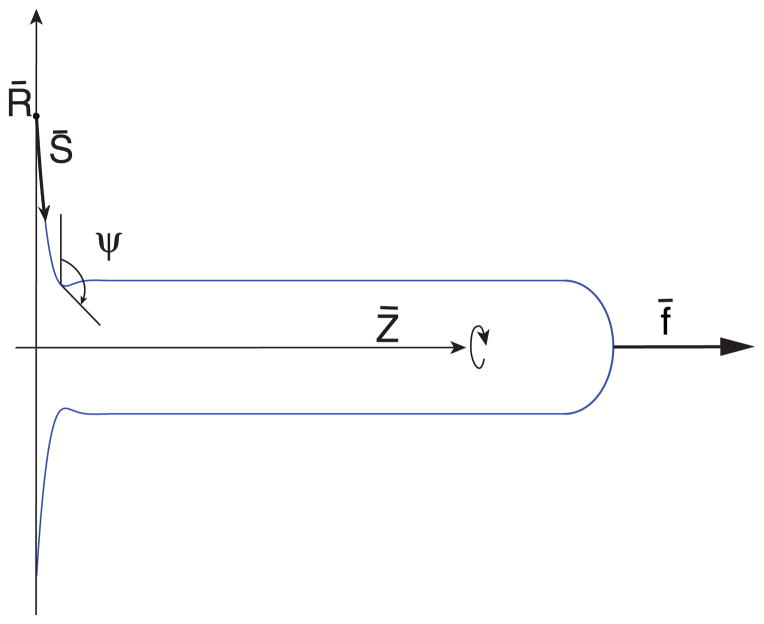
We consider a situation when a tube (tether) is connected to a membrane reservoir (GUV). Typically a tether has a diameter in the range of 20–100 nm, whereas the diameter of a GUV is 10 μm or more. Accordingly, we can consider this to be a tether pulled from a flat membrane. In such a case the shape of the tether is that of a catenoid as shown in Fig. 1. In the following we derive the shape equations of the catenoid in the scenario when proteins bind to the outer surface. The free energy has contributions from the bending elasticity of the bilayer membrane [34], the mixing free energy of proteins modeled as a gas [18], and a spontaneous curvature linear in protein concentration [29]. An equivalent model exists where a term that couples composition and curvature linearly is included in the free energy [1,35]. Free energy of the catenoid is then given by
FIG. 1.
(Color online) Schematic of a catenoid along with the definition of geometric variables.
| (1) |
where the Lagrangian
 with mixing free energy is
Here, t is a generalized parameter, S̄ is the arclength, ψ is the tangent angle at any point on the catenoid measured from vertical, R̄ is the radial distance from the axis of symmetry, Σ̄ is the lateral tension in the membrane, κ is the bending stiffness of the membrane, C̄0 is the spontaneous curvature of the membrane, P̄ is the pressure across the membrane, and prime (′) denotes derivatives with respect to t. The pulling force f̄ is required to maintain a stable length of the tether and γ̄ is a Lagrange multiplier for the geometric constraint [36]. We consider that the membrane spontaneous curvature is linear in protein concentration, (i.e., C̄0 = θC̄p) where C̄p is the intrinsic curvature of protein molecules and we assume that it does not depend on membrane curvature. The function Γ̄ (θ ), where θ is the coverage fraction of proteins, is a Legendre transformed free energy density (due to mixing only) of the proteins [37]
where f̄m is the free energy (per unit area) of the proteins due to mixing and protein-protein interaction, b̄ is the area occupied by an individual molecule, μ̄ves is the chemical potential of the proteins bound to the vesicle (the lipid reservoir), and Π̄ves is the fixed pressure of the proteins on the vesicle. Note that μ̄ves is also fixed and is equal to the chemical potential of the proteins in the aqueous solution and Γ̄ (θves) = 0, when C̄p = 0.
Before proceeding further we nondimensionalize the quantities as follows. Lengths are made dimensionless by a reference tube radius R0, energy is made dimensionless by the bending rigidity κ, and forces are made dimensionless by the ratio of κ and R0. That is
With this the dimensionless free energy and the Lagrangian are
| (2) |
| (3) |
The Euler-Lagrange equations that determine the shape of the catenoid are given by
where q takes up values of ψ, R, θ, and S. The explicit equations are given by
| (4) |
| (5) |
| (6) |
In the above
and the overdot denotes derivative with respect to the dimensionless arclength S. Equation (6) is obtained by differentiating the Euler-Lagrange equation corresponding to θ
| (7) |
and using Eq. (4) for ψ̈ in the resulting expression. Equation (7) also provides a relation for the dependence of composition on curvature.
The differential equations for R and Z in the axisymmetric scenario are
| (8) |
From the Euler-Lagrange equation for S and the corresponding boundary condition that ∂
 /∂S′ = 0 we have the Hamiltonian
The boundary conditions obtained from variational principle are
| (9) |
and
| (10) |
Other boundary conditions are
| (11) |
and when the catenoid area is fixed the condition
Ltube being the specified catenoid length, is imposed to compute the pulling force f.
III. CURVATURE SORTING OF PROTEINS USING VAN DER WAALS MODEL
The mixing and interaction energy of the proteins per unit membrane area, when they are modeled as Van der Waals gas, is given by
where T is absolute temperature, kB is the Boltzmann’s constant, and ā is a measure of the strength of protein-protein interactions. When made dimensionless b̄ and ā become
With this, the dimensionless fm is
| (12) |
and if the proteins bound to the vesicle membrane are also modeled as Van der Waals gas, then the dimensionless μves and Πves are
| (13) |
where θves is the (fixed) protein coverage fraction on the vesicle membrane. The vesicle radius is much larger than the tether radius and therefore we consider 1/Rves = 0 in subsequent calculations. Finally, Γ in the dimensionless form is
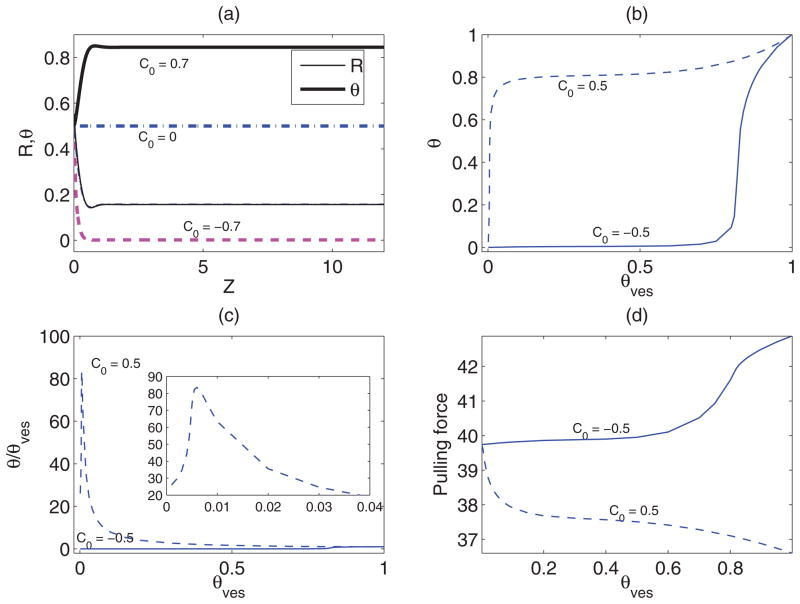
We numerically integrate the shape equations (4) through (6) and (8) along with the boundary conditions (9) through (11), with fm, μves, and Πves as given by Eqs. (12) and (13), respectively. The catenoid shape and the variation of protein coverage fraction θ and pulling force f obtained from numerical solution, for a set of parameter values, are shown in Fig. 2. Note that the quantities such as protein coverage fraction and curvature vary significantly in the region where shape/curvature changes rapidly. We observe from Fig. 2(a) that for positive C0 proteins sort favourably into the tube portion (higher curvature), the reverse happens for negative C0, and curvature has no influence on sorting when C0 is zero. In Figs. 2(b) and 2(c) we present the variation of tube protein coverage fraction and the same normalized by vesicle protein concentration. Figure 2(b) shows that for negative C0 protein concentration on the tube is always less than that on the vesicle membrane, and up to a significantly large θves protein concentration remains low on the tube. Beyond θves ≈ 0.8 protein concentration on the tube experiences a rapid increase, however, it is still below θves. The rapid increase is due to crowding of proteins on the vesicle at higher concentration. The increase of θ with θves also correlates with the increase of pulling force with θves [Fig. 2(d)]. For positive C0 the sorting effect is much more significant. For θves ≈ 0.0055, the protein concentration on the tube is approximately 85 times of θves. For θves less than 0.04, the normalized tube protein coverage fraction is higher than 20. Such a large increase in protein density has also been observed experimentally [29,33,38]. Around θves ≈ 0.05 saturation in tube protein coverage fraction has been observed. This is again due to the crowding effect on the tube. Also, note that in this case the increase of θ with θves also correlates with the decrease in pulling force [Fig. 2(d)]. This implies that protein binding increases the stability of the tether, in the sense that less force is required to maintain the tube at specified length. A similar mechanism may be in place, when motor proteins pull tethers from donor membranes such as Golgi network, and peripheral protein binding helps maintain such tubular regions [39,40].
FIG. 2.
(Color online) Numerical solution of the shape equations for Van der Waals mixing energy with a = 3, b = 1, Σ = 20, Ltube = 12, and C0 as shown. (a) The shape (thin-solid, dashed, and dash-dot lines) and the variation protein concentration (thick-solid, dashed, and dash-dot lines) along the length for θves = 0.5. The catenoid shapes for different values of C0 do not differ significantly from each other. The variations (b) θ (Send) with θves; (c) normalized θ (Send) with θves (an enlarged view for small θves has been shown in inset); and (d) pulling force f with θves.
IV. CURVATURE SORTING OF PROTEINS USING BRAGG-WILLIAMS MODEL
We now model proteins using the Bragg-Williams mean field theory. The mixing and interaction energy of the proteins (dimensionless form) in this case is given by
| (14) |
where the last term corresponds to protein-protein interactions. The quantities μves and Πves are
| (15) |
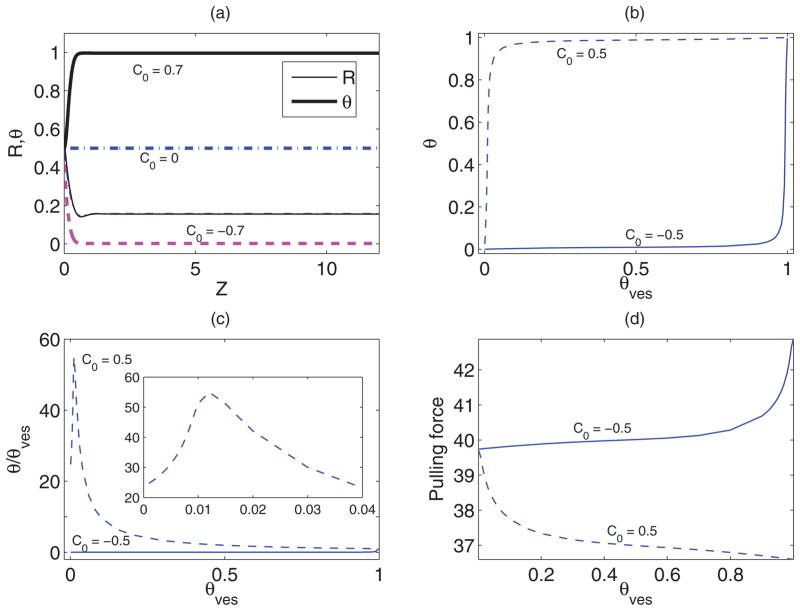
Numerical solutions of the shape equations (4) through (6) and (8) along with the boundary conditions (9) through (11), with fm, μves and Πves energy as given by equations (14) and (15), respectively, are presented in Fig. 3. Parameter values, except the molecular interaction parameter χ, are the same as those considered for the Van der Waals model. The behavior of the solutions in this case is qualitatively the same as that observed for Van der Waals gas model presented in Fig. 2. However, in this case the sorting effect is somewhat less significant. In the cylindrical region these quantities are almost constant. Furthermore, from Figs. 2(a) and 3(a) we can conclude that protein coverage fraction is significantly influenced by the sign of C0, however, the catenoid shape remains almost the same.
FIG. 3.
(Color online) Numerical solution of the shape equations for Bragg-Williams mixing energy with χ = 1.5, b = 1, Σ = 20, Ltube = 12, and C0 as shown. (a) The shape (thin-solid, dashed, and dash-dot lines) and the variation protein concentration (thick-solid, dashed, and dash-dot lines) along the length for θves = 0.5. The catenoid shapes for different values of C0 do not differ significantly from each other. The variations (b) θ (Send) with θves; (c) normalized θ (Send) with θves (an enlarged view for small θves has been shown in inset); and (d) pulling force f with θves.
We finally note that the values of a or χ, b, and C0 are chosen such that the proteins remain in the unique stable configuration. They do not satisfy the condition for dynamic curvature instability observed by Leibler [41]. The parameter regime in which multiple stable states are observed has not been considered for the catenoid. This regime will be considered for the sorting on a cylinder. This scenario facilitates analytical or semianalytical determination of stability and coexistence of solutions. Accordingly, in the following we describe the curvature-dependent sorting in a cylinder, enabling us to derive conditions for stability and coexistence of solutions analytically.
V. CURVATURE SORTING ON A CYLINDER
The form of the free energy, in the dimensionless form, for a cylinder is (for P = 0)
where L is the dimensionless length of the cylinder of radius R. The term f L is the work done on the tube by externally applied pulling force. For equilibrium the derivatives of the free energy with respect to R, θ, and L should be zero, which give
| (16) |
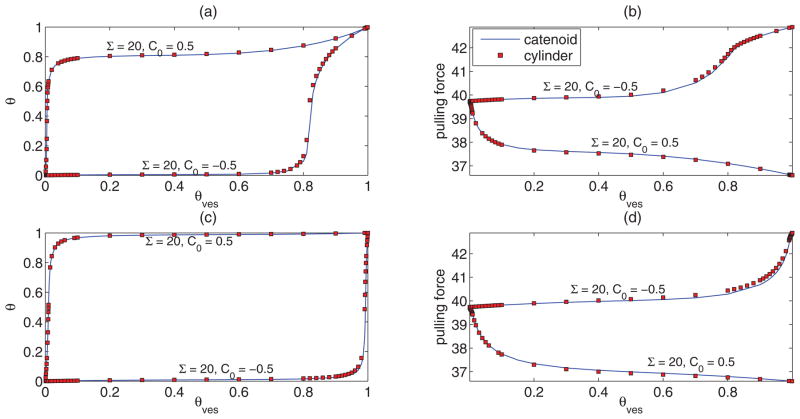
To obtain a solution for θ with other parameters fixed, we combine the first two equations of (16) to eliminate R and solve the resulting equation using a root finding technique. We compare the solutions of the cylinder with the solutions of the catenoid shape equations. We present the comparison between the catenoid and cylinder solutions for protein concentration and pulling force for both Van der Waals gas and Bragg-Williams models for an exemplary set of parameter values in Fig. 4. We find extremely good agreements between the cylinder and catenoid solutions for these and other quantities such as, R and variation of θ with respect to Σ (not shown). Accordingly, in the following we investigate curvature sorting on a cylinder, which gives equations that are analytically tractable.
FIG. 4.
(Color online) Comparison of some quantities obtained from numerical solution of the catenoid shape equations and the algebraic equations for the cylinder with b = 1 and Ltube = 12. (a) Tube protein concentration and (b) pulling force vs θves for the Van der Waals gas model for a = 3. (c) Tube protein concentration and (b) pulling force vs θves for the Bragg-Williams model for χ = 1.5. Other parameter values are as mentioned in the plots.
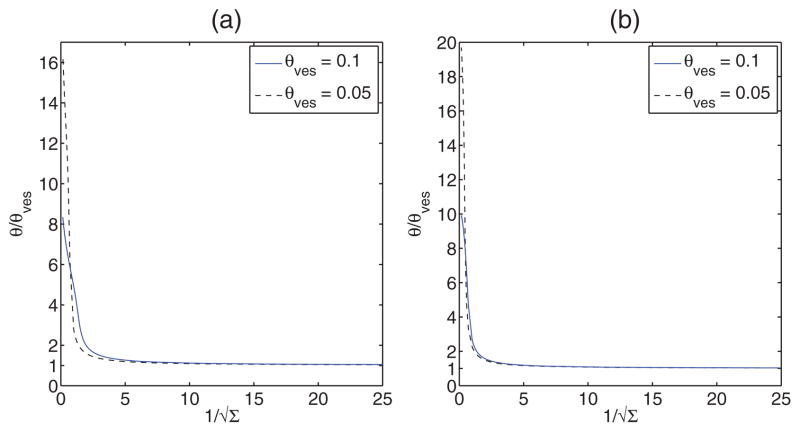
In Fig. 5, we present the variation of protein coverage fraction normalized by vesicle protein coverage fraction with for θves = 0.1 and 0.05. Note, from the second of Eq. (16), that for θ = θves, the initial tube radius R is inversely proportional to . So, the results suggest that the normalized protein coverage fraction increases sharply (about sixteenfold or higher for θves = 0.05) with a decrease in tube radius. The increase in tube protein coverage fraction is even larger for smaller values of θves as observed in Figs. 2 and 3. Similar sorting effect has been observed for N-BAR domains on liposomes in a SLiC assay by Bhatia and coworkers [38]. There the authors claim that sensing is due to N-terminal helices and defects on the liposome surface. In our study, the effect of helices and BAR domain curvature has been accounted for by assuming that the spontaneous curvature is the product of protein concentration and the intrinsic curvature of individual BAR domain. However, a comparison between our study and the experimental results of Ref. [38] is not possible as the experimental conditions are different because the tube/catenoid is connected to the lipid reservoir and the mechanisms of sorting may be different [1]. The packing defects have not been explicitly considered in our simple model.
FIG. 5.
(Color online) Normalized tube protein concentration vs or the initial tube radius for the Van der Waals (left) and Bragg-Williams (right) models. For small initial tube radius we observe a large increase in protein density in the tube.
We know that both Van der Waals or Bragg-Williams mixing model exhibit first-order phase transition. It has been shown in Ref. [33] that the curvature composition coupling model using Van der Waals type mixing predicts such phase transition. Condition for stability is
For the Van der Waals and the Bragg-Williams models the condition is explicitly given by
| (17) |
respectively. The critical values of a and χ are,
| (18) |
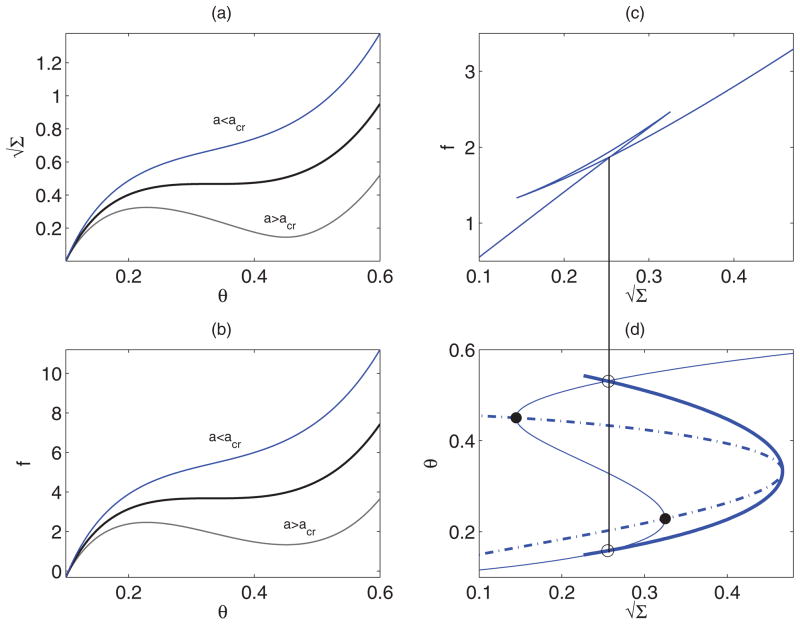
Using Eq. (16), we compute variation of lateral tension Σ and pulling force f with θ for different values of a above and below acrit (for Van der Waals gas model). Such variations are shown in Figs. 6(a) and 6(b), respectively. Note that for a range of θ below θves pulling force and/or Σ become negative (not shown). Such values of θ are not considered as a physically feasible solution. For a < acrit, for a given Σ, there is a unique θ, which is also the stable solution. For a > acrit, there exist multiple solutions (multiple values of θ ), for a specified Σ, out of which the solution with intermediate θ is unstable and the other two are locally stable. Multiple equilibrium solutions already satisfy the condition of same chemical potential [first of Eq. (16)]. In this case we have a mechanical condition for coexistence that the pulling force, given by last of Eq. (16), must be the same for the coexisting solutions, that is,
FIG. 6.
(Color online) (a) and (b): Variation of and pulling force f, respectively, with protein coverage fraction for the Van der Waals interaction parameters a above and below the critical value. (c) Pulling force with for a above acrit. A Gibbs loop is seen and the self-intersection corresponds to the values of f and Σ at coexistence. (d) The binodal (thick solid) and spinodal (dash-dot) curves in plane. The points on the binodal are obtained by finding the outermost intersections (marked by open circles) of the vertical line from the coexistence point in (c) with the (thin solid) curve. The points on the spinodal corresponds to the turning points (filled circles) of the curve.
| (19) |
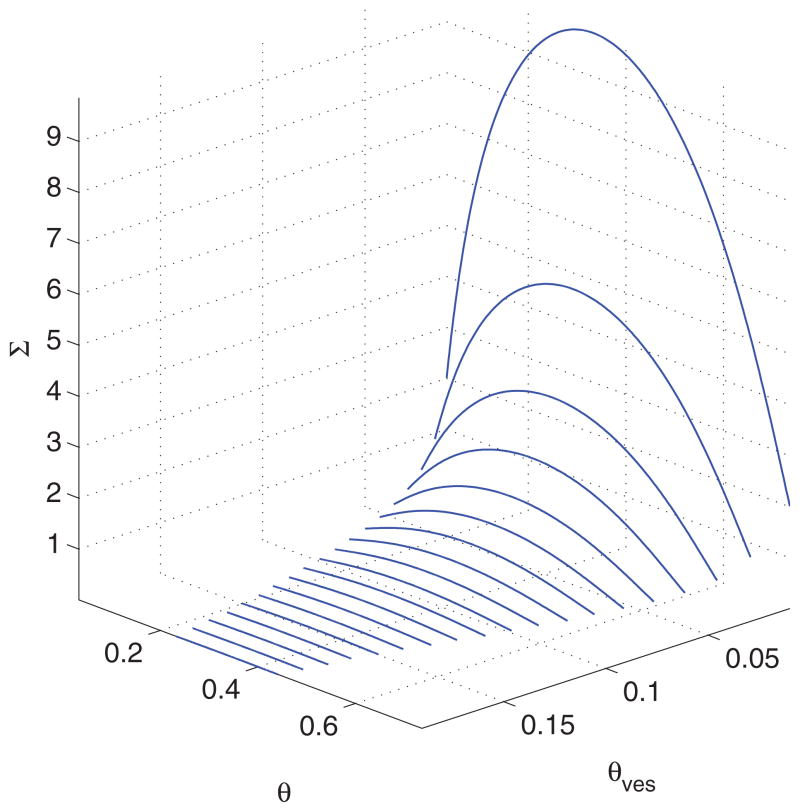
Note also that the pulling force is the free energy of the tube per unit length, whose variation with has been shown in Fig. 6(c). Existence of a Gibbs loop indicates that the system undergoes a first-order phase transition and the point of self-intersection provides the values for f and Σ at coexistence [37]. The corresponding values of θ are the outermost intersections with the curve, as shown in Fig. 6(d). The spinodal obtained from the first of Eq. (17) is also shown. We mention that the binodal and spinodal curves change with the parameter values chosen. In particular, with increasing θves the range of θ values in which solutions coexist becomes narrower as shown in Fig. 7. Cryoelectron microscopy studies of lipid vesicles incubated with endophilin have shown existence of coated tubules of different morphologies reflecting the local protein concentration [17]. The observations can be considered as a possibility for the existence of a first-order phase transition and coexistence of solutions predicted in our study.
FIG. 7.
(Color online) Coexistence curve for Van der Waals model for different θves for b = 1. Ranges of values of θ and Σ become narrower with increasing θves.
VI. COMPARISON WITH EXPERIMENTS
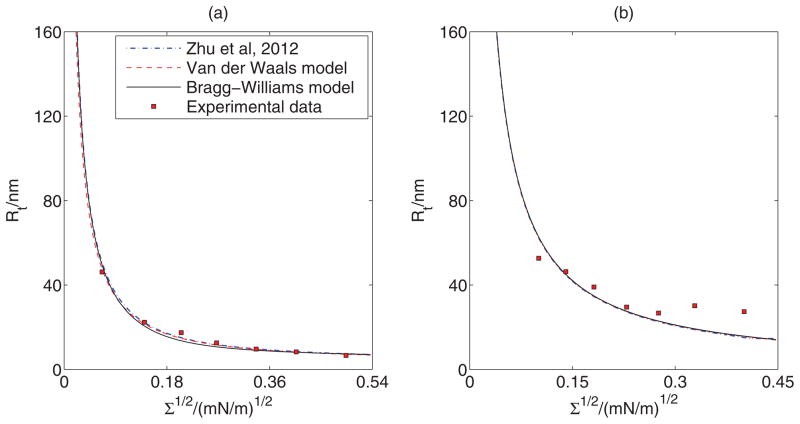
We now fit our model predictions to the experimental report on curvature sorting, of endophilin N-BAR domain, presented in Figs. 2E and 2F of [33] for two different solution concentrations of proteins. Fitting results from Ref. [33], the Van der Waals model, and the Bragg-Williams model, respectively, have been shown in Fig. 8 and the corresponding best fit values have been presented in Table I. The fitted values of the parameters are close to each other for all the scenarios. Small differences between our fitted values using the Van der Waals model and those reported in Ref. [33] have been observed. One likely reason for such differences is that Zhu et al. [33] fitted simultaneously to protein sorting as well as tube curvature measurements, whereas here we fit to sorting measurements only. Note also that the Bragg-Williams model predicts a smaller spontaneous curvature. Furthermore, for 40 nM solution concentration this model predicts the excluded area of proteins to be 0.27 nm2, which is much smaller than the value of 50 nm2–53 nm2 obtained via cryoelectron microscopy reconstruction [17].
FIG. 8.
(Color online) Comparison of model prediction with experimental results. Best fit curves to experimental data of Figs. (a) 2E and (b) 2F of Zhu et al. [33] for the Van der Waals and the Bragg-Williams models. Fitted parameter values are shown in Table I.
TABLE I.
Best fit parameter values corresponding to Fig. 8. Corresponding dimensional values are mentioned within parentheses. Dimensional values are obtained using the scaling radius R0 = 1 μm and bending stiffness κ = 0.8 × 10⁻¹⁹ J.
| Solution concentration | Parameters | Van der Waals ( [33]) | Van der Waals (present) | Bragg-Willliams (present) |
|---|---|---|---|---|
| (a) 1 μM (Fig. 2E of [33]) | C0 | 139.94 (0.14 nm−1) | 168.81 (0.17 nm−1) | 118.26 (0.12 nm−1) |
| b | 0.0011 (56.54 nm2) | 0.00078 (40.10 nm2) | 0.00083 (42.66 nm2) | |
| θves | 0.096 | 0.1429 | 0.1454 | |
| a | 0.00024 (12.34 kB T nm2) | 0.00017 (8.74 kB T nm2) | – | |
| χ | – | – | 0.7522 (0.7522 kB T ) | |
| (b) 40 nM (Fig. 2F of [33]) | C0 | 18.94 (0.019 nm−1) | 18.94 (0.019 nm−1) | 5.83 (0.006 nm−1) |
| b | 0.0013 (66.83 nm2) | 0.00076 (39.06 nm2) | 0.0000052 (0.27 nm2) | |
| θves | 0.019 | 0.0189 | 0.0083 | |
| a | 0.0045 (231.32 kB T nm2) | 0.0038 (195.34 kB T nm2) | – | |
| χ | – | – | 0.2077 (0.2077 kb T ) |
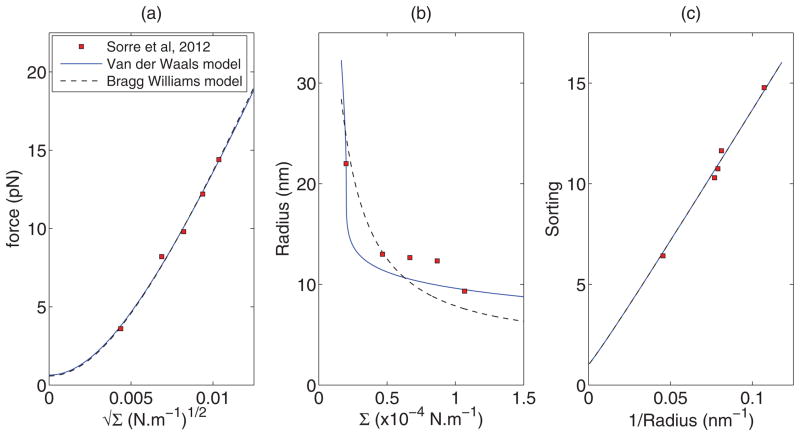
We also fit our model to the experimental data for the sorting of protein amphiphysin 1 obtained from Figs. 2A (force vs. ), 2B (radius vs. ), and 2C (sorting vs radius) of Sorre et al. [29] as shown in Fig. 9. We conduct a two parameter fit to estimate C0 and a or χ. The values of b̄ and θves were taken to be 50 nm2 and 280/μm2, respectively [29]. The corresponding best fit values have been provided in Table II. We find that our model fits experimental data well. Except in Fig. 9(b) the Van der Waals and Bragg-Williams models differ significantly. The values of spontaneous curvature for the Van der Waals model and Bragg-Williams model are close to each other. Furthermore, Sorre et al. [29] obtained the intrinsic curvatures of the proteins as (or C̄p = 0.526 nm−1), by fitting a linear model without interaction to their data given in Fig. 2C. From Table II, we find that this agrees with our fitted values of C̄p = 0.531 nm−1 (Van der Waals) or C̄p = 0.533 nm−1 (Bragg-Williams) and zero magnitude of the interaction parameter. We also note that the fitted values of the interaction parameter a in Fig. 8(b) and χ in Fig. 9(a) are above their critical values given by Eq. (18). Once again, this indicates the possibility of coexistence of solutions with different protein concentrations. However, further experimental investigation is needed to observe and characterize such coexistence of solutions.
FIG. 9.
(Color online) Comparison of model prediction with experimental results. Best fit curves to experimental data of Figs. (a) 2A, (b) 2B, and (c) 2C of Sorre et al. [29], respectively, for the Van der Waals and the Bragg-Williams models. Fitted parameter values are shown in Table II.
TABLE II.
Best fit parameter values corresponding to Fig. 9. Corresponding dimensional values are mentioned within parentheses. Dimensional values are obtained using the scaling radius R0 = 1 μm and bending stiffness κ = 20 kB T. The values b̄ = 50 nm2 and θves = 280/μm2 are taken from Ref. [29].
| Experimental Data | Parameters | Van der Waals | Bragg-Willliams |
|---|---|---|---|
| (a) Fig. 2A of [29] | C0 | 42.8903 (0.043 nm−1) | 34.6521 (0.035 nm−1) |
| a | 0.005909 (295.45 kB T nm2) | – | |
| χ | – | 4.31897 (4.31897 kb T) | |
| (b) Fig. 2B of [29] | C0 | 106.0896 (0.106 nm−1) | 170.6186 (0.171 nm−1) |
| a | 0.0033781 (168.91 kB T nm2) | – | |
| χ | – | 0 (0 kb T) | |
| (c) Fig. 2C of [29] | C0 | 530.7457 (0.531 nm−1) | 533.1961 (0.533 nm−1) |
| a | 0 (0 kB T nm2) | – | |
| χ | – | 0 (0 kB T) |
VII. CONCLUSION
In this study, we discuss curvature sorting of proteins on a catenoid pulled from a vesicle and cylinder using a mixing free energy for the proteins and Helfrich bending energy for the bilayer membrane. We first find that on the catenoid the quantities vary a little on the cylindrical region. We subsequently, discuss sorting on a cylinder of uniform radius. A comparison with the catenoid model shows that the cylinder model approximates the catenoid very well. For varying protein concentration on the vesicle, we find that with positive protein intrinsic curvature there is a large (approximately 65- to 90-fold) increase in tube protein coverage fraction. Furthermore, tube protein concentration decays with the increase of initial tube radius. This is an indication of curvature sensing by proteins and subsequent sorting. Such sorting of endophilin N-BAR and amphiphysin N-BAR domains have been observed experimentally in liposomes. However, exact mechanisms of sorting in liposome and the tether connected to a reservoir may be different. Such differences are a subject for future research. We compare our model prediction with the two different sets of recent experimental data and obtain good agreement in most cases. In a few cases, the fitted value of the interaction parameters are higher than the critical values indicating the possibility of first-order phase transition in experiments. We also investigate a first-order phase transition and coexistence of solutions in our model. Further experimental study is needed to characterize such coexistence of solutions.
Acknowledgments
T.B. acknowledges funding from the National Institutes of Health, Grant No. R01 GM097552, and NSF Grant No. MCB-0718569. S.L.D. would like to thank the Indian Institute of Technology, Kanpur for support through Grant No. INT/IITK/ME/20090343.
Contributor Information
Pankaj Singh, Department of Mechanical Engineering, Indian Institute of Technology, Kanpur 208016, India.
Paritosh Mahata, Department of Mechanical Engineering, Indian Institute of Technology, Kanpur 208016, India.
Tobias Baumgart, Department of Chemistry, University of Pennsylvania, Philadelphia, Pennsylvania, USA.
Sovan Lal Das, Department of Mechanical Engineering, Indian Institute of Technology, Kanpur 208016, India.
References
- 1.Baumgart T, Capraro B, Zhu C, Das SL. Annu Rev Phys Chem. 2011;62:483. doi: 10.1146/annurev.physchem.012809.103450. [DOI] [PMC free article] [PubMed] [Google Scholar]
- 2.Zimmerberg J, McLaughlin S. Curr Biol. 2004;14:R250. doi: 10.1016/j.cub.2004.02.060. [DOI] [PubMed] [Google Scholar]
- 3.Zimmerberg J, Kozlov MM. Nature Rev Mol Cell Biol. 2006;7:9. doi: 10.1038/nrm1784. [DOI] [PubMed] [Google Scholar]
- 4.McMahon HT, Gallop JL. Nature (London) 2005;438:590. doi: 10.1038/nature04396. [DOI] [PubMed] [Google Scholar]
- 5.Frost A, Perera R, Roux A, Spasov K, Destaing O, Egelman E, de Camilli P, Unger VM. Cell. 2008;132:807. doi: 10.1016/j.cell.2007.12.041. [DOI] [PMC free article] [PubMed] [Google Scholar]
- 6.Peter BJ, Kent HM, Mills IG, Vallis Y, Jonathan P, Butler G, Evans PR, McMahon HT. Science. 2004;303:495. doi: 10.1126/science.1092586. [DOI] [PubMed] [Google Scholar]
- 7.Farsad K, Camilli PD. Current Opinion in Cell Biology. 2003;15:372. doi: 10.1016/s0955-0674(03)00073-5. [DOI] [PubMed] [Google Scholar]
- 8.Campelo F, McMahon HT, Kozlov MM. Biophys J. 2008;95:2325. doi: 10.1529/biophysj.108.133173. [DOI] [PMC free article] [PubMed] [Google Scholar]
- 9.Ford MGJ, Mills IG, Peter BJ, Vallis Y, et al. Nature (London) 2002;419:361. doi: 10.1038/nature01020. [DOI] [PubMed] [Google Scholar]
- 10.Itoh T, Koshiba S, Kigawa T, Kikuchi A, Yokoyama S, Takenawa T. Science. 2001;291:1047. doi: 10.1126/science.291.5506.1047. [DOI] [PubMed] [Google Scholar]
- 11.Yoon Y, Tong JS, Lee PJ, Albanese A, et al. J Biol Chem. 2010;285:531. doi: 10.1074/jbc.M109.068015. [DOI] [PMC free article] [PubMed] [Google Scholar]
- 12.Martens S, Kozlov MM, McMahon HT. Science. 2007;316:1205. doi: 10.1126/science.1142614. [DOI] [PubMed] [Google Scholar]
- 13.Cao X, Coskun U, Rössle M, Buschhorn SB, et al. PNAS. 2009;106:21121. doi: 10.1073/pnas.0911789106. [DOI] [PMC free article] [PubMed] [Google Scholar]
- 14.Wang Q, Navarro MV, Peng G, et al. PNAS. 2009;106:12700. doi: 10.1073/pnas.0902974106. [DOI] [PMC free article] [PubMed] [Google Scholar]
- 15.Takei K, Slepnev VI, Haucke V, Camilli PD. Nature Cell Biol. 1999;1:33. doi: 10.1038/9004. [DOI] [PubMed] [Google Scholar]
- 16.Farsad K, Ringstad N, Takei K, et al. J Cell Biol. 2001;155:193. doi: 10.1083/jcb.200107075. [DOI] [PMC free article] [PubMed] [Google Scholar]
- 17.Mizuno N, Jao CC, Langen R, Steven AC. J Biol Chem. 2010;285:23351. doi: 10.1074/jbc.M110.143776. [DOI] [PMC free article] [PubMed] [Google Scholar]
- 18.Sorre B, Callan-Jones A, Manneville JB, Nassoy P, Joanny JF, Frost J, Goud B, Bassereau P. PNAS. 2009;106:5622. doi: 10.1073/pnas.0811243106. [DOI] [PMC free article] [PubMed] [Google Scholar]
- 19.Tian A, Capraro BR, Esposito C, Baumgart T. Biophys J. 2009;97:1636. doi: 10.1016/j.bpj.2009.07.012. [DOI] [PMC free article] [PubMed] [Google Scholar]
- 20.Sens P, Turner MS. Biophys J. 2004;86:2049. doi: 10.1016/S0006-3495(04)74266-6. [DOI] [PMC free article] [PubMed] [Google Scholar]
- 21.Stachowiak JC, Hayden CC, Sasaki DY. PNAS. 2010;107:7781. doi: 10.1073/pnas.0913306107. [DOI] [PMC free article] [PubMed] [Google Scholar]
- 22.Praefcke GJK, McMahon HT. Nature Rev Mol Cell Biol. 2005;5:133. doi: 10.1038/nrm1313. [DOI] [PubMed] [Google Scholar]
- 23.Chatelier RC, Minton AP. Biophys J. 1996;71:2367. doi: 10.1016/S0006-3495(96)79430-4. [DOI] [PMC free article] [PubMed] [Google Scholar]
- 24.Minton AP. Biophys J. 1999;76:176. doi: 10.1016/S0006-3495(99)77187-0. [DOI] [PMC free article] [PubMed] [Google Scholar]
- 25.Minton AP. Biophys J. 2001;80:1641. doi: 10.1016/S0006-3495(01)76136-X. [DOI] [PMC free article] [PubMed] [Google Scholar]
- 26.Zhdanov VP, Kasemo B. Biophys Chemistry. 2010;146:60. doi: 10.1016/j.bpc.2009.10.005. [DOI] [PubMed] [Google Scholar]
- 27.Heimburg T, Angerstein B, Marsh D. Biophys J. 1999;76:2575. doi: 10.1016/S0006-3495(99)77410-2. [DOI] [PMC free article] [PubMed] [Google Scholar]
- 28.Reynwar BJ, Illya G, Harmandris VA, Müller MM, Deserno M. Nature (London) 2007;464:461. doi: 10.1038/nature05840. [DOI] [PubMed] [Google Scholar]
- 29.Sorre B, Callan-Jones A, Manzi J, et al. PNAS. 2012;109:173. doi: 10.1073/pnas.1103594108. [DOI] [PMC free article] [PubMed] [Google Scholar]
- 30.Tian A, Baumgart T. Biophys J. 2009;96:2676. doi: 10.1016/j.bpj.2008.11.067. [DOI] [PMC free article] [PubMed] [Google Scholar]
- 31.Heinrich M, Tian A, Esposito C, Baumgart T. PNAS. 2010;107:7208. doi: 10.1073/pnas.0913997107. [DOI] [PMC free article] [PubMed] [Google Scholar]
- 32.Capraro BR, Yoon Y, Cho W, Baumgart T. JACS. 2010;132:1200. doi: 10.1021/ja907936c. [DOI] [PMC free article] [PubMed] [Google Scholar]
- 33.Zhu C, Das SL, Baumgart T. Biophys J. 2012;102:1837. doi: 10.1016/j.bpj.2012.03.039. [DOI] [PMC free article] [PubMed] [Google Scholar]
- 34.Helfrich W. Z Naturforsch. 1973;28c:693. doi: 10.1515/znc-1973-11-1209. [DOI] [PubMed] [Google Scholar]
- 35.Leibler S. In: Statistical Mechanics of Membranes and Surfaces. Nelson D, Piran T, Weinberg S, editors. Springer-Verlag; Berlin: 2004. [Google Scholar]
- 36.Jülicher F, Lipowsky R. Phys Rev E. 1996;53:2670. doi: 10.1103/physreve.53.2670. [DOI] [PubMed] [Google Scholar]
- 37.Callen HB. Thermodynamics and Introduction to Thermostatistics. 2. Wiley; New York: 1985. [Google Scholar]
- 38.Bhatia VK, Madsen KL, Bolinger PY, et al. EMBO J. 2009;28:3303. doi: 10.1038/emboj.2009.261. [DOI] [PMC free article] [PubMed] [Google Scholar]
- 39.Dabora SL, Sheetz MP. Cell. 1988;54:27. doi: 10.1016/0092-8674(88)90176-6. [DOI] [PubMed] [Google Scholar]
- 40.Shibata Y, Hu J, Kozlov MK, Rapoport TA. Annu Rev Cell Dev Biol. 2009;25:329. doi: 10.1146/annurev.cellbio.042308.113324. [DOI] [PubMed] [Google Scholar]
- 41.Leibler S. Journal of Physics (France) 1986;47:507. [Google Scholar]


