Abstract
The electrophysiological method we present is based on a solid supported membrane (SSM) composed of an octadecanethiol layer chemisorbed on a gold coated sensor chip and a phosphatidylcholine monolayer on top. This assembly is mounted into a cuvette system containing the reference electrode, a chlorinated silver wire.
After adsorption of membrane fragments or proteoliposomes containing the membrane protein of interest, a fast solution exchange is used to induce the transport activity of the membrane protein. In the single solution exchange protocol two solutions, one non-activating and one activating solution, are needed. The flow is controlled by pressurized air and a valve and tubing system within a faraday cage.
The kinetics of the electrogenic transport activity is obtained via capacitive coupling between the SSM and the proteoliposomes or membrane fragments. The method, therefore, yields only transient currents. The peak current represents the stationary transport activity. The time dependent transporter currents can be reconstructed by circuit analysis.
This method is especially suited for prokaryotic transporters or eukaryotic transporters from intracellular membranes, which cannot be investigated by patch clamp or voltage clamp methods.
Keywords: Biochemistry, Issue 75, Biophysics, Molecular Biology, Cellular Biology, Physiology, Proteins, Membrane Lipids, Membrane Transport Proteins, Kinetics, Electrophysiology, solid supported membrane, SSM, membrane transporter, lactose permease, lacY, capacitive coupling, solution exchange, model membrane, membrane protein, transporter, kinetics, transport mechanism
Introduction
Here we demonstrate a new electrophysiological approach based on a solid supported membrane (SSM) for characterization of electrogenic membrane proteins.
The solid support consists of a thin gold layer on a glass slide, the sensor chip. The hydrophilic gold surface is used to bind the thiol group of an alcanethiol reagent. Afterwards, selfassembly of a phosphatidylcholine monolyer completes the formation of the SSM.
To measure electrogenic reactions of membrane proteins, proteoliposomes or membrane fragments are adsorbed to the SSM (Figure 1). The protein containing membrane and the SSM then form a capacitively coupled membrane system. Therefore, charge translocation at the protein containing membrane can be detected by capacitive coupling via the SSM. This method yields only transient currents. The peak current represents the stationary transport activity. The time dependent transporter currents can be reconstructed by circuit analysis.
The sensor chip is mounted into a cuvette system (Figure 2). The cuvette has a cylindrical cuvette volume of 17 μl (net volume with o-ring mounted). A spring contact pin creates the contact to the amplifier. An outlet connector is screwed to the top of the main part and carries the reference electrode, a chlorinated silver wire.
The cuvette is mounted in a Faraday cage. It is connected to a fluid pathway , which is used to induce the transport activity of the membrane protein in response to a fast solution exchange (Figure 3). In the single solution exchange protocol two solutions, one non-activating and one activating solution, are required. The flow is controlled by pressurized air using a valve control software on a computer or manual switches on an interface box.
Protocol
1. Setting up an Apparatus for SSM-based Electrophysiology
Details are given in two of our technical publications, which also contain schematic drawings and photographs of our cuvettes and set up 1, 2. Different solution exchange configurations and flow protocols are also discussed in our method paper 2.
In the following we add a few recent improvements and technical details which are of direct relevance for the video presentation.
Valve control and data acquisition
The interface box contains a commercial USB digital output / analog input interface (NI USB 6009 National Instruments) and the valve drivers. It controls the solution flow and is responsible for data acquisition. Valves are normally driven with 12 V. However, for fast switching the valves can be driven with a voltage of up to 18 V. In the video we use a 12 V power supply.
The valve driver circuit board can operate four valves. It was manufactured by the workshop of the Max Planck Institute of Biophysics. Valves can be controlled by computer or manually via switches at the front panel. The latter is convenient for flushing- and cleaning-procedures. During measurement, the interface box is computer-controlled using a valve control and data acquisition software (SURFE2R software, IonGate Biosciences).
2. Preparations
In this section the different protocols for the preparation of a SSM-based electrophysiology experiment are mentioned.
2.1 Making the Lipid solution for formation of the SSM
Mix 25 μl Octadecylamine (5 mg/ml in Chloroform) and 375 μl Diphytanoylphosphatidylcholine (20 mg/ml in Chloroform) in a glas vial.
Using a rotary evaporator and continuous nitrogen gas flow, evaporate the chloroform for about 30 min.
Remove the lipid from the walls of the glass vial by shaking with 500 μl of n-decane. The final lipid concentration is 15 mg/ml with 1:60 (w/w) octadecylamine.
Transfer the solution to the glass storage vial. Store the lipid solution at -20 °C.
2.2 Chlorination of the reference electrode
The reference electrodes have to be chlorinated in regular intervals due to abrasion.
Remove the rest of the old silverchloride layer using fine sandpaper before the chlorination process.
Place the silver wire together with a platinum electrode into a 1 M hydrochloric acid solution and chlorinate for 15 min at 0.5 mA. After completing chlorination, the silver wire changes its color to a homogenous dark grey.
2.3 Preparation of the polyacrylamide gel bridge
Prepare a solution containing 100 mM KPi at pH=7, 100 mM KCl and 6% Acrylamid.
Add 0.3% APS (10% Stock) and 0.6% TEMED and shortly mix the solution with a pipette.
Immediately after mixing the solution, use a pipette to inject 30 μl of the mixture into the empty gel bridge container. It is important to avoid air bubbles during the injection.
During an incubation time of 20 min the gel polymerizes.
After polymerization the gel bridge is stored in solution (100 mM KPi pH 7, 100 mM KCl). To prolong the lifespan of the gel bridge the solution is stored at 4 °C.
2.4 Preparation of the measuring solutions
Due to the strong interaction of the solutes with the SSM, electrical artifacts are generated when solutions of different composition are exchanged. Therefore, the preparation of the solutions is a critical step. Take the following precautions during the solution preparation process to minimize solution exchange artifacts.
Make non-activating and activating solutions from one batch, adjust the pH and ionic strength.
High salt background helps to reduce solution exchange artifacts.
Divide the batch solution into two volumes.
Add the activating compound to the activating solution. Use a compensatory compound in the non-activating solution to keep the osmolarity and ionic strength of both solutions as similar as possible.
If the solutions are stored at 4 °C, make sure that all solutions reached room temperature before starting a measurement, because even small differences in temperature can produce artifacts.
3. A SSM-based Electrophysiology Experiment
Here we present a typical protocol for a SSM-based electrophysiological experiment.
3.1 Preparing the SSM Setup
While the SSM Setup is not in use the tubes are filled with a 30% ethanol/water solution to avoid bacterial growth.
Wash the system with pure water to remove the ethanol from the tubing before mounting the cuvette. Replace the ethanol containers with water containers. Using high pressure (0.6 to 1.0 bar) clean the system with 20-30 ml of water.
Repeat the cleaning procedure using a 100 mM KPi buffer at pH 7.6 or non-activating solution.
Make sure that no air bubbles remain in the fluid system.
3.2 Mounting the cuvette
Attach an o-ring to the reference electrode
Take the gel bridge from the storage solution and connect the reference electrode.
Prefill the outlet connector with non-activating buffer, insert an o-ring and connect the gel bridge to complete the reference electrode assembly. Take special care that no air bubbles are at the junction of the gel bridge and the outlet solution flow pathway.
Preassemble the main part of the cuvette by adding the spring contact pin (connection to the amplifier), the inlet tube (connection to the terminal valve), the o-ring (sealing for the SSM) and the screws.
Using a tweezers, take the sensor chip out of the storing solution (10 mM octadecanethiol in ethanol).
Using a pipette, wash off the remaining solution with approx. 5 ml of pure ethanol.
Dry the electrode under nitrogen gas.
Place the sensor chip accurately on the base part of the cuvette so that the inlet bore of the main part of the cuvette is directed to the circular active area of the sensor.
Add 1 μl of the lipid solution to the active area of the sensor chip. Make sure, that the gold layer is fully covered by the lipid.
Immediately after adding the lipid solution, close the cuvette by adding the preassembled main part.
Before mounting the cuvette into the Faraday cage, be sure that all surfaces are completely dry.
Connect the amplifier to the spring contact pin and the inlet tube to the terminal valve. Then fix the cuvette with the screws inside the faraday cage.
Screw the outlet connector to the top of the cuvette. Finally connect the outlet tube to the outlet connector and the voltage generator to the reference electrode.
Immediately after mounting the cuvette wash the system with buffer at 0.6 bar. This leads to spontaneous SSM formation.
3.3 Measuring membrane parameters
To check the quality of the SSM, capacitance and conductance are measured using the function generator.
Using the function generator, apply 100 mV DC voltage to measure the conductance.
Calculate the conductance: The current decay shows the charging of the membrane capacitor. After the capacitor is fully charged the measured current yields the membrane conductance using Ohm's law. For the sake of simplicity we use the current 1 sec after the voltage is applied to calculate the conductance G=I/U.
Apply a triangular AC voltage of 50 mV peak to peak amplitude and a frequency of 0.5 Hz to measure the capacitance.
Calculate the capacitance: The amplitude of the resulting square wave current represents the charging currents of the capacitor. The capacitance C is equal to the transferred charge Q=IΔt divided by ΔU=100 mV. (ΔU is twice the applied voltage of 50 mV because I is the difference current positive minus negative slope of the triangular voltage.)
Monitor the electrical parameters of the membrane repeatedly every 10 min for approx. 30 to 40 min, until constant values are reached. Wash in between with KPi buffer at high pressure in the range of about 0.6 to 1 bar.
Estimate the quality of the SSM: Optimal parameters are in the range of 0.1 to 0.2 nS and 2 to 3.5 nF. A high conductance above 0.8 nS and low capacitance below 1 nF indicates that the SSM is not correctly formed. A high capacitance above 4 nF may imply that the active zone is not covered completely by the SSM.
If the parameters are not in the optimal range, the membrane should be discarded and another SSM prepared, using a freshly prepared electrode chip.
3.4 Checking for solution exchange artifacts
After the membrane parameters have been checked, the measuring buffers should be tested for solution exchange artifacts.
Insert the respective solution containers to the fluid system.
Remove air bubbles from the fluid system, using the manual valves.
Using the data acquisition software chose the flow protocol you want to use in your experiment.
Adjust the pressure to 0.6 bar and start the measurement.
Apart from the mechanical valve switching artifacts, ideally no artifact currents should be measured or they should be much smaller than the expected protein transport signals. If solution exchange artifacts are observed, try to optimize the buffer compositions and/or the preparation procedure before continuing the experiment.
3.5 Adding the protein sample
Usually proteoliposomes or membrane fragments are stored frozen at -80 °C. For one measurement an aliquot of approximately 30 μl is needed.
Rinse the SSM with non-activating solution.
Thaw the protein sample on ice.
Three 10-sec sonication cycles are alternated with 10-sec cooling intervals on ice. Proteoliposomes are sonicated using a bath sonicator. For membrane fragments a tip sonicator (50W, 30 kHz, 1 mm sonotrode diameter, intensity 20%, cycle 0.5) is used. After the last sonication step do not put the sample back on ice, but inject it immediately into the cuvette.
Unscrew the outlet connector together with the reference electrode assembly.
Using a pipette, aspirate 30 μl of the protein sample and mount the pipette tip to the outlet bore.
Open the manual valve in the non-activating pathway to the waste container and inject the proteoliposomes into the cuvette volume. Be careful not to inject air into the cuvette volume with the sensor.
Before removing the pipette tip, close the manual valve to prevent further solution flow.
Allow the proteoliposomes to adsorb to the SSM for an incubation time of 1 to 2 hr. It is also possible to incubate overnight.
3.6 General Procedure of an SSM-based experiment
Warm up the measuring buffers in time, if stored at 4 °C. All measuring buffers have to be at room temperature before starting the measurement to avoid artifacts.
When changing solutions, first clean the tubes inside the solution containers with a non-fuzzing tissue, then insert the new bottles.
Before starting the measurement, use the manual valves to remove air bubbles, which could have evolved from the changing procedure.
Adjust the pressure just before starting a measurement. We routinely use a pressure of 0.6 bar which at our specific valve and tube configuration yields a flow rate of approximately 1.0 ml/sec.
The first few measurements can be carried out straight one after another and should be rejected until the peak current remains constant. If the solutions differ in pH an incubation time of at least 3 min is needed to adjust the inner pH of the proteoliposomes before starting the measurement.
Now the set up is ready for measurement. To reduce the noise at least 3 measurements should be made and averaged.
3.7 Control Measurements
A signal rundown during a series of measurements could occur due to protein degradation or a loss of adsorption. Each SSM experiment should include a rundown control. This is done by repeated measurements with identical solutions. The minimal rundown control means one measurement at the beginning and one at the end of the experiment, using the same solution.
We recommend to do the rundown control under conditions where you expect the highest peak amplitude in the experiment. This makes it easier to quantify the rundown of the signal.
The signal rundown can be quantified by a comparison of the peak amplitudes of the two rundown controls. The resulting percentage value can be used to correct the measured signals by assuming a linear time dependence of the rundown.
3.8 Artifact controls
If possible try to validate your results by inhibiting the protein of interest after the experiment. Remaining signals are probably solution exchange artifacts. The signals then have to be corrected for the measured artifacts.
3.9 After the experiment
Wash the system with 20-30 ml of pure water and 20-30 ml of 30% ethanol/water. The ethanolic solution avoids bacterial growth when the system is not in use.
After this cleaning procedure, release the pressure from the system and turn off all instruments.
Remove the cuvette from the Faraday cage and dismount it. All parts of the cuvette can be cleaned with water and pure ethanol, if necessary, by using a bath sonicator.
Place the sensor chip in a glas beaker with pure ethanol. Sonicate the beaker for about 1 to 2 min using a bath sonicator.
Dry the sensor chip under nitrogen gas.
Store the sensor chip away from light in a 10 mM Octadecanthiol ethanolic solution. After an incubation time of about 30 min the sensor chip is ready for reuse.
Representative Results
Up to now, SSM-based electrophysiology was used to characterize more than 20 transporters, mostly of prokaryotic origin, e.g. MelB 3, NhaA 4 and PutP 5 (summarized in 6). But also eukaryotic transporters from intracellular membranes, e.g. ClC7 7 as well as ion channels, e.g. the nicotinic acetylcholine receptor 8 have been investigated.
Here we present as an example measurements of the sugar/H+ cotransporter LacY from Escherichia coli using proteoliposomes with at least 85% right side out oriented LacY at a LPR of 5 9, 10. We focus on the main steps leading to a minimal kinetic model of this transport protein.
1. Electrophysiological characterization of wildtype LacY
The first step is a general characterization of the electrogenic reaction by measuring different pH values (Figure 4), substrate concentrations (Figure 5) and substrates. To validate the technique, KM and pK values given in literature were reproduced.
The pH dependence of LacY shows two different electrogenic reactions. The capacitively coupled current increases between pH 5 and pH 8.5, but also changes its shape. Under alkaline conditions steady state transport is observed, while for acidic pH values only a rapid electrogenic reaction remains. To distinguish the steady state signals from the fast electrogenic reactions we used circuit analysis to reconstruct transporter currents (Figure 6).
At pH 7 the monophasic signal becomes biphasic. This also indicates that there are two different electrogenic reactions. Estimated from the transferred charge (integral of the signals), the two reactions have about 6% and 94% of the total electrogenicity of the transport cycle.
2. Assignment of the electrogenic reactions
To assign the two electrogenic reactions to particular steps in the reaction cycle of LacY, the E325A LacY variant was measured (Figure 7). This variant only shows lactose exchange but is deficient for all active transport modes, because of the inhibition of proton release. The signal of E325A LacY represents a fast transient and is constant for all measured pH values. The shape and amplitude of the signal is similar to the signal of wildtype LacY under acidic conditions. In addition we observe a small negative phase after the declining peak current, which is characteristic for rapid transient currents measured in capacitively coupled systems. Because lactose binding and release is not electrogenic, the fast transient must correlate with an electrogenic conformational transition following lactose binding.
It is known that the proton release step is rate limiting for LacY turnover in the lactose concentration gradient driven transport mode. In this case we expect an increase of the transport rate with alkaline pH, because proton release is favored. This is the case for the steady state transport correlated signal of wildtype LacY. Moreover it could be shown by pH gradient measurement that only the inner pH influences the steady state transport of LacY (unpublished). Therefore the large electrogenic reaction could be assigned to the proton release step.
3. Measurements for kinetic analysis
After identification of the electrogenic reactions on and off transport rates were determined using a SSM Setup with a high time resolution of about 4.5 msec. This is only possible under conditions, when one reaction dominates the signal. In this case the rate constants can be derived from the transient currents under consideration of the time resolution of the signals using an iterative least-squares deconvolution algorithm (Figure 8). The determined rate constants as well as the proposed minimal kinetic model (Figure 9) finally were used for the simulation of the transporter kinetics. The simulated curves reproduce the SSM data which additionally proves the kinetic model.
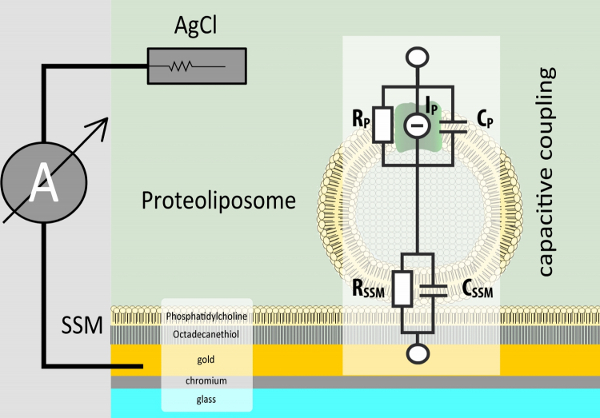 Figure 1. Adsorption geometry of proteoliposomes on the SSM. The SSM is formed on a sensor chip, a structured gold coated glass slide. To measure electrogenic reactions of membrane proteins, proteoliposomes or membrane fragments are adsorbed to the SSM. The two membranes form a capacitively coupled system. This is why only transient currents are detected.
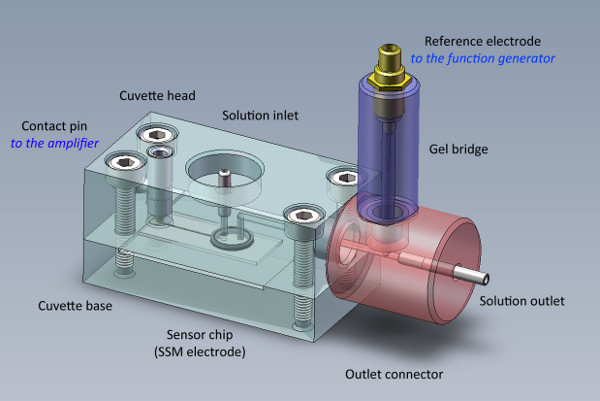 Figure 2. The SSM cuvette carries the sensor chip and the reference electrode. The sensor chip is sandwiched between the cuvette base and the cuvette head. The reference electrode is isolated from the flow pathway by a polyacrylamide gel salt bridge.
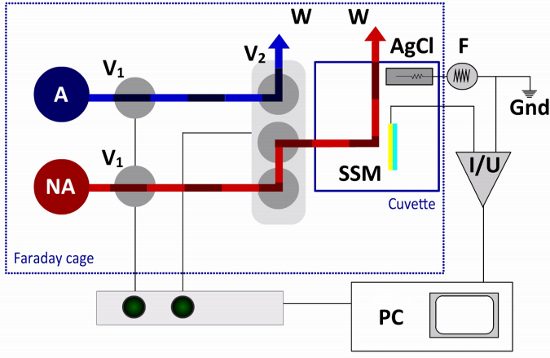 Figure 3. Fluid Pathway and Electrical Circuit of the SSM Setup. In the single solution exchange protocol only one non-activating (NA) and one activating (A) solution are required. The flow is controlled by two 2-way valves (V1) and one terminal valve (V2). The terminal valve switches between non-activating and activating solutions, directing one of the solutions to the cuvette and the other solution to a waste container (W). The sensor chip (SSM) is connected to the amplifier (I/U), while the reference electrode (AgCl) is connected to the function generator (F) in the external electrical circuit. A computer (PC) and an interface box are used for valve operation and data acquisition.
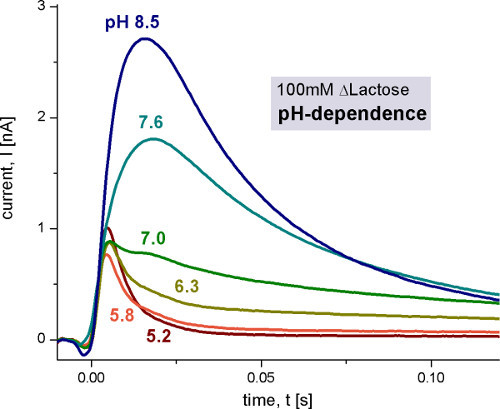 Figure 4. Transient currents measured with wild-type LacY proteoliposomes after 100 mM lactose concentration jumps at different pH values. The non-activating solution contained 100 mM glucose while the activating solution contained 100 mM lactose. All solutions were prepared in 100 mM potassium phosphate buffer at the indicated pH with 1 mM DTT. For details of measurement conditions in this and the following figures please refer to 9 and 10.
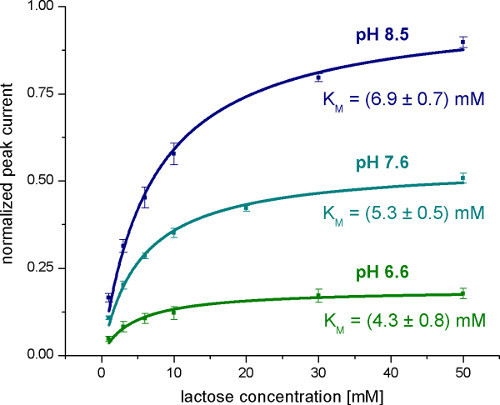 Figure 5. Averaged normalized Peak currents measured with wild-type LacY proteoliposomes after lactose concentration jumps at different concentrations and pH values. The KM values are obtained from the hyperbolic fits.
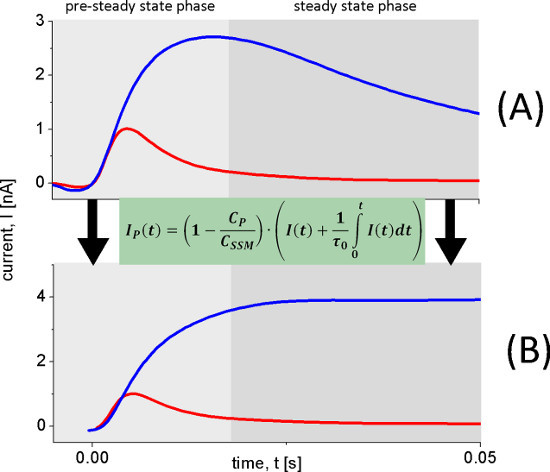 Figure 6. Reconstruction of transporter currents. The transient currents (A) used to reconstruct the transporter currents (B) were measured with wild-type LacY proteoliposomes after 100 mM lactose concentration jumps at pH 8.5 (blue trace) and pH 5.2 (red trace). At pH 8.5 continuous turnover is observed while at pH 5.2 a fast electrogenic reaction occurs. This is clearly observed in the reconstructed current (B).
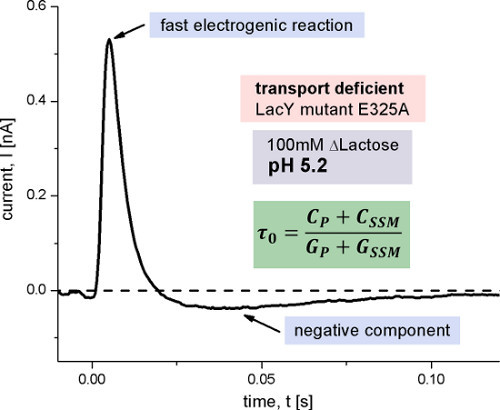 Figure 7. Transient current measured with E325A LacY proteoliposomes after a 100 mM lactose concentration jump at pH 5.2. This LacY variant is inhibited in the proton release step of the transport cycle and therefore transport-deficient. The small negative component observed is characteristic for rapid transient currents measured in capacitively coupled systems and is caused by the discharge of the membrane capacitance after a fast electrogenic reaction. Its time constant π0 is determined by the capacitances and conductances of the system (Figure 1).
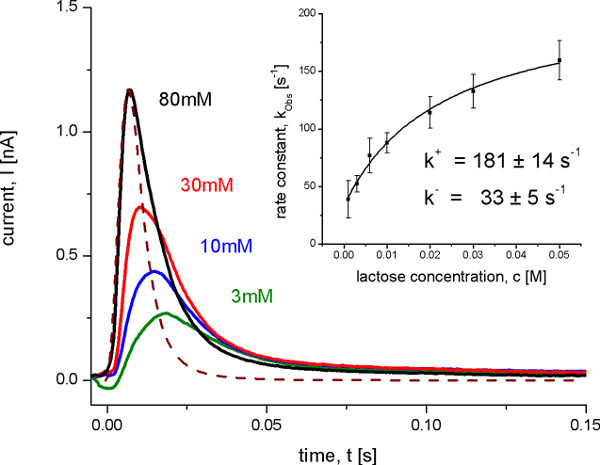 Figure 8. Transient currents measured with wild-type LacY proteoliposomes after different lactose concentration jumps at pH 5.2. Under these conditions no steady state transport is observed, but an electrogenic conformational transition upon lactose binding. The dashed line shows the transfer function representing the time resolution of the system. The inset shows the determination of the on and off rate constants from the observed rate constant kobs with a hyperbolic fit to the data. The observed rate constant was determined from the transient currents with an iterative least-squares deconvolution algorithm 10.
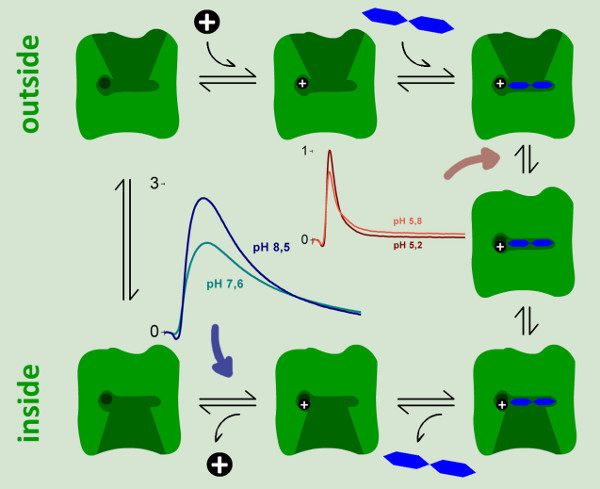 Figure 9. A kinetic model for the reaction cycle of LacY. Two electrogenic steps could be identified and characterized by SSM measurements. A strongly electrogenic reaction representing ~94% of the total charge displacement in the reaction cycle is only observed at neutral and basic pH values. It could be assigned to the proton release step (blue arrow). A weakly electrogenic step is observed at acidic pH when continuous turnover of wild-type LacY is inhibited. We assigned this reaction to an electrogenic conformational transition upon lactose binding, which represents 6% of the total charge displacement in the reaction cycle.
Discussion
1. Advantages of SSM-based electrophysiology compared to conventional methods
SSM-based electrophysiology has proven itself as a valuable tool of the electrophysiological toolbox. It is especially useful in cases where convention electrophysiology, namely patch clamp and voltage clamp methods, cannot be applied: Apart from a few rare exceptions bacterial transporters can not be investigated using voltage clamp or patch clamp methods because of the small size of bacteria and because they are difficult to express in mammalian cells or oocytes. But also physiologically relevant mammalian transporters can be investigated. In this case SSM-based electrophysiology is attractive for transporters from intracellular membranes and for screening applications in drug discovery because of its robustness and its potential for automation.
SSM-basedUsing conventional electrophysiology, time resolved characterization of transporters is challenging. Since the turnover of transporters is low a 'giant patch' or a 'whole cell' configuration is required, which have an inherently low time resolution in a solution exchange experiment. The complication can be overcome using photolytic substrate release. However, only a limited number of substrates are suited for this approach. Here the rapid solution exchange at the SSM offers the unique opportunity to perform electrophysiological studies with a high time resolution using arbitrary substrates.
2. Limitations and critical steps
In contrast to patch clamp and voltage clamp techniques, SSM-based electrophysiology cannot be used to apply a potential. Transporter characterization is therefore restricted to transport modes which do not rely on a membrane potential.
In general, SSM-based electrophysiology has no limitations concerning the type of the (electrogenic) transporter. But voltage clamp or patch clamp methods can have advantages, if intracellular components like binding proteins are required for protein functionality.
Limitations can arise, if solution exchange creates large artifact currents. This happens when the substrate interacts strongly with the SSM like in the case of lipophilic compounds. Artifact controls can be used to correct the measured signals. Moreover high salt background in all measuring buffers can be used to reduce the artifacts. But in cases, where the size of the artifact is comparable to the protein signal, it is almost impossible to isolate the protein related signal from the artifact. Fortunately, high artifacts are unusual in an optimized solution exchange.
There are a few steps which are critical for the successful realization of a SSM-based electrophysiology experiment. The preparation of the protein sample is the most important part. If proteoliposomes are used, be sure the reconstitution process yields a clean, reproducible sample of a sufficient LPR and the transporter is oriented in the correct way. The LPR can be checked by freeze fracture electron microscopy and orientation by an ELISA experiment if antibodies are available.
Only use a SSM which shows optimal parameters for incubating the protein sample. The injection of the protein is another critical step. Sonication is essential and air bubbles should be avoided during the injection. After sample incubation the measurements itself are critical, because air bubbles will remove the adsorbed protein sample from the sensor chip. Therefore always remove air bubbles after changing solutions. Nevertheless a signal rundown can occur. To correct a possible signal rundown, it is essential to accomplish rundown controls during the experiment.
3. Specialized Systems
The SSM-Setup can be modified according to its application. Moreover there are completely different, highly specialized setups available.
There is the possibility to measure protein signals under asymmetrical conditions, e.g. under a pH gradient. To establish asymmetrical buffer compositions inside and outside the proteoliposomes a third solution, the resting solution, has to be introduced and this requires a double exchange configuration. Here an additional three-way valve switching between non-activating and resting solutions is required.
To increase the time resolution of the system we developed an alternative flow pathway lacking the terminal valve, but using a different type of cuvette. Here the junction of activating and non-activating solution is located inside the cuvette, 3 mm in front of the SSM. This setup is well suited for kinetic analysis of fast transport processes. It could be shown that a time resolution as low as 2 msec is possible.
Commercial fully automated systems are available aiming at a significantly higher throughput for drug screening. A movable unit collects solutions and injects them on the sensor surface in 96-well plates in a standard microtiter plate format.
Disclosures
No conflicts of interest declared.
Acknowledgments
We thank J. Garcia-Celma, I Smirnova and R. Kaback for contributions to the LacY measurements and E. Bamberg for support and helpful discussions.
References
- Seifert K, Fendler K, Bamberg E. Charge transport by ion translocating membrane proteins on solid supported membranes. Biophys. J. 1993;64:384–391. doi: 10.1016/S0006-3495(93)81379-1. [DOI] [PMC free article] [PubMed] [Google Scholar]
- Schulz P, Garcia-Celma JJ, Fendler K. SSM-based electrophysiology. Methods. 2008;46:97–103. doi: 10.1016/j.ymeth.2008.07.002. [DOI] [PubMed] [Google Scholar]
- Garcia-Celma JJ, et al. Rapid activation of the melibiose permease MelB immobilized on a solid-supported membrane. Langmuir. 2008;24:8119–8126. doi: 10.1021/la800428h. [DOI] [PubMed] [Google Scholar]
- Mager T, Rimon A, Padan E, Fendler K. Transport mechanism and pH regulation of the Na+/H+ antiporter NhaA from Escherichia coli: an electrophysiological study. J. Biol. Chem. 2011;286:23570–23581. doi: 10.1074/jbc.M111.230235. [DOI] [PMC free article] [PubMed] [Google Scholar]
- Zhou A, et al. Charge translocation during cosubstrate binding in the Na+/proline transporter of E.coli. J. Mol. Biol. 2004;343:931–942. doi: 10.1016/j.jmb.2004.09.002. [DOI] [PubMed] [Google Scholar]
- Ganea C, Fendler K. Bacterial transporters: charge translocation and mechanism. Biochim. Biophys. Acta. 2009;1787:706–713. doi: 10.1016/j.bbabio.2009.02.002. [DOI] [PubMed] [Google Scholar]
- Schulz P, Werner J, Stauber T, Henriksen K, Fendler K. The G215R mutation in the Cl-/H+-antiporter ClC-7 found in ADO II osteopetrosis does not abolish function but causes a severe trafficking defect. PLoS ONE. 2010;5:e12585. doi: 10.1371/journal.pone.0012585. [DOI] [PMC free article] [PubMed] [Google Scholar]
- Schulz P, Dueck B, Mourot A, Hatahet L, Fendler K. Measuring ion channels on solid supported membranes. Biophys. J. 2009;97:388–396. doi: 10.1016/j.bpj.2009.04.022. [DOI] [PMC free article] [PubMed] [Google Scholar]
- Garcia-Celma JJ, Smirnova IN, Kaback HR, Fendler K. Electrophysiological characterization of LacY. Proc. Natl. Acad. Sci. U.S.A. 2009;106:7373–7378. doi: 10.1073/pnas.0902471106. [DOI] [PMC free article] [PubMed] [Google Scholar]
- Garcia-Celma JJ, Ploch J, Smirnova I, Kaback HR, Fendler K. Delineating electrogenic reactions during lactose/H+ symport. Biochemistry. 2010;49:6115–6121. doi: 10.1021/bi100492p. [DOI] [PMC free article] [PubMed] [Google Scholar]


