Abstract
Objective: Chromosome correlation maps display correlations between gene expression patterns on the same chromosome. Our goal was to map the genes on chromosome regions and to identify correlations through their location on chromosome regions.
Materials and Methods: Following microarray analysis we used Ingenuity Pathway Analysis (IPA) to construct gene networks of the co-deregulated genes in bladder cancer. Chromosome mapping, mathematical modeling and data simulations were performed using the WebGestalt and Matlab® softwares.
Results: The top deregulated molecules among 129 bladder cancer samples were implicated in the PI3K/AKT signaling, cell cycle, Myc-mediated apoptosis signaling and ERK5 signaling pathways. Their most prominent molecular and cellular functions were related to cell cycle, cell death, gene expression, molecular transport and cellular growth and proliferation. Chromosome correlation maps allowed us to detect significantly co-expressed genes along the chromosomes. We identified strong correlations among tumors of Tα-grade 1, as well as for those of Tα-grade 2, in chromosomes 1, 2, 3, 7, 12 and 19. Chromosomal domains of gene co-expression were revealed for the normal tissues, as well. The expression data were further simulated, exhibiting an excellent fit (0.7 < R2 < 0.9). The simulations revealed that along the different samples, genes on same chromosomes are expressed in a similar manner.
Conclusions: Gene expression is highly correlated on the chromosome level. Chromosome correlation maps of gene expression signatures can provide further information on gene regulatory mechanisms. Gene expression data can be simulated using polynomial functions.
Keywords: bladder cancer, chromosome correlation maps, molecular networks, mathematical modeling, data simulations
Introduction
Microarray analyses have been applied in the past to examine the differentially expressed (DE) genes in bladder cancer.1–7 However, these findings are not always reproducible, mainly due to improper analysis/validation, insufficient control of false positives, inadequate reporting of methods and small sample size relative to large numbers of potential predictors. We have previously shown that the combination of information from multiple studies can increase the reliability and recognizability of the results, and can lead us to the focus of genes that play a role in the formation of bladder cancer, irrespective of the stage and/or grade of the tumor.
Such high-throughput analyses can provide a system-scale overview of how genes interact with each other in a network context. This network is known as a gene regulatory network and can be defined as a mixed graph over a set of nodes (corresponding to genes or gene activities) with directed or undirected edges (representing causal interactions or associations between gene activities).8,9 As most biological processes arise from the complex interactions among multiple gene products, information about how genes function together can improve our understanding of the underlying biological mechanisms.
Chromosome correlation maps display correlations between the expression patterns of genes on the same chromosome and are considered of major importance in the understanding of gene expression regulation.10,11 Considering that gene expression represents just a “snap shot” of the state-space of the otherwise dynamic behavior of bladder cancer, it would be of major interest to investigate the expression patterns by examining the chromosomal-based gene expression. Chromosomal gene expression is expected to be highly coordinated. However, it has not yet been elucidated based on chromosome correlation whether gene expression among same chromosomes from different samples is governed by similar patterns. If such a common mechanism of gene expression exists, we do not know whether it is of linear or nonlinear nature.
Our goal was to construct networks of the co-deregulated (co-DE) genes in bladder cancer, to unveil the gene correlations among tumor samples and to describe these correlations mathematically in order to perform predictions of gene expression based on the chromosomes.
Results
Networks and canonical pathways
Networks and canonical pathways for the DE genes revealed in Cohort A
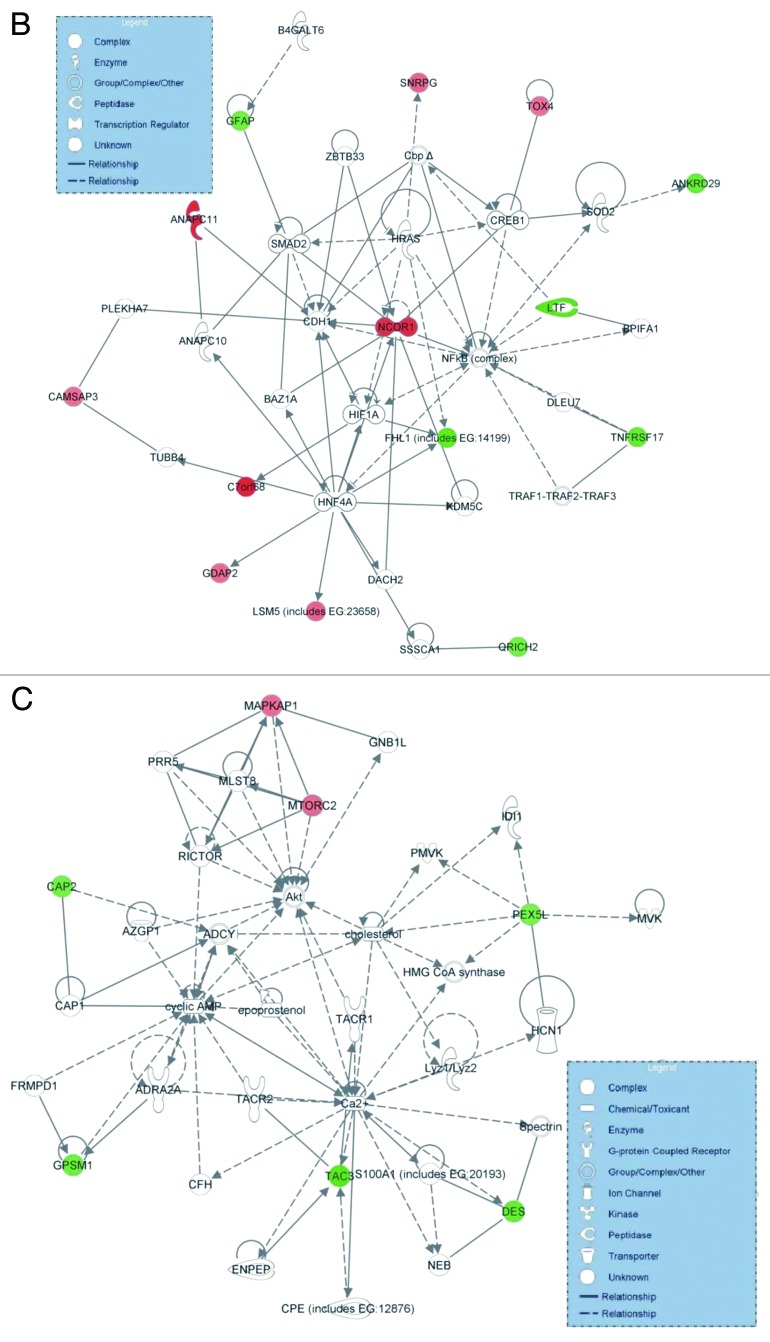
We performed Ingenuity Pathway Analysis (IPA) for 831 co-DE genes among the ten bladder cancers and the five normal tissue samples, in Cohort A. The top canonical pathways were as follows: (1) Systemic Lupus Erythematosus signaling (p = 1.9E-02; ratio = 0.009), containing the genes LSM5 and SNRPG (both upregulated); (2) signaling by Rho family GTPases (p = 2.52E-02; ratio = 0.008), containing the genes DES and GFAP (both downregulated); (3) April-mediated signaling (p = 3.94E-02; ratio = 0.023), containing the gene TNFRSF17 (downregulated); (4) B cell-activating factor signaling (p = 4.15E-02; ratio = 0.022), containing the gene TNFRSF17 (downregulated); and (5) mitotic roles of Polo-like kinase (p = 6.36E-02; ratio = 0.015), containing the gene ANAPC11 (upregulated). Two major gene networks were constructed, with the following associated functions: (1) cell-to-cell signaling and interaction, cellular assembly and organization, cellular function and maintenance (score = 36) and (2) cell signaling, molecular transport and nucleic metabolism (score = 11) (Fig. 1A and 1B and C).
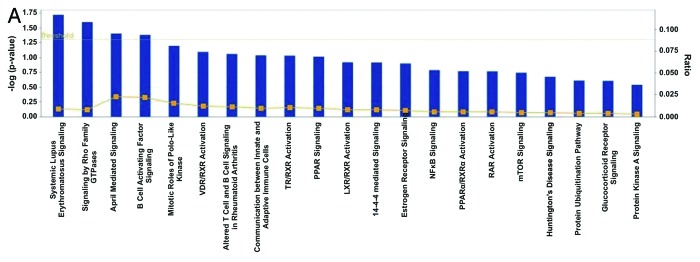
Figure 1A. Ingenuity analysis of the top pathways affected in differentially expressed genes among 10 bladder cancer and five normal tissue samples (Cohort A). Y-axis is an inverse indication of p-value or significance (A). Gene networks involved in “cell-to-cell signaling and interaction, cellular assembly and organization, cellular function and maintenance” (B), and “cell signaling, molecular transport and nucleic metabolism” (C), generated by IPA for differentially expressed genes between bladder cancer and normal tissue. The selected scoring method was Fisher’s exact test p-value. The threshold value was set at p = 0.05. Red symbols are assigned for upregulated and green for downregulated genes. Node shape corresponds to the functional role of molecules as shown in the legend. Direct or indirect interactions are shown by complete or dashed lines.
Figure 1B and C. See Figure 1A legend.
The top molecular and cellular functions were: (1) cell death (p = 1.06E-03 − 2.20E-02; three molecules: LTF, TNFRSF17 and GFAP, all downregulated); (2) cell morphology (p = 1.06E-03 − 2.09E-02; three molecules: LTF, DES and GFAP, downregulated; and NCOR1, upregulated); (3) cellular assembly and organization (p = 1.06E-03 − 4.25E-02; eight molecules: CAMSAP3 and NCOR1, upregulated; and FHL1, DES, CAP2, GFAP, LTF and TNFRSF17, downregulated); (4) cellular compromise (p = 1.06E-03 − 2.11E-03; DES, downregulated) and (5) cellular function and maintenance (p = 1.06E-03 − 4.25E-02; seven molecules: CAMSAP3, upregulated; and GFAP, CAP2, DES, LTF, PEX5L and FHL1, downregulated).
The top upregulated molecules were: C7orf68, ANAPC11, NCOR1, LSM5, SNRPG, GDAP2, MAPKAP1, TOX4 and CAMSAP3, whereas the top downregulated molecules were TAC3, LTF, ODZ2, FHL1, TNFRSF17, DES, ANKRD29, GPSM1, QRICH2 and GFAP (Table 1). The top upstream regulators were as follows: KDM4A (targeting FHL1), RNF112 (targeting TAC3), ALX3 (targeting GFAP), SOX11 (targeting C7orf68) and OLIG2 (targeting GFAP) (p = 1.06E-03 − 5.27E-03).
Table 1. Top deregulated molecules in cohort A: 10 bladder cancer and five normal tissue samples, as identified by IPA.
| Upregulated molecules in bladder cancer vs. normal tissue | Exp. value (fold change) |
|---|---|
| C7orf68 |
2.633 |
| ANAPC11 |
2.562 |
| NCOR1 |
2.433 |
| LSM5 (includes EG:23658) |
1.720 |
| SNRPG |
1.705 |
| GDAP2 |
1.635 |
| MAPKAP1 |
1.624 |
| TOX4 |
1.580 |
| CAMSAP3 |
1.570 |
| EPAS1 | 0.489 |
| Downregulated molecules in bladder cancer vs. normal tissue | Exp. value (fold change) |
|---|---|
| TAC3 |
−2.518 |
| LTF |
−2.464 |
| ODZ2 |
−2.438 |
| FHL1 (includes EG:14199) |
−2.315 |
| TNFRSF17 |
−2.065 |
| DES |
−2.015 |
| ANKRD29 |
−1.937 |
| GPSM1 |
−1.789 |
| QRICH2 |
−1.739 |
| GFAP | −1.737 |
Networks and canonical pathways for the DE genes revealed in Cohort B
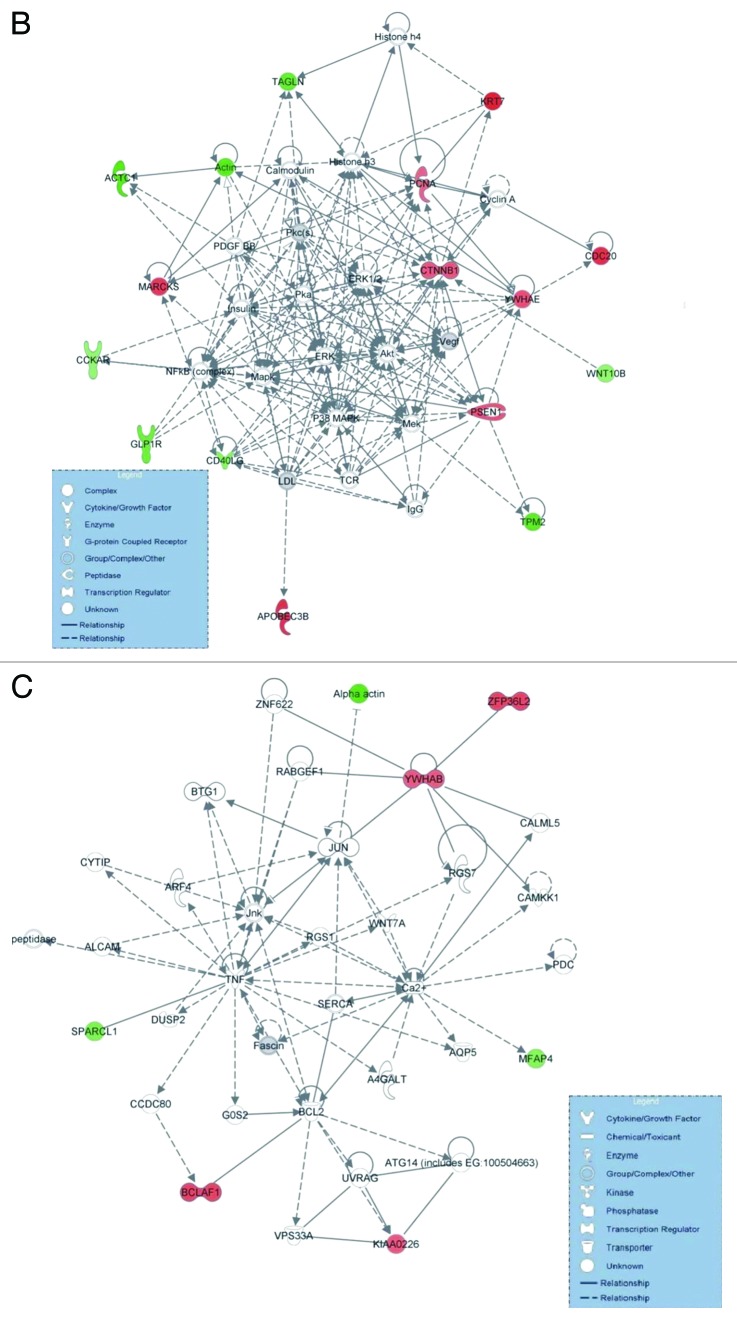
Similarly, we performed IPA for the 458 co-DE genes among the 129 bladder cancers and the 17 normal tissue samples in Cohort B. The top canonical pathways were as follows: (1) PI3K/AKT signaling (p = 3.7E-04; ratio = 0.021), containing the genes CTNNB1, YWHAB and YWHAE (all upregulated); (2) cell cycle: G2/M DNA damage checkpoint regulation (p = 1.25E-03; ratio = 0.041), containing the genes, YWHAB and YWHAE (both upregulated); (3) Myc-mediated apoptosis signaling (p = 2.24E-03; ratio = 0.033), containing the genes YWHAB and YWHAE (both upregulated); (4) ERK5 signaling (p = 2.47E-03; ratio = 0.031), containing the genes YWHAB and YWHAE (both upregulated); and (5) basal cell carcinoma signaling (p = 3.14E-03; ratio = 0.027), containing the genes CTNNB1 (upregulated) and WNT10B (downregulated) (Figs. 2A and 2B and C).
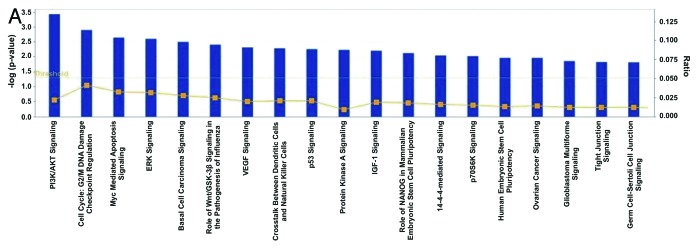
Figure 2A. Ingenuity analysis of the top pathways affected in differentially expressed genes among 129 bladder cancer and 17 normal tissue samples (Cohort B). Y-axis is an inverse indication of p-value or significance. (A). Gene networks involved in “cell cycle, gene expression and cell death” (B), and “cell morphology, cellular function and maintenance and cell death” (C), generated by IPA for differentially expressed genes between bladder cancer and normal tissue. The selected scoring method was Fisher’s exact teast p-value. The threshold value was set at p = 0.05. Red symbols are assigned for upregulated and green for downregulated genes. Node shape corresponds to the functional role of molecules as shown in the legend. Direct or indirect interactions are shown by complete or dashed lines.
Figure 2B and C. See Figure 2A legend.
The top molecular and cellular functions were: (1) cell cycle (p = 1.66E-07 − 1.54E-02; 11 molecules: CDC20, CTNNB1, MARCKS, PCNA, PSEN1, KRT7, YWHAE, YWHAB, upregulated; and CD40LG, TPM2, WNT10B, downregulated); (2) cell death (p = 1.79E-05 − 1.95E-02; 12 molecules: BCLAF1, CDC20, CTNNB1, PCNA, CTNNB1, PSEN1, YWHAE, YWHAB, upregulated; and ACTC1, CD40LG, GLP1R, downregulated); (3) gene expression (p = 2.65E-05 − 1.54E-02; 12 molecules: BCLAF1, CTNNB1, KRT7, PCNA, PSEN1, YWHAB, YWHAE, BCLAF1, ZFP, upregulated; and CD40LG, GLP1R, TAGLN, WNT10B, downregulated); (4) molecular transport (p = 4.18E-05 − 1.55E-02; seven molecules: PSEN1, YWHAB, YWHAE, PCNA, MARCKS, upregulated; and CCKAR, GLP1R, downregulated); and (5) cellular growth and proliferation (p = 1.83E-04 − 1.90E-02; nine molecules: CTNNB1, PSEN1, CDC20 and PCNA, upregulated; and CD40LG, TPM2, GLP1R, WNT10B, downregulated).
The top upregulated molecules were KRT7, APOBEC3B, CDC20, MARCKS, BCLAF1, ZFP36L2, YWHAE, PSEN1, CTNNB1 and YWHAB, whereas the top downregulated molecules were ACTC1, TPM2, TAGLN, GLP1R, SPARCL1, MFAP4, CDC40LG, WNT10B, CCKAR and HES1 (Table 2). The top transcription factors were as follows: MKL1 (targeting ACTC1, TAGLN and TPM2), KLF5 (targeting ACTC1, TAGLN and TPM2), SMAD3 (targeting GFAP), HTT (targeting CTNNB1, PCNA, TAGLN and TPM2) and FOXA1 (targeting ACTC1, TAGLN and TPM2) (p = 1.66E-06 − 1.06E-04).
Table 2. Top deregulated molecules, in cohort B: 129 bladder cancer and 17 normal tissue samples, as identified by IPA.
| Upregulated molecules in bladder cancer vs. normal tissue | Exp. value (fold change) |
|---|---|
| KRT7 |
2.267 |
| APOBEC3B |
2.030 |
| CDC20 |
2.024 |
| MARCKS |
1.882 |
| BCLAF1 |
1.775 |
| ZFP36L2 |
1.768 |
| YWHAE |
1.655 |
| PSEN1 |
1.647 |
| CTNNB1 |
1.577 |
| YWHAB | 1.552 |
| Downregulated molecules in bladder cancer vs. normal tissue | Exp. value (fold change) |
|---|---|
| ACTC1 |
−3.188 |
| TPM2 |
−2.694 |
| TAGLN |
−2.504 |
| GLP1R |
−2.248 |
| SPARCL1 |
−1.914 |
| MFAP4 |
−1.755 |
| CD40LG |
−1.721 |
| WNT10B |
−1.504 |
| CCKAR |
−1.502 |
| HES1 (includes EG:15205) | −0.776 |
Analysis of the co-deregulated genes in Cohort B
Comparison between all tumor and control samples
We did not detect any correlation between tumor and control samples. Interestingly, on chromosome 1, the mean value of the DE genes was positive, indicating that they are all upregulated. CDC20, whose upregulation in bladder cancer has previously been reported,7 appeared to be the most interesting. Moreover, GPREL1 on chromosome 4 and HCCS on chromosome X were the most active genes among all tumor samples (Fig. S1). Similarly, we compared all the control and tumor samples. Once again, CDC20 appeared to be upregulated in bladder cancer, thus strengthening its significant implication in the disease. An interesting gene expression pattern was revealed on chromosomes 11, 13, 18, 21 and 22 (Fig. S2). All genes were upregulated on average, indicating that for these chromosomes, their respective genes are the most active in all tumor samples examined.
Comparison between Tα-grade 1 tumors and control samples
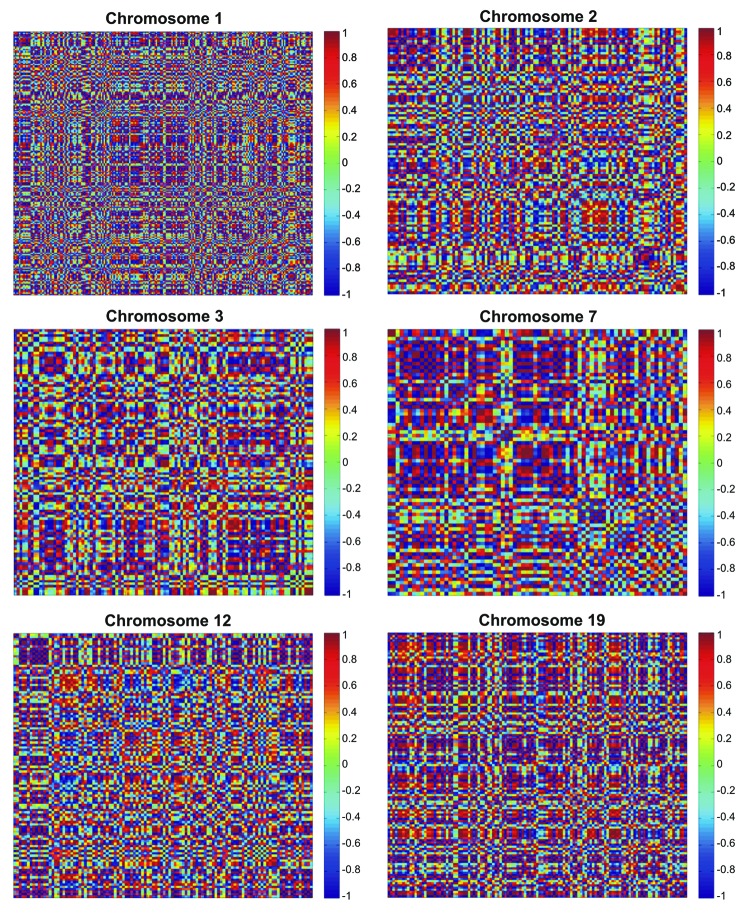
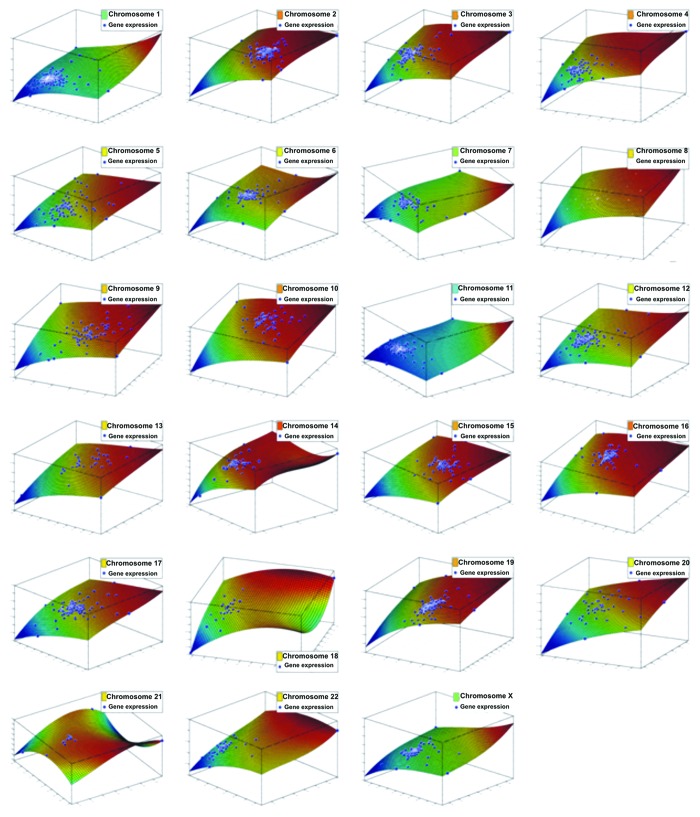
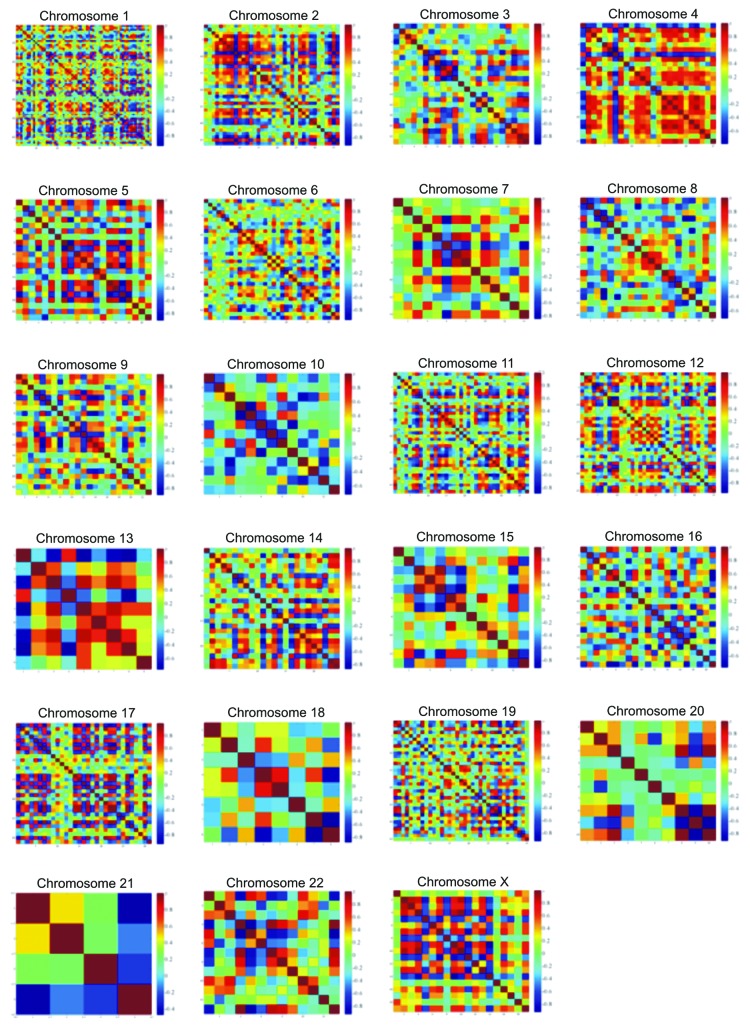
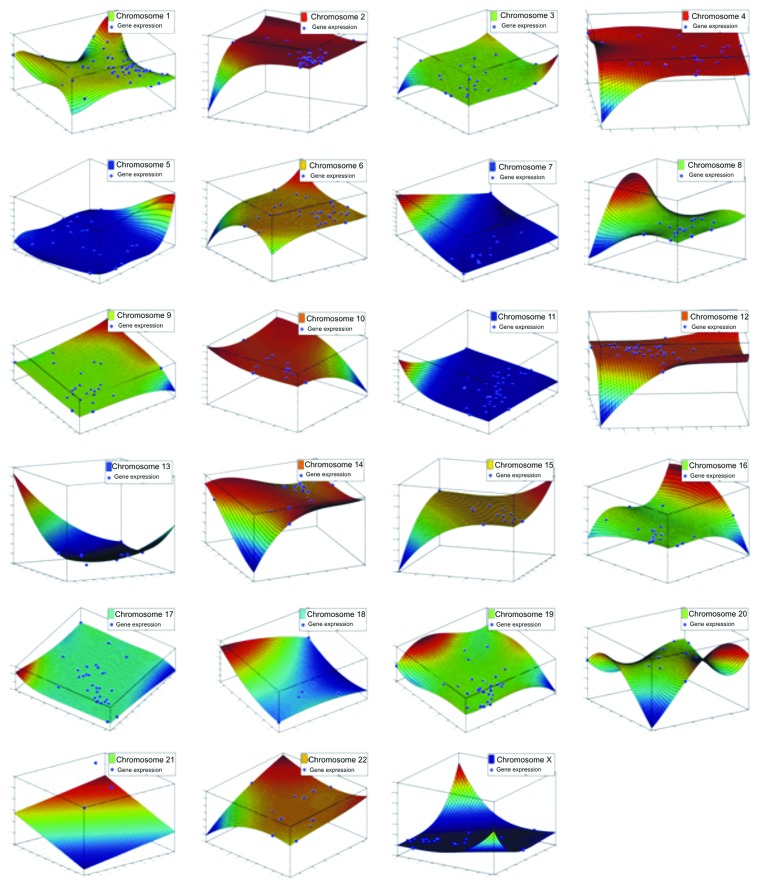
Chromosome correlation maps for Tα-grade 1 tumors revealed co-expressed gene patterns along various chromosomes (Fig. 3). Since correlation does not necessarily mean causation, we further searched for possible ways that would describe these patterns of expression. Indeed, these patterns could be described with third degree polynomials, and all simulations manifested an excellent fitting (R2 > 0.99). This was a hint that in this tumor sample, gene expression is highly conserved and related to the nature of the tumor, irrespective of the genes. It was also interesting as the DE genes were randomly selected, since they were produced through a filtering procedure from a t-test. The simulation showed that among different samples, genes on the same chromosome are expressed in a similar manner. Simulation results for all chromosomes are presented in Figure 4.
Figure 3. Chromosome correlation maps of the DE genes between Tα-grade 1 tumors and control samples, on chromosomes 1, 2, 3, 7, 12 and 19. The X and Y axes represent the individual genes that were differentially expressed between control and Ta-grade 1 tumors.
Figure 4. Simulations of the DE genes with respect to their chromosome location, among Tα-grade 1 tumors and control samples. Each chromosome is presented separately. All genes could be simulated with a third-degree polynomial and R2 > 0.99. Axes represent gene expression values of the log2 ratio of the Ta-grade 1 tumors over control samples, where each axis represents one sample from the tumor subtype (Ta-grade 1 tumor group consisted of three samples).
Comparison between Tα-grade 2 tumors and control samples
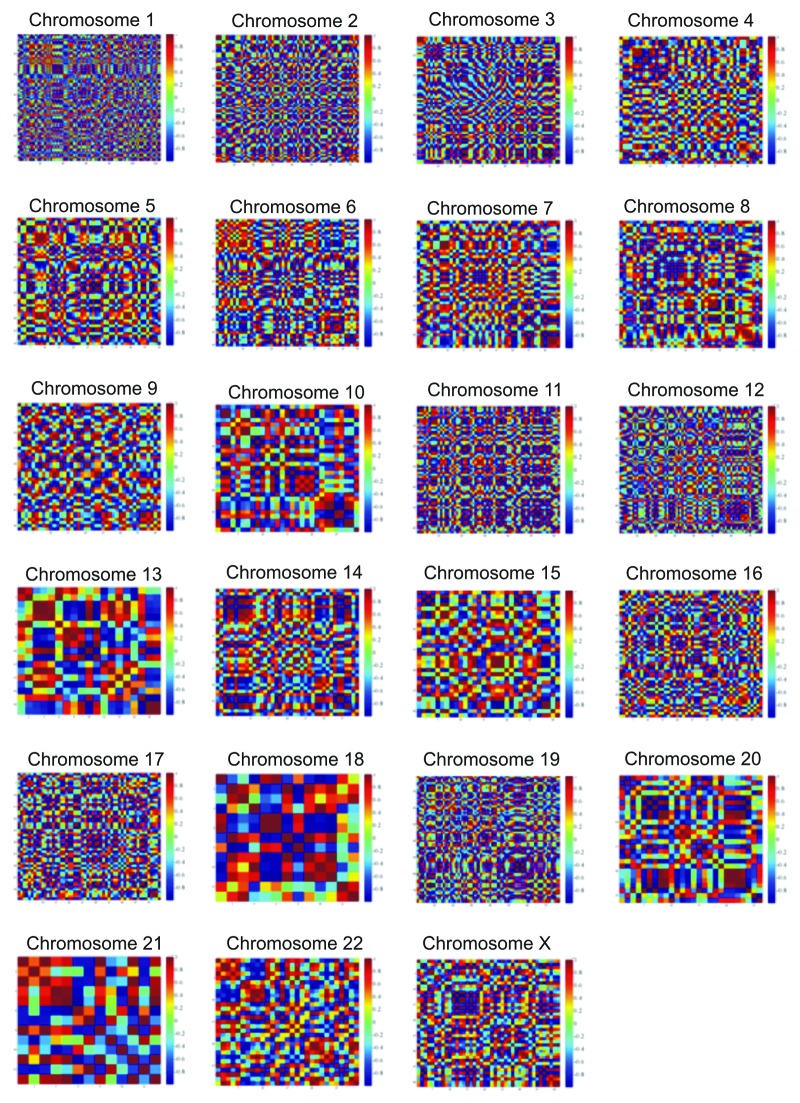
There was a mixture of correlation profiles in Tα-grade 2 tumors. In the case of Tα-grade 1 tumors, we observed a plethora of correlations with rho > 0.9 and p < 0.05. Due to the small sample number (n = 3), we assumed that fitting, simulation and correlations were close to the ideal. Therefore, in the case of the Tα-grade 2 group, chromosome correlation maps were also built in order to allow the visualization of co-expressed genes along the chromosomes (Fig. 5). Simulating gene expression with respect to chromosome location did not give straightforward results, as in the case of the Tα-grade 1 tumor group. Polynomial approximations were used, and the R2 values ranged between 0.7 and 0.91. However, it appeared that they could be simulated with polynomials despite the difficulty to find the most suitable function for the data. This indicates that chromosome-based gene expression is a quasi-linear problem, possibly of a nonlinear nature. The results of the simulations are presented in Figure 6.
Figure 5. Chromosome correlation maps for Tα-grade 2 tumors allow visualization of co-expressed genes along all chromosomes.
Figure 6. Simulations of the DE genes with respect to their chromosome location, among Tα-grade 2 tumors and control samples. Each chromosome is presented separately. All genes could be simulated with a third degree polynomial and R2 > 0.99. Axes represent gene expression values of the log2 ratio of the Ta-grade 2 tumors over control samples, where each axis represents one sample from the tumor subtype. Ta-grade 2 consisted of 12 samples in total. The figure includes representative fittings of the samples GSM2526_Ta gr2, GSM2536_Ta gr2 and GSM2507_Ta gr2 for each chromosome respectively.
Comparison between Tα-grade 3 tumors and control samples
Similarly, chromosome correlation maps were constructed for Tα-grade 3 tumors in order to allow visualization of co-expressed genes along the chromosomes (data not shown due to space limitations).
Comparison between T1-grade 2 tumors and control samples
As also expected in the present case, gene expression was highly correlated (Fig. 7). Similarly, simulation of the data showed that they could be fitted easily, as was also the case of the Tα-grade 1 samples (data not shown due to space limitations).
Figure 7. Chromosome correlation maps for T1-grade 2 tumors allow visualization of co-expressed genes along all chromosomes. The X and Y axes represent the individual genes that were differentially expressed between control samples and T1-grade 2 tumors.
Comparison between T1-grade 3 tumors and control samples
Chromosome correlation maps for T1-grade 3 tumors did not exhibit highly co-expressed genes along the chromosomes. The data were not further investigated.
Comparison between T1-grade 2/3 tumors and control samples
Chromosome correlation maps for T1-grade 2 and T1-grade 3 tumors also revealed highly co-expressed gene patterns along the chromosomes (data not shown due to space limitations). Similarly, data simulation showed a high ability for fitting, as was also the case of the Tα-grade 1 and T1-grade 2 tumor samples (data not shown).
No further correlation could be identified in the chromosome correlation maps for the following tumor comparisons: comparison between T1-grade 2/3/4 tumors and control samples; comparison between group A tumors and control samples; comparison between group B tumors and control; comparison between group C tumors and control samples; and comparison between metastatic tumors and control samples.
Comparison among all control samples
We further investigated the existence of correlations separately among tumor and control samples. Interestingly, the control samples exhibited correlations on certain chromosomes, such as chromosomes 2, 4, 5, 7, 10, 13, 15 and 17 (Fig. S3). Based on the observed correlations, we attempted to fit our data in order to discover patterns of gene expression. If a simulation existed, it should be true for all the samples in specific chromosomes. For this purpose, we calculated the mean values of each sample for all genes and for each chromosome. Surface fittings were selected based on their R2 value, which should be > 0.9. This finding was interesting, as it hinted toward an expression pattern in the physiological samples, pointing out that gene expression is indeed highly correlated in cells (Fig. S4).
Comparison between all tumors and control samples
The above results suggest a need for a different approach when it comes to analyzing these data. Since gene expression is multidimensional, taking into account that we have 22 chromosomes and two sex chromosomes, the analysis should take place for each one of them. Supposed that we have k samples with j genes each and c = 22 + 2 chromosomes, the gene expression x would be defined as: xk,j,c. Thus, we need three variables in order to describe the expression of a gene. This leads to the formation of a 3D matrix of the form m × n × p. Yet, such a matrix is a multidimensional structure that cannot be easily visualized. In the present case, in order to visualize gene expression in such a way that would give meaningful interpretation of chromosome-based gene expression, we created this 3D structure. In order to simplify this structure, we isolated 2D matrices of genes vs. samples with constant chromosomes, and genes vs. chromosomes with constant samples. The second problem that we encountered was how to further reduce the complexity of the data and find similarities between gene expression values with respect to chromosomes. 3D visualizations of the initial data were too complex to analyze and to obtain patterns of gene expression. The answer to this question came from the utilization of k-means clustering. K-means classifies gene expressions, based on similarities. Thus, if genes are sorted with respect to chromosomes, then possible patterns could be revealed using the k-means algorithm. In Figure S5, the result of the k-means clustering is presented as implemented for the genes vs. the samples with constant chromosome location. These results were further fitted using Fourier series (Eqn. 3). The result for chromosome 1 is presented in Figure S6. We further analyzed the data by calculating the confidence intervals at the 95% level, the first and second derivatives, as well as the integral of the fitted data. An interesting observation was that the derivatives of the fitted data manifested oscillatory behavior. In addition, we present the results of our analysis for chromosome X in Figure S7. All remaining chromosomes were analyzed accordingly (data not shown due to space limitations).
Our analysis proceeded with the consideration of chromosomes vs. gene expression. Similarly, we performed k-means clustering analysis (Fig. S8) for the first 10 samples. The remaining 130 samples were clustered accordingly. Simulations of this dimension of the cube were succeeded with Fourier series as mentioned in the “Materials and Methods” section and Equation 3. The result is presented in Figure S9 with indicative diagrams of our analysis. The cubical matrix that was implemented is a very complex structure, which eventually manifests nonlinear dynamics with respect to gene expression.
Gene ontology (GO) enrichment analysis
Gene expression was further investigated using GO enrichment. Function distribution along chromosomes is presented in Figure S10. Chromosome 5 presented more functions compared with the other chromosomes. GO enrichment was not proportional to the chromosome size, since the largest chromosome 1 presented 35 significant functions. All the significant gene functions per chromosome are presented in Table 3.
Table 3. Selected GO terms of chromosomal-based gene expression.
| GO analysis | ||
|---|---|---|
|
ID |
Name |
p-value (Adj) |
| |
chromosome 1 |
|
| GO:0060669 |
embryonic placenta morphogenesis |
0.0045 |
| GO:0005839 |
proteasome core complex |
0.0014 |
| GO:0005031 |
tumor necrosis factor receptor activity |
0.0067 |
| |
chromosome 2 |
|
| GO:0009952 |
anterior/posterior pattern formation |
0.0018 |
| GO:0007350 |
blastoderm segmentation |
0.0064 |
| GO:0048468 |
cell development |
0.0071 |
| GO:0048562 |
embryonic organ morphogenesis |
0.0025 |
| GO:0048706 |
embryonic skeletal system development |
0.0062 |
| GO:0005152 |
interleukin-1 receptor antagonist activity |
0.0052 |
| GO:0004918 |
interleukin-8 receptor activity |
0.0052 |
| |
chromosome 3 |
|
| GO:0016493 |
C-C chemokine receptor activity |
4.71E-05 |
| GO:0071425 |
hemopoietic stem cell proliferation |
0.0043 |
| |
chromosome 4 |
|
| GO:0001525 |
Angiogenesis |
0.0052 |
| GO:0008009 |
chemokine activity |
2.99E-07 |
| GO:0008083 |
growth factor activity |
0.0008 |
| GO:0005134 |
interleukin-2 receptor binding |
0.0059 |
| GO:0051781 |
positive regulation of cell division |
0.0001 |
| GO:0045741 |
positive regulation of epidermal growth factor receptor activity |
0.0008 |
| GO:0050729 |
positive regulation of inflammatory response |
0.0027 |
| GO:0045410 |
positive regulation of interleukin-6 biosynthetic process |
0.0003 |
| GO:0045840 |
positive regulation of mitosis |
0.0061 |
| GO:0034105 |
positive regulation of tissue remodeling |
0.0087 |
| GO:0008202 |
steroid metabolic process |
0.0065 |
| |
chromosome 5 |
|
| GO:0042977 |
activation of JAK2 kinase activity |
0.0010 |
| GO:0035240 |
dopamine binding |
0.0020 |
| GO:0008083 |
growth factor activity |
0.0048 |
| GO:0070851 |
growth factor receptor binding |
0.0056 |
| GO:0005138 |
interleukin-6 receptor binding |
0.0068 |
| GO:0004923 |
leukemia inhibitory factor receptor activity |
0.0023 |
| |
chromosome 6 |
|
| GO:0060333 |
interferon-gamma-mediated signaling pathway |
1.78E-09 |
| GO:0046415 |
urate metabolic process |
0.0094 |
| GO:0001570 |
vasculogenesis |
0.0089 |
| |
chromosome 7 |
|
| GO:0035425 |
autocrine signaling |
0.0022 |
| GO:0060571 |
morphogenesis of an epithelial fold |
0.0072 |
| GO:0045765 |
regulation of angiogenesis |
0.0038 |
| |
chromosome 9 |
|
| GO:0005125 |
cytokine activity |
4.39E-05 |
| |
chromosome 10 |
|
| GO:0005739 |
mitochondrion |
0.0096 |
| GO:0016055 |
Wnt receptor signaling pathway |
0.0078 |
| |
chromosome 12 |
|
| GO:0031076 |
embryonic camera-type eye development |
0.0071 |
| GO:0048048 |
embryonic eye morphogenesis |
0.0051 |
| |
chromosome 16 |
|
| GO:0006264 |
mitochondrial DNA replication |
0.0068 |
| GO:0005759 |
mitochondrial matrix |
0.0060 |
| GO:0010834 |
telomere maintenance via telomere shortening |
0.0068 |
| |
chromosome 17 |
|
| GO:0008009 |
chemokine activity |
5.09E-05 |
| |
chromosome 21 |
|
| GO:0004904 |
interferon receptor activity |
0.0004 |
| |
chromosome 22 |
|
| GO:0004707 |
MAP kinase activity |
0.0007 |
| |
chromosome X |
|
| GO:0004896 | cytokine receptor activity | 0.0055 |
The terms were considered significant if they obtained an adjusted p-value < 0.01
Discussion
Several studies have focused on the expression profiling of bladder cancer using microarrays.12-21 In the present study, the bladder cancer cases were carefully selected in order to obtain at least one pair from each of the following groups: T1-grade 2, T1-grade 3 and T2/T3-grade 3. Furthermore, in our pooled microarray analysis, a wide range of data from publicly available microarray data sets was included, increasing the total number to 129 bladder cancer and 17 control samples. Statistical analysis results were obtained from our previous works,7, 35 and the same collection of genes was used. All conclusions and further analyses were based on the differential gene expression reported. The main difference is that this same data set was further divided according to the chromosomal location of each identified gene.
We performed IPA for two separate cohorts (A and B) and constructed chromosome correlation maps for all bladder tumors in order to visualize co-deregulated genes along the chromosomes. Network analysis manifested two distinct signaling pathways, the glucocorticoid receptor (GR) and NFκB signaling pathway. These pathways are known to be antagonistic, since the second is responsible for the inflammatory response while the first for the anti-inflammatory one.22 It has been reported that tumors of the urinary tract are not considered to be hormone-dependent, yet it has been shown that nuclear receptors participate in urinary tumor ontogenesis.23 Also, there are no reports connecting bladder cancer to NFκB. The finding that genes that possibly participate in the progression of the tumor are related to the NFκB signaling pathway is presented for the first time.
The mean value of the DE genes in tumor groups vs. control samples on chromosome 1 was positive, implying that these genes are upregulated. The most interesting case, however, was the appearance of CDC20, also previously reported to be significantly overexpressed in bladder cancer.7 Also, GPREL1 (chromosome 4) and HCCS (chromosome X) were the most active genes among all tumor samples. CDC20 has been previously reported to act as a potent TP53 target and is a putative therapeutic target gene.24
Significantly co-expressed genes along chromosomes 1, 2, 3, 7, 12 and 19 appeared among the tumor subgroups with respect to the control samples. To our knowledge, this is the first report that indicates such gene expression correlations in bladder cancer. Since this was a first indication of gene regulatory mechanism, we wished to ascertain whether gene expression could be simulated. It is known that the existence of correlation (gene co-expression) does not automatically mean causation. This was confirmed to be true by successful simulation. Interestingly, when we separated the genes based on their chromosome location, they could be fitted with a third-degree polynomial, hinting toward the existence of linear correlation regulatory mechanisms. This suggests that gene expression falls into a conserved mechanism of expression. The simulation revealed that among different tumor samples, the genes on the same chromosomes were expressed in a similar manner.
Likewise, we constructed chromosome correlation maps for the Tα-grade 2 tumors and found that chromosome-based gene expression manifested diverse correlation patterns. Thus, it was not a strong indication of correlation in this type of tumor. As in the case of Tα-grade 1 tumors, expression data simulation also showed an excellent fit (0.7 < R2 < 0.9). These two cases suggest that correlation possibly also meant causation for these tumor types.
Next, we constructed chromosome correlation maps for the control samples alone in order to examine whether the correlations had to do only with relative ratios of tumors vs. the controls. Our analysis revealed chromosomal domains of gene co-expression for the control samples as well. Fitting attempts also showed that gene expression data could be simulated using polynomial functions, and again correlation hinted toward causation in normal tissue samples. To the best of our knowledge, this is the first time that microarray data are analyzed in such a way.
Despite the interesting type of mechanisms observed so far, especially in Tα-grade 1 and Tα-grade 2 tumors, we still wished to investigate whether such correlations appeared due to the small sample size that was used in the simulation procedures. Therefore, the next step was to perform the analysis in the complete sample size, in an attempt to gain insight into the whole picture of chromosome-based gene expression. For this purpose, we created the “gene cube.” The idea was that similarly regulated genes should manifest similar dynamics. Interestingly, it appeared that experimental data could be fitted with transformations, indicating that there are, at least in part, linear dynamics governing simplifications of the system described. New findings of molecular markers have been reported in the past in similar studies, using bioinformatics tools to identify gene expression signatures.25,26 Thus the dynamics of chromosomal gene expression is of high significance in tumor biology. From our analysis, it was evident that gene expression has partly linear dynamics.
Genes on chromosomes 1 and 12 manifested functions related to embryonic development. The role of developmental genes in urothelial carcinomas was also previously reported.23,27 In particular, the genes related to this function were IL10 and VCAM1. VCAM1 has been reported to be upregulated in bladder carcinomas.28 On the other hand, genes on chromosome 12 were LRP6, WNT1 and WNT10B. There are no reports linking LRP6, WNT1 and WNT10B with bladder cancer. Genes on chromosome 10 were related to the WNT receptor signaling pathway (BAMBI, BTRC, DKK1, FBXW4, FRAT1, FRAT2, FZD8, HHEX, LDB1, SFRP5, TCF7L2 and WNT8B). BAMBI has been linked with high-grade bladder carcinomas through epigenetic silencing.29 Also, TCF7L2 has been reported to play a role in the WNT signaling pathway, where its inhibition seems to lead to G1 arrest and growth inhibition of the bladder cancer. Genes on chromosome 4 and 9 participated in chemokine regulation. In particular, on chromosome 4, a large CXCL family is represented, including CXCL10, CXCL11, CXCL13, CXCL3, CXCL5, CXCL6, CXCL9 and IL8, PF4 and PPBP. The CXCL family of chemokines has been reported to participate in the microenvironment of bladder carcinoma.30 IL8 has also been reported to participate in bladder cancer.31 GHR, IL12B and PRLR on chromosome 5 presented functions related to JAK2 kinase activity. So far, there are no reports connecting these genes with bladder tumors. Yet, it has been reported that the JAK/STAT participates in the inflammatory mechanisms of urinary bladder, relating it to the oncogenetic mechanisms of the disease.32 Finally, on chromosome 22, MAPK1, MAPK11 and MAPK12 participate in the MAPK pathway. Interestingly, it has been reported that the inhibition of MAPK and NFκB signaling pathways inhibits growth and induces apoptosis of bladder tumor cells.33,34
Our data support the hypothesis that gene expression signatures can provide further information on gene regulatory mechanisms, based on chromosomal correlations of gene expression. The “Gene Cube” proved that gene expression has partly linear dynamics. Future research should focus on the investigation of these correlations in gene expression.
Materials and Methods
Strategy of the study
In the first part, we performed microarray experimentation as previously described in detail7,35 (Cohort A). The tumor samples were divided into three groups, as follows: T1-grade 2, T1-grade 3 and T2/T3-grade 3. All raw microarray data were MIAME compliant and uploaded on the GEO database (GSE27448).7 The study was approved by the institutional review board of the University of Crete. For further data analysis, the Matlab® software was used.
In the second part, we extracted raw microarray expression data from 4 GEO data sets: (1) GSE8913; (2) GSE316714; (3) GSE747636; (4) GSE12630,37 and incorporated them in our analysis, as previously described in detail.7 All microarray data were background corrected and cross-normalized using a quantile algorithm.38-40 In total, our pooled microarray analysis comprised 17 normal tissues and 129 bladder cancer samples (Cohort B).
All samples used from each data set with their respective GSM accession number, and detailed information regarding each sample’s tumor type has been previously described in detail.7
Network analysis
The co-deregulated genes among bladder cancer samples were investigated for network interrelation using the Ingenuity Pathways Analysis (IPA) software (www.ingenuity.com). The DE genes between cancer and normal tissue were used to generate a set of networks with a maximum network size of 35 genes/proteins. The median log2 fold change value was used for analysis.
Microarray data statistics
First, we compared all the bladder cancer vs. all the normal tissue samples, entailing all bias by comparing them as unified groups. This analysis provided us with the co-DE genes. Second, we separated the 129 bladder cancer samples into 11 groups: (1) Tα-grade 1 tumors vs. controls; (2) Tα-grade 2 tumors vs. controls; (3) Tα-grade 3 tumors vs. controls; (4) T1-grade 2 tumors vs. controls; (5) T1-grade 3 tumors vs. controls; (6) T1-grade 2 and T1-grade 3 tumors vs. controls; (7) T1-grade 2, T1-grade 3 and T1-grade 4 tumors vs. controls; (8) group A15 vs. controls; (9) group B15 vs. controls; (10) group C15 vs. controls; (11) metastatic tumors vs. controls. Each group was compared against all control samples. The false discovery rate (FDR) was 8.6% for p < 0.05, calculated as previously described.41-43
Cluster analysis
K-means clustering with squared Euclidean as a metric distance was used to partition the gene expression profiles throughout the experimental setups.44 The procedure was repeated 100 times, each with a new set of initial cluster centroid positions. The predictive power of the k-means algorithm was estimated using a figure of merit (FOM).45 A FOM value vs. number of clusters was computed by removing each sample in turn from the data set, clustering genes based on the remaining data and calculating the fit of the withheld sample to the clustering pattern obtained from the other samples.
Chromosome mapping and linear correlations
Since consecutive genes are often similarly expressed, we mapped the genes on chromosome regions and identified their correlations through their chromosomal location.10 The Gene Ontology Tree Machine, WebGestalt web-tool (Vanderbilt University, The Netherlands, http://bioinfo.vanderbilt.edu/gotm/)46 and the Matlab® (The Mathworks Inc.) computing environments were used. Linear correlations were calculated using Pearson’s correlation coefficient. The value R2 > 0.9 was set as a threshold for statistical significance.
Gene ontology (GO) enrichment
GO analysis was applied to highlight the different functionalities among the experimental setups. For each chromosomal gene set formed, statistical analysis of GO term overrepresentation was performed against the common gene set, which was utilized as a reference set.47,48 The chosen approach was the parent-child-union method.49 Overrepresentation analysis (ORA) was performed with the publicly available Ontologizer 2.0 tool50 using GO terms definitions and associations between genes and GO downloaded from the Gene Ontology consortium.51 The threshold for statistical significance was set to < 0.01 using Bonferroni correction.
Mathematical modeling and simulations
Simulations were performed using Matlab®. For fitting purposes we used polynomial equations for 2D (Eqn. 1) and for 3D (Eqn. 2):
Equation 1:
 |
Equation 2:
 |
Fourier series model as in Equation 3:
 |
Sum of sin functions as in Equation 4:
 |
Fitting algorithm finds the coefficients of a polynomial f(x) of degree n that fits the data, f[x(i)] to y(i), in a least squares sense. The result p is a row vector of length n+1 containing the polynomial coefficients in descending powers as shown in Equations 1 and 2.
On the other hand the Fourier series is a sum of sine and cosine functions that describes a periodic signal (Eqn. 3). It is represented in either the trigonometric form or the exponential form. The algorithm used in the present work used the trigonometric Fourier series form, where a0 models a constant (intercept) term in the data and is associated with the i = 0 cosine term, w is the fundamental frequency of the signal, n is the number of terms (harmonics) in the series, and 1 ≤ n ≤ 8.
Supplementary Material
Disclosure of Potential Conflicts of Interest
No potential conflicts of interest were disclosed.
Author Contributions
G.I.L., A.Z. designed and supervised the study, performed the experimental procedures and data interpretation. A.Z. and G.I.L. prepared and submitted the manuscript. M.A., D.D., D.A. and S.V. read and approved the manuscript.
Supplemental Materials
Supplemental materials may be found here: www.landesbiosicence.com/journals/cc/article/24673
Footnotes
Previously published online: www.landesbioscience.com/journals/cc/article/24673
References
- 1.Alizadeh AA, Eisen MB, Davis RE, Ma C, Lossos IS, Rosenwald A, et al. Distinct types of diffuse large B-cell lymphoma identified by gene expression profiling. Nature. 2000;403:503–11. doi: 10.1038/35000501. [DOI] [PubMed] [Google Scholar]
- 2.Golub TR, Slonim DK, Tamayo P, Huard C, Gaasenbeek M, Mesirov JP, et al. Molecular classification of cancer: class discovery and class prediction by gene expression monitoring. Science. 1999;286:531–7. doi: 10.1126/science.286.5439.531. [DOI] [PubMed] [Google Scholar]
- 3.Perou CM, Sørlie T, Eisen MB, van de Rijn M, Jeffrey SS, Rees CA, et al. Molecular portraits of human breast tumours. Nature. 2000;406:747–52. doi: 10.1038/35021093. [DOI] [PubMed] [Google Scholar]
- 4.Ross DT, Scherf U, Eisen MB, Perou CM, Rees C, Spellman P, et al. Systematic variation in gene expression patterns in human cancer cell lines. Nat Genet. 2000;24:227–35. doi: 10.1038/73432. [DOI] [PubMed] [Google Scholar]
- 5.Sørlie T, Perou CM, Tibshirani R, Aas T, Geisler S, Johnsen H, et al. Gene expression patterns of breast carcinomas distinguish tumor subclasses with clinical implications. Proc Natl Acad Sci USA. 2001;98:10869–74. doi: 10.1073/pnas.191367098. [DOI] [PMC free article] [PubMed] [Google Scholar]
- 6.Takahashi M, Rhodes DR, Furge KA, Kanayama H, Kagawa S, Haab BB, et al. Gene expression profiling of clear cell renal cell carcinoma: gene identification and prognostic classification. Proc Natl Acad Sci USA. 2001;98:9754–9. doi: 10.1073/pnas.171209998. [DOI] [PMC free article] [PubMed] [Google Scholar]
- 7.Zaravinos A, Lambrou GI, Boulalas I, Delakas D, Spandidos DA. Identification of common differentially expressed genes in urinary bladder cancer. PLoS ONE. 2011;6:e18135. doi: 10.1371/journal.pone.0018135. [DOI] [PMC free article] [PubMed] [Google Scholar]
- 8.de la Fuente A. From ‘differential expression’ to ‘differential networking’ - identification of dysfunctional regulatory networks in diseases. Trends Genet. 2010;26:326–33. doi: 10.1016/j.tig.2010.05.001. [DOI] [PubMed] [Google Scholar]
- 9.Lambrou GI, Zaravinos A, Adamaki M, Spandidos DA, Tzortzatou-Stathopoulou F, Vlachopoulos S. Pathway simulations in common oncogenic drivers of leukemic and rhabdomyosarcoma cells: a systems biology approach. Int J Oncol. 2012;40:1365–90. doi: 10.3892/ijo.2012.1361. [DOI] [PubMed] [Google Scholar]
- 10.Cohen BA, Mitra RD, Hughes JD, Church GM. A computational analysis of whole-genome expression data reveals chromosomal domains of gene expression. Nat Genet. 2000;26:183–6. doi: 10.1038/79896. [DOI] [PubMed] [Google Scholar]
- 11.Zaravinos A, Lambrou G, Boulalas I, Volanis D, Delakas D, Spandidos D. Linear Correlations in Chromosomal-Based Gene Expression in Urinary Bladder Cancer. Urology. 2011;78:S190. doi: 10.1016/j.urology.2011.07.570. [DOI] [Google Scholar]
- 12.Duggan BJ, McKnight JJ, Williamson KE, Loughrey M, O’Rourke D, Hamilton PW, et al. The need to embrace molecular profiling of tumor cells in prostate and bladder cancer. Clin Cancer Res. 2003;9:1240–7. [PubMed] [Google Scholar]
- 13.Dyrskjøt L. Classification of bladder cancer by microarray expression profiling: towards a general clinical use of microarrays in cancer diagnostics. Expert Rev Mol Diagn. 2003;3:635–47. doi: 10.1586/14737159.3.5.635. [DOI] [PubMed] [Google Scholar]
- 14.Dyrskjøt L, Kruhøffer M, Thykjaer T, Marcussen N, Jensen JL, Møller K, et al. Gene expression in the urinary bladder: a common carcinoma in situ gene expression signature exists disregarding histopathological classification. Cancer Res. 2004;64:4040–8. doi: 10.1158/0008-5472.CAN-03-3620. [DOI] [PubMed] [Google Scholar]
- 15.Dyrskjøt L, Thykjaer T, Kruhøffer M, Jensen JL, Marcussen N, Hamilton-Dutoit S, et al. Identifying distinct classes of bladder carcinoma using microarrays. Nat Genet. 2003;33:90–6. doi: 10.1038/ng1061. [DOI] [PubMed] [Google Scholar]
- 16.Modlich O, Prisack HB, Pitschke G, Ramp U, Ackermann R, Bojar H, et al. Identifying superficial, muscle-invasive, and metastasizing transitional cell carcinoma of the bladder: use of cDNA array analysis of gene expression profiles. Clin Cancer Res. 2004;10:3410–21. doi: 10.1158/1078-0432.CCR-03-0134. [DOI] [PubMed] [Google Scholar]
- 17.Mor O, Nativ O, Stein A, Novak L, Lehavi D, Shiboleth Y, et al. Molecular analysis of transitional cell carcinoma using cDNA microarray. Oncogene. 2003;22:7702–10. doi: 10.1038/sj.onc.1207039. [DOI] [PubMed] [Google Scholar]
- 18.Sanchez-Carbayo M, Socci ND, Charytonowicz E, Lu M, Prystowsky M, Childs G, et al. Molecular profiling of bladder cancer using cDNA microarrays: defining histogenesis and biological phenotypes. Cancer Res. 2002;62:6973–80. [PubMed] [Google Scholar]
- 19.Sanchez-Carbayo M, Socci ND, Lozano JJ, Li W, Charytonowicz E, Belbin TJ, et al. Gene discovery in bladder cancer progression using cDNA microarrays. Am J Pathol. 2003;163:505–16. doi: 10.1016/S0002-9440(10)63679-6. [DOI] [PMC free article] [PubMed] [Google Scholar]
- 20.Thykjaer T, Workman C, Kruhøffer M, Demtröder K, Wolf H, Andersen LD, et al. Identification of gene expression patterns in superficial and invasive human bladder cancer. Cancer Res. 2001;61:2492–9. [PubMed] [Google Scholar]
- 21.Ying-Hao S, Qing Y, Lin-Hui W, Li G, Rong T, Kang Y, et al. Monitoring gene expression profile changes in bladder transitional cell carcinoma using cDNA microarray. Urol Oncol. 2002;7:207–12. doi: 10.1016/S1078-1439(02)00192-8. [DOI] [PubMed] [Google Scholar]
- 22.Lambrou GI, Vlahopoulos S, Papathanasiou C, Papanikolaou M, Karpusas M, Zoumakis E, et al. Prednisolone exerts late mitogenic and biphasic effects on resistant acute lymphoblastic leukemia cells: Relation to early gene expression. Leuk Res. 2009;33:1684–95. doi: 10.1016/j.leukres.2009.04.018. [DOI] [PubMed] [Google Scholar]
- 23.Miyamoto H, Zheng Y, Izumi K. Nuclear hormone receptor signals as new therapeutic targets for urothelial carcinoma. Curr Cancer Drug Targets. 2012;12:14–22. doi: 10.2174/156800912798888965. [DOI] [PubMed] [Google Scholar]
- 24.Kidokoro T, Tanikawa C, Furukawa Y, Katagiri T, Nakamura Y, Matsuda K. CDC20, a potential cancer therapeutic target, is negatively regulated by p53. Oncogene. 2008;27:1562–71. doi: 10.1038/sj.onc.1210799. [DOI] [PubMed] [Google Scholar]
- 25.Huang C, Tang H, Zhang W, She X, Liao Q, Li X, et al. Integrated analysis of multiple gene expression profiling datasets revealed novel gene signatures and molecular markers in nasopharyngeal carcinoma. Cancer Epidemiol Biomarkers Prev. 2012;21:166–75. doi: 10.1158/1055-9965.EPI-11-0593. [DOI] [PubMed] [Google Scholar]
- 26.Lee H, Kong SW, Park PJ. Integrative analysis reveals the direct and indirect interactions between DNA copy number aberrations and gene expression changes. Bioinformatics. 2008;24:889–96. doi: 10.1093/bioinformatics/btn034. [DOI] [PMC free article] [PubMed] [Google Scholar]
- 27.Cantile M, Franco R, Schiavo G, Procino A, Cindolo L, Botti G, et al. The HOX genes network in uro-genital cancers: mechanisms and potential therapeutic implications. Curr Med Chem. 2011;18:4872–84. doi: 10.2174/092986711797535182. [DOI] [PubMed] [Google Scholar]
- 28.Coskun U, Sancak B, Sen I, Bukan N, Tufan MA, Gülbahar O, et al. Serum P-selectin, soluble vascular cell adhesion molecule-I (s-VCAM-I) and soluble intercellular adhesion molecule-I (s-ICAM-I) levels in bladder carcinoma patients with different stages. Int Immunopharmacol. 2006;6:672–7. doi: 10.1016/j.intimp.2005.10.009. [DOI] [PubMed] [Google Scholar]
- 29.Khin SS, Kitazawa R, Win N, Aye TT, Mori K, Kondo T, et al. BAMBI gene is epigenetically silenced in subset of high-grade bladder cancer. Int J Cancer. 2009;125:328–38. doi: 10.1002/ijc.24318. [DOI] [PubMed] [Google Scholar]
- 30.Tham SM, Ng KH, Pook SH, Esuvaranathan K, Mahendran R. Tumor and microenvironment modification during progression of murine orthotopic bladder cancer. Clin Dev Immunol. 2011;2011:865684. doi: 10.1155/2011/865684. [DOI] [PMC free article] [PubMed] [Google Scholar]
- 31.Rogala E, Skopińska-Rózewska E, Sommer E, Pastewka K, Chorostowska-Wynimko J, Sokolnicka I, et al. Assessment of the VEGF, bFGF, aFGF and IL8 angiogenic activity in urinary bladder carcinoma, using the mice cutaneous angiogenesis test. Anticancer Res. 2001;21(6B):4259–63. [PubMed] [Google Scholar]
- 32.Oberbach A, Schlichting N, Blüher M, Kovacs P, Till H, Stolzenburg JU, et al. Palmitate induced IL-6 and MCP-1 expression in human bladder smooth muscle cells provides a link between diabetes and urinary tract infections. PLoS ONE. 2010;5:e10882. doi: 10.1371/journal.pone.0010882. [DOI] [PMC free article] [PubMed] [Google Scholar]
- 33.Clarke OW, Conley RB. The duty to “attend upon the sick’. JAMA. 1991;266:2876–7. doi: 10.1001/jama.1991.03470200088041. [DOI] [PubMed] [Google Scholar]
- 34.Jayasooriya RG, Choi YH, Moon SK, Kim WJ, Kim GY. Methanol extract of Hydroclathrus clathratus suppresses matrix metalloproteinase-9 in T24 bladder carcinoma cells by suppressing the NF-κB and MAPK pathways. Oncol Rep. 2012;27:541–6. doi: 10.3892/or.2011.1501. [DOI] [PubMed] [Google Scholar]
- 35.Zaravinos A, Lambrou GI, Volanis D, Delakas D, Spandidos DA. Spotlight on differentially expressed genes in urinary bladder cancer. PLoS ONE. 2011;6:e18255. doi: 10.1371/journal.pone.0018255. [DOI] [PMC free article] [PubMed] [Google Scholar]
- 36.Mengual L, Burset M, Ars E, Lozano JJ, Villavicencio H, Ribal MJ, et al. DNA microarray expression profiling of bladder cancer allows identification of noninvasive diagnostic markers. J Urol. 2009;182:741–8. doi: 10.1016/j.juro.2009.03.084. [DOI] [PubMed] [Google Scholar]
- 37.Monzon FA, Lyons-Weiler M, Buturovic LJ, Rigl CT, Henner WD, Sciulli C, et al. Multicenter validation of a 1,550-gene expression profile for identification of tumor tissue of origin. J Clin Oncol. 2009;27:2503–8. doi: 10.1200/JCO.2008.17.9762. [DOI] [PubMed] [Google Scholar]
- 38.Chandran UR, Ma C, Dhir R, Bisceglia M, Lyons-Weiler M, Liang W, et al. Gene expression profiles of prostate cancer reveal involvement of multiple molecular pathways in the metastatic process. BMC Cancer. 2007;7:64. doi: 10.1186/1471-2407-7-64. [DOI] [PMC free article] [PubMed] [Google Scholar]
- 39.Ramasamy A, Mondry A, Holmes CC, Altman DG. Key issues in conducting a meta-analysis of gene expression microarray datasets. PLoS Med. 2008;5:e184. doi: 10.1371/journal.pmed.0050184. [DOI] [PMC free article] [PubMed] [Google Scholar]
- 40.Sîrbu A, Ruskin HJ, Crane M. Cross-platform microarray data normalisation for regulatory network inference. PLoS ONE. 2010;5:e13822. doi: 10.1371/journal.pone.0013822. [DOI] [PMC free article] [PubMed] [Google Scholar]
- 41.Klipper-Aurbach Y, Wasserman M, Braunspiegel-Weintrob N, Borstein D, Peleg S, Assa S, et al. Mathematical formulae for the prediction of the residual beta cell function during the first two years of disease in children and adolescents with insulin-dependent diabetes mellitus. Med Hypotheses. 1995;45:486–90. doi: 10.1016/0306-9877(95)90228-7. [DOI] [PubMed] [Google Scholar]
- 42.Storey JD, Tibshirani R. Statistical significance for genomewide studies. Proc Natl Acad Sci USA. 2003;100:9440–5. doi: 10.1073/pnas.1530509100. [DOI] [PMC free article] [PubMed] [Google Scholar]
- 43.Storey JD, Tibshirani R. Statistical methods for identifying differentially expressed genes in DNA microarrays. Methods Mol Biol. 2003;224:149–57. doi: 10.1385/1-59259-364-X:149. [DOI] [PubMed] [Google Scholar]
- 44.Tritchler D, Parkhomenko E, Beyene J. Filtering genes for cluster and network analysis. BMC Bioinformatics. 2009;10:193. doi: 10.1186/1471-2105-10-193. [DOI] [PMC free article] [PubMed] [Google Scholar]
- 45.Chartoumpekis DV, Zaravinos A, Ziros PG, Iskrenova RP, Psyrogiannis AI, Kyriazopoulou VE, et al. Differential expression of microRNAs in adipose tissue after long-term high-fat diet-induced obesity in mice. PloS ONE . 2012;7:e34872. doi: 10.1371/journal.pone.0034872. [DOI] [PMC free article] [PubMed] [Google Scholar]
- 46.Zhang B, Schmoyer D, Kirov S, Snoddy J. GOTree Machine (GOTM): a web-based platform for interpreting sets of interesting genes using Gene Ontology hierarchies. BMC Bioinformatics. 2004;5:16. doi: 10.1186/1471-2105-5-16. [DOI] [PMC free article] [PubMed] [Google Scholar]
- 47.Khatri P, Done B, Rao A, Done A, Draghici S. A semantic analysis of the annotations of the human genome. Bioinformatics. 2005;21:3416–21. doi: 10.1093/bioinformatics/bti538. [DOI] [PMC free article] [PubMed] [Google Scholar]
- 48.Khatri P, Drăghici S. Ontological analysis of gene expression data: current tools, limitations, and open problems. Bioinformatics. 2005;21:3587–95. doi: 10.1093/bioinformatics/bti565. [DOI] [PMC free article] [PubMed] [Google Scholar]
- 49.Grossmann S, Bauer S, Robinson PN, Vingron M. Improved detection of overrepresentation of Gene-Ontology annotations with parent child analysis. Bioinformatics. 2007;23:3024–31. doi: 10.1093/bioinformatics/btm440. [DOI] [PubMed] [Google Scholar]
- 50.Bauer S, Grossmann S, Vingron M, Robinson PN. Ontologizer 2.0--a multifunctional tool for GO term enrichment analysis and data exploration. Bioinformatics. 2008;24:1650–1. doi: 10.1093/bioinformatics/btn250. [DOI] [PubMed] [Google Scholar]
- 51.Ashburner M, Ball CA, Blake JA, Botstein D, Butler H, Cherry JM, et al. The Gene Ontology Consortium Gene ontology: tool for the unification of biology. Nat Genet. 2000;25:25–9. doi: 10.1038/75556. [DOI] [PMC free article] [PubMed] [Google Scholar]
Associated Data
This section collects any data citations, data availability statements, or supplementary materials included in this article.


