Significance
Obesity is a global epidemic in need of novel and safe therapeutics. We show that ShK-186, a selective blocker of the Kv1.3 potassium channel, has powerful antiobesity effects in a mouse model of diet-induced obesity. ShK-186 increases energy expenditure by activating brown adipose tissue, causes profound changes in liver metabolism and reduces obesity-induced inflammation of white adipose tissue. Our studies highlight the potential use of selective Kv1.3 blockers in the treatment of obesity and insulin resistance.
Keywords: metabolic syndrome, brown fat, diabetes mellitus, inflammation, potassium channel
Abstract
Obesity is an epidemic, calling for innovative and reliable pharmacological strategies. Here, we show that ShK-186, a selective and potent blocker of the voltage-gated Kv1.3 channel, counteracts the negative effects of increased caloric intake in mice fed a diet rich in fat and fructose. ShK-186 reduced weight gain, adiposity, and fatty liver; decreased blood levels of cholesterol, sugar, HbA1c, insulin, and leptin; and enhanced peripheral insulin sensitivity. These changes mimic the effects of Kv1.3 gene deletion. ShK-186 did not alter weight gain in mice on a chow diet, suggesting that the obesity-inducing diet enhances sensitivity to Kv1.3 blockade. Several mechanisms may contribute to the therapeutic benefits of ShK-186. ShK-186 therapy activated brown adipose tissue as evidenced by a doubling of glucose uptake, and increased β-oxidation of fatty acids, glycolysis, fatty acid synthesis, and uncoupling protein 1 expression. Activation of brown adipose tissue manifested as augmented oxygen consumption and energy expenditure, with no change in caloric intake, locomotor activity, or thyroid hormone levels. The obesity diet induced Kv1.3 expression in the liver, and ShK-186 caused profound alterations in energy and lipid metabolism in the liver. This action on the liver may underlie the differential effectiveness of ShK-186 in mice fed a chow vs. an obesity diet. Our results highlight the potential use of Kv1.3 blockers for the treatment of obesity and insulin resistance.
Obesity and its related metabolic disorders are a global pandemic. In the United States, ∼65% of the population is either overweight or obese (1). The complications of obesity will impose a significant burden on health care systems the world over (2, 3). Medical therapeutic options are limited. Therapies with novel mechanisms of action to combat obesity would therefore have significant medical and economic impact.
Kv1.3, a voltage-gated K+ channel (Kv), has been reported to regulate energy homeostasis and body weight (4). Importantly, Kv1.3−/− mice fed a high-fat diet exhibit increased light-phase metabolism together with reduced weight gain; lower levels of blood sugar, leptin, and insulin; and increased energy expenditure in comparison with wild-type littermates (4–10) (Table S1). Similarly, in melanocortin receptor 4 knockout mice, a genetic model of obesity, Kv1.3 gene deletion increases energy expenditure; decreases adiposity and weight; reduces leptin levels; and extends life span (8). Two mechanisms have been proposed to explain the antiobesity and metabolic effects of Kv1.3 gene deletion: enhanced peripheral insulin sensitization and augmented olfaction. First, knockout of the Kv1.3 gene or pharmacological blockade of the channel with the scorpion toxin margatoxin has been reported to enhance peripheral insulin sensitivity in white adipocytes and skeletal muscle by promoting translocation of the glucose transporter GLUT4 to the plasma membrane and thereby increasing glucose uptake (6, 7). Second, the olfactory bulb expresses Kv1.3 and is reported to function as a metabolic sensor (5, 9). Removal of the olfactory bulb attenuates the weight-reducing effects of Kv1.3 gene deletion (9). In humans, a polymorphism in the Kv1.3 promoter is associated with impaired glucose tolerance and with lower insulin sensitivity (11). These results suggest that selective Kv1.3 blockers might have use in the management of obesity and insulin resistance.
We used a mouse model of diet-induced obesity and insulin resistance to evaluate the therapeutic effects of a selective Kv1.3 blocker. In this model, mice fed an obesity-inducing diet rich in both fat and fructose (Tables S2 and S3) gain significant weight and adiposity, and develop insulin resistance within 6–8 wk (12–15). As a Kv1.3 blocker we chose ShK-186 because of its picomolar potency (IC50 69 pM), >100-fold selectivity over closely related channels, weak immunogenicity, and excellent safety profile in rodents and nonhuman primates (16–21). Furthermore, ShK-186 is the first Kv1.3-specific blocker to advance to human safety trials as a potential therapeutic for autoimmune diseases. Our study highlights the powerful antiobesity effects of ShK-186, and we characterize mechanisms that may contribute to ShK-186’s therapeutic activity.
Results
ShK-186 Prevents and Treats Weight Gain.
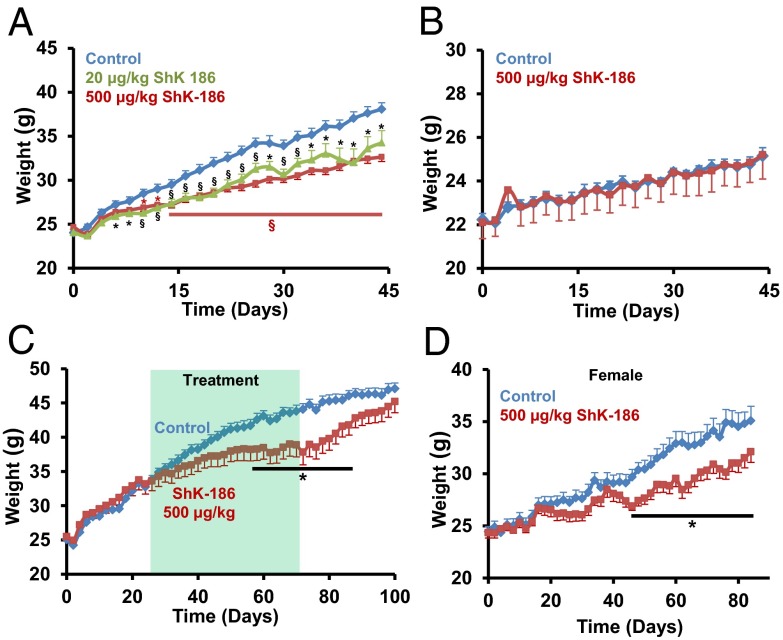
Adult mice were fed an obesity-inducing diet (Table S2) that mimics the Western diet linked to risk of cardiovascular diseases in humans (13–15), and immediately started on a therapeutic regimen of ShK-186 or vehicle. ShK-186’s durable pharmacological activity in rodents and nonhuman primates (16) allowed us to administer the peptide every other day by s.c. injection. ShK-186–treated male mice (20 or 500 μg/kg every other day) gained less weight than controls, and at the end of 45 d, treated mice were 3–5 g lighter than controls (Fig. 1A).
Fig. 1.
ShK-186 reduces weight gain in mice on obesity diet. (A) Prevention trial, males on obesity diet: ShK-186 (20 or 500 μg/kg on alternate days) (TD.88137 + 60% fructose/water (wt/vol); calorie contribution: fat 30.1%; carbohydrate 59%; protein 10.9%). Control: n = 19; 500 μg/kg: n = 30; 20 μg/kg: n = 19. Repeated-measures two-way ANOVA with post hoc Bonferroni correction; *P < 0.05, **P < 0.01, §P < 0.001 (black symbols: control vs. 20 μg/kg; brown symbols: control vs. 500 μg/kg). (B) Prevention trial, males on chow diet: ShK-186 (500 μg/kg) (TD.7001 4% fat + water; calorie contribution: fat 13%; carbohydrate 53%; protein 34%). Control: n = 8; ShK-186 500 μg/kg: n = 5. Pairwise Student t test was used to determine statistical significance. (C) Treatment trial, males on obesity diet: ShK-186 (500 μg/kg) administered 3 wk after onset of obesity diet. Shaded area shows 45-d period when ShK-186 or vehicle were administered. Bar shows time period over which P < 0.05. For all experiments, n = 6–8 in each group. All graphs depict mean ± SEM. Control: n = 6; 500 μg/kg: n = 7. (D) Prevention trial, females on obesity diet: ShK-186 (500 μg/kg on alternate days). The plot starts at a weight corresponding to the starting weight in males (∼23 g, females aged 15 wk). Control: n = 8; ShK-186 500 μg/kg: n = 8. Student t test: *P < 0.05.
Even at the highest dose, ShK-186 did not reduce weight gain in male mice fed a normal chow diet (Fig. 1B). These data corroborate earlier reports that Kv1.3 gene deletion is less effective in reducing weight gain, blood sugar, insulin, leptin, and visceral white adipose tissue (WAT) mass in mice on a normal chow diet compared with those on obesity-inducing diets (8, 10). Furthermore, rats fed normal chow diets and treated with ShK-186 (100 μg/kg) also show no reduction in weight gain (20, 21). These data suggest that obesity diets cause some type of metabolic change, which augment the antiobesity effects of pharmacological blockade or gene deletion of Kv1.3.
We chose the highest dose (500 μg/kg) for all subsequent studies to decipher why the peptide was effective in mice on the obesity diet but not the chow diet. In a treatment trial, male mice were allowed to gain significant weight for 3 wk on the obesity diet (Fig. 1C) and were then administered ShK-186 (500 µg/kg) or vehicle for 45 d. ShK-186 significantly slowed weight gain during treatment (Fig. 1C). Following cessation of therapy, weight gain resumed, and after 1 mo, these mice were close to the weight of controls (Fig. 1C). ShK-186 was also effective in reducing weight gain in female mice (Fig. 1D). Together, these results demonstrate that ShK-186 both prevents and treats obesity in mice fed the obesity diet, but is ineffective in mice fed a normal chow diet.
ShK-186 Reduces Dyslipidemia, Adiposity, Hyperglycemia, and Insulin Resistance.
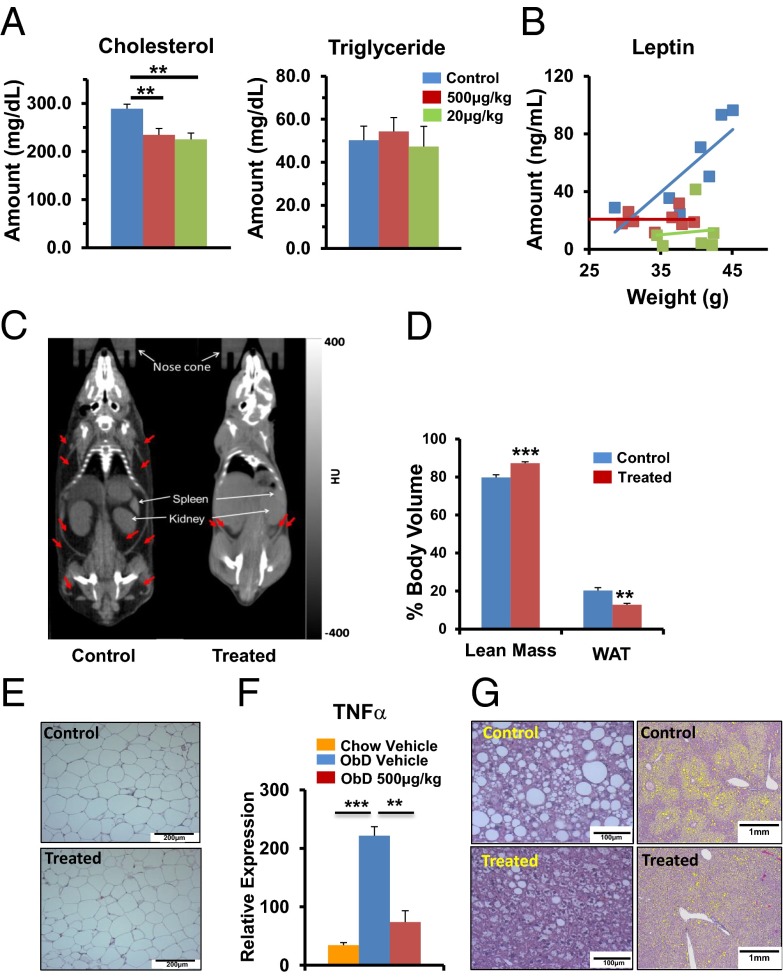
Dyslipidemia, increased adiposity, fatty liver, insulin resistance, and hyperglycemia are frequent complications of obesity. We therefore evaluated the ability of ShK-186 to counteract these negative effects. ShK-186 reduced blood levels of cholesterol (Fig. 2A) and leptin (Fig. 2B), but did not affect triglyceride (Fig. 2A). The effects of different doses of ShK-186 (20, 500 μg/kg) on blood lipids and leptin in mice fed either the obesity or chow diets are shown in Fig. S1A.
Fig. 2.
ShK-186 decreases adiposity in mice fed the obesity-inducing diet. (A) ShK-186’s (20 and 500 μg/kg) effect on blood cholesterol and triglyceride (one-way ANOVA: control vs. 20 or 500 μg/kg; **P < 0.01). (B) Blood leptin level plotted against body weight. Same color code as for A. (C) CT scans show images in Hounsfield units of darkened areas of WAT (identified by red arrows) in a vehicle-control (Left) and ShK-186–treated mouse (Right). (D) ShK-186’s effect on the percentage of body volume comprised of WAT (Student t test: **P = 0.004) and lean tissue (***P = 0.0004), n = 6 mice per group. Average weight ± SEM of control and treated animals used in the study were 36.5 ± 2.6 g and 30.4 ± 3.2 g, respectively. (E) H&E stain of abdominal WAT from control and treated mice. (Scale bar: 200 μm.) (F) TNFα mRNA increases in visceral WAT in mice fed an obesity diet compared with a chow diet (one-way ANOVA: ***P < 0.001). ShK-186 treatment of mice fed the obesity diet reduced TNFα mRNA levels to that in chow-fed mice (one-way ANOVA: **P < 0.01). (G) H&E stain at high (Left) and low (Right) magnification show lipid-laden vesicles in the liver. (Scale bars: Left, 100 μm; Right, 1 mm.) All measurements were made 10 wk after the start of the obesity diet and every other day s.c. administration of vehicle or ShK-186 (500 μg/kg); n = 6 in each group. All bar graphs depict mean ± SEM.
Whole-body CT scans showed that ShK-186 treatment decreased WAT volume and increased lean body volume (Fig. 2 C and D). Visceral WAT in obesity diet-fed control and treated mice appeared normal on microscopy (Fig. 2E); however, obesity-associated inflammation was evident based on the increase in TNFα mRNA expression in visceral WAT in mice fed the obesity diet compared with those fed the chow diet (Fig. 2F). ShK-186 treatment significantly reduced TNFα expression in visceral WAT (Fig. 2F), possibly via its known immunomodulatory effects on T cells and macrophages (16–25). The low uncoupling protein 1 (UCP1) mRNA levels (Fig. S1B; marker of brown fat) suggested that abdominal WAT did not undergo browning.
Control mice developed severe fatty liver (Fig. 2G). Macro- and microvesicles of fat in midzonal and centrilobular liver regions of control mice were significantly reduced in the livers of treated mice (Fig. 2G; Fig. S1C). CT scans confirmed that ShK-186 decreased fatty liver (Fig. S1D). In support of reduced lipid accumulation, we observed decreased transcription of sterol regulatory-element binding protein 1, a marker of hepatosteatosis (26), in ShK-186–treated livers compared with controls (Fig S1E). Treatment did not alter Kv1.3 mRNA expression in the liver (Fig. S1F).
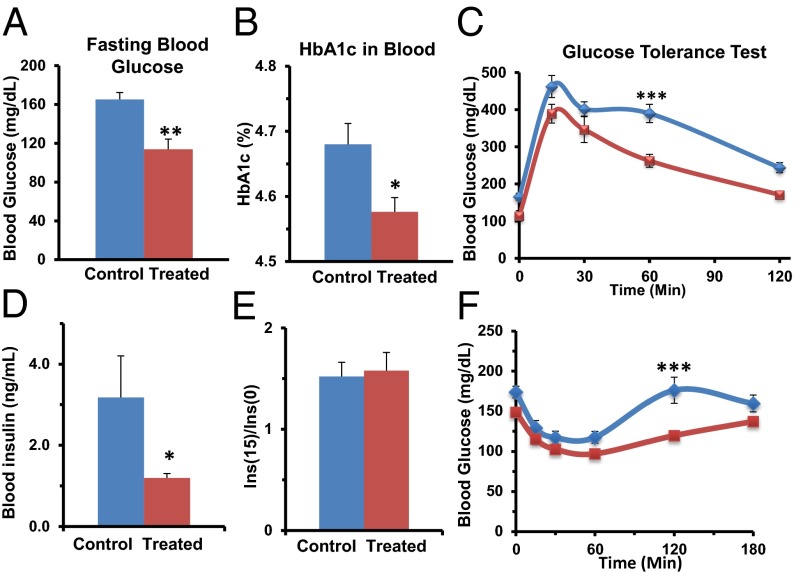
ShK-186 treatment normalized fasting blood glucose (Fig. 3A), HbA1c (Fig. 3B), and it improved glucose tolerance (Fig. 3C). To identify the mechanisms responsible for ShK-186’s antihyperglycemic effect, we measured insulin levels and peripheral insulin sensitivity. Fasting insulin levels in control mice were higher than normal, consistent with insulin resistance (Fig. 3D). ShK-186–treated mice had serum insulin levels closer to normal, and significantly lower than in controls (Fig. 3D). Following glucose challenge, the increase in serum insulin levels was similar in control and treated mice (Fig. 3E), suggesting that the antihyperglycemic activity of ShK-186 is not due to augmented insulin release from pancreatic islets. In an insulin tolerance test, ShK-186 significantly increased peripheral insulin sensitivity (Fig. 3F), which is likely the mechanism responsible for the drug’s effect.
Fig. 3.
ShK-186 reduces hyperglycemia and improves glucose tolerance in mice fed the obesity-inducing diet. (A and B) Blood sugar (A, Student t test; P = 0.002) and HbA1c (B, Student t test; P = 0.012). (C) Intraperitoneal glucose tolerance test: AUCcontrols = 42,075 mg/dL × min; AUCtreated = 31,420 mg/dL × min; repeated-measures two-way ANOVA with post hoc Bonferroni correction: 60 min: ***P < 0.001. (D) Fasting insulin levels in controls (3.2 ± 0.9 ng/mL) and ShK-186–treated mice (1.2 ± 0.1 ng/mL); Student t test; **P < 0.03. (E) Fold-increase in insulin release shown as the ratio of the insulin level 15 min after glucose challenge vs. the level before glucose challenge. (F) Insulin tolerance test to measure peripheral insulin sensitivity: AUCcontrol = 26,525 mg/dL × min; AUCtreated = 20,818 mg/dL × min, repeated-measures two-way ANOVA with post hoc Bonferroni correction, 120 min: ***P < 0.001. Measurements at week 10 of the study; n = 6–8 mice in each group. All graphs depict mean ± SEM.
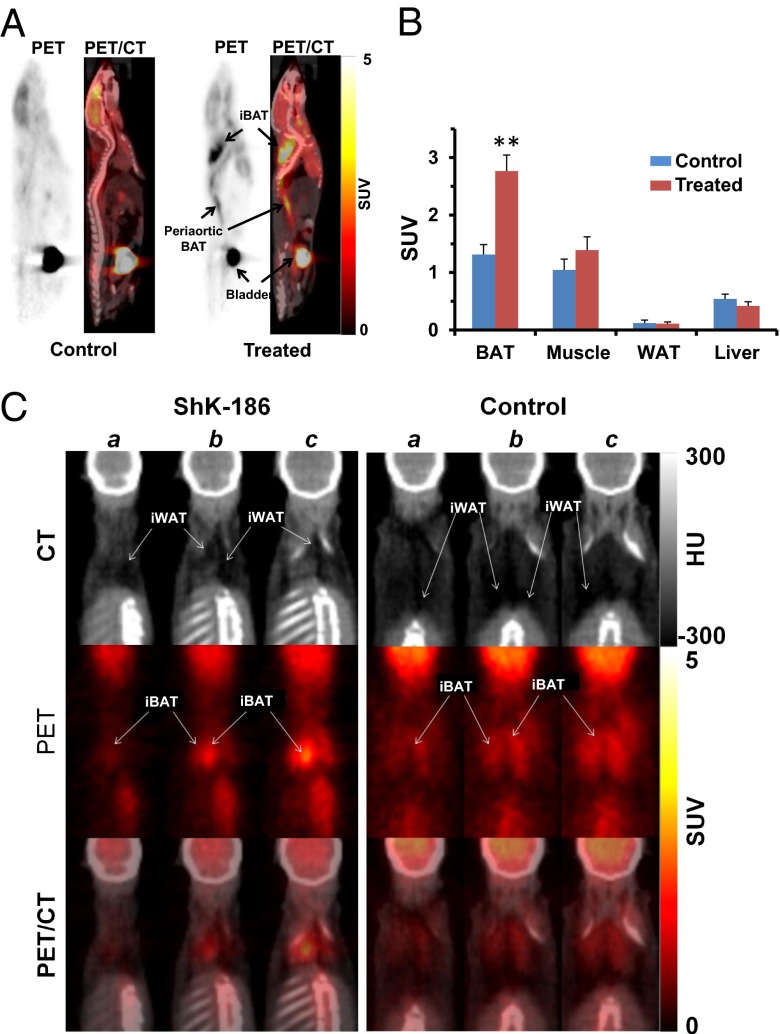
The increased insulin sensitivity suggests that ShK-186 augments uptake of glucose in peripheral tissues. To identify these tissues, we performed whole-body PET/CT scans to visualize tissue uptake of a radioactive glucose surrogate, 2-deoxy-2-(18F)-fluoro-d-glucose (18F-FDG), in control and ShK-186–treated mice. ShK-186 doubled the uptake of 18F-FDG into interscapular brown adipose tissue (BAT) compared with controls (Fig. 4 A and B). Within interscapular tissue the increased 18F-FDG uptake was exclusively into BAT with no uptake detected in interscapular WAT (Fig. 4C; Fig. S2). Increased 18F-FDG uptake was also seen in BAT in the periaortic, intercostals, and perirenal regions (Fig. S2A). ShK-186 did not increase 18F-FDG uptake into skeletal muscle, visceral WAT, or liver (Fig. 4B; Fig. S2B). Thus, ShK-186 therapy selectively increases glucose uptake by BAT, with no change in uptake by abdominal WAT, skeletal muscle, or liver. This selective change may contribute to the enhanced peripheral insulin sensitivity in ShK-186–treated mice. Collectively, these data demonstrate that ShK-186 counteracts negative consequences of high caloric intake, including dyslipidemia, hyperglycemia, leptin dysregulation, increased adiposity, fatty liver, insulin resistance, and obesity-associated inflammation of visceral WAT.
Fig. 4.
ShK-186 doubles 18F-FDG uptake into BAT without changing uptake into WAT, skeletal muscle, or liver. (A) PET and PET/CT images of 18F-FDG standardized uptake value (SUV) in control (Left) or treated (Right) mice. (B) Quantification of 18F-FDG uptake in BAT, visceral WAT, skeletal muscle, and liver. BAT uptake is twofold higher in treated mice vs. controls (Student t test; **P = 0.002). (C) Consecutive (a–c) CT images (Top) in Hounsfield units (HU) show darkened areas of WAT in interscapular adipose tissue. PET images (Middle; SUV) shows that of 18F-FDG uptake is entirely into interscapular BAT (iBAT). The overlay of PET and CT images (Bottom) show that 18F-FDG uptake is entirely into iBAT, with no uptake detected in interscapular WAT (iWAT); n = 6 in each group. All bar graphs depict mean ± SEM.
ShK-186 Therapy Activates BAT.
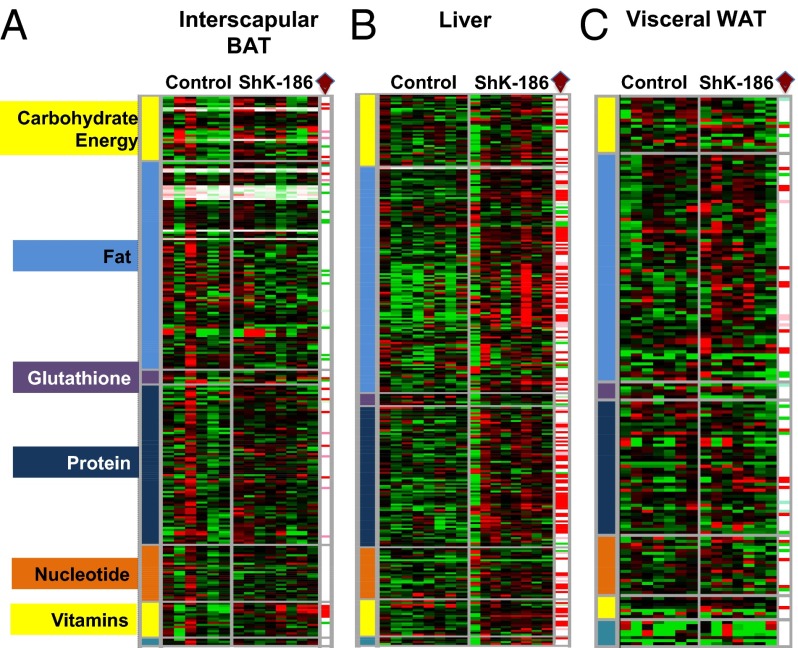
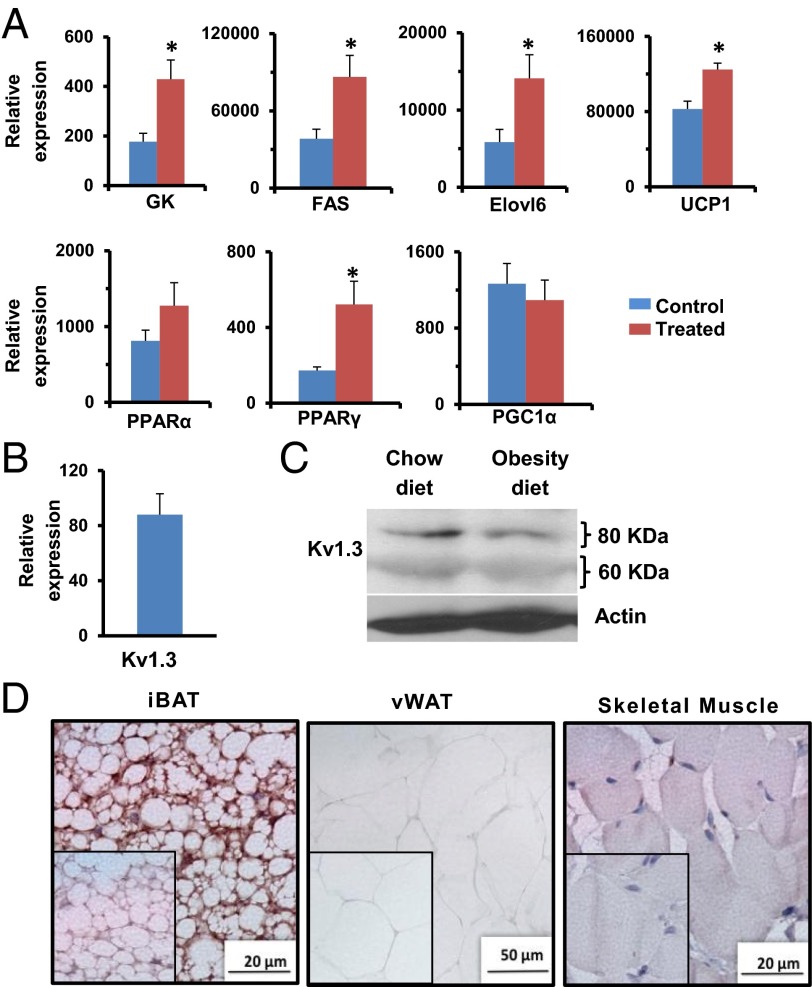
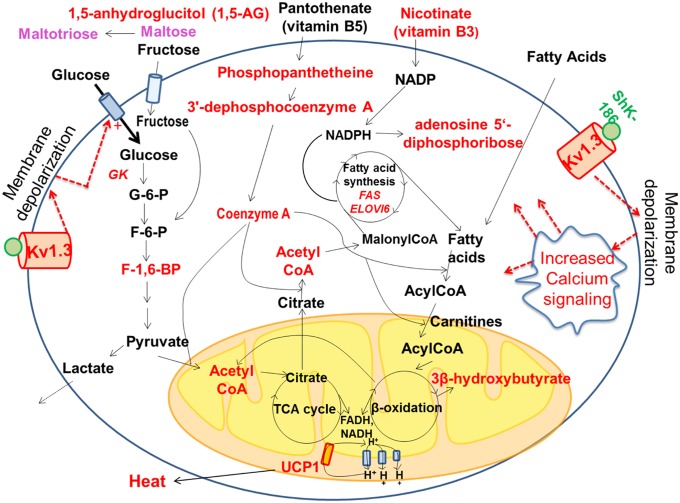
To explore the consequences of ShK-186–mediated increased glucose uptake by BAT, an important thermogenic tissue (27–32), we analyzed the effect of ShK-186 therapy on BAT metabolism by global metabolite profiling and quantitative PCR (qPCR) of key genes (Figs. 5 and 6). A total of 254 metabolites were identified in BAT, of which 24 were significantly increased and 19 significantly decreased in treated mice (Fig. 5A). Specifically, ShK-186 therapy augmented activity of four key biochemical pathways—β-oxidation of fatty acids, glycolysis, utilization of vitamins (pantothenic acid and nicotinate), and fatty acid synthesis—in BAT (Fig. 7). First, the increased levels of 3β-hydroxybuytrate and acetyl CoA in BAT from treated mice suggested augmentation of β-oxidation of fatty acids (Figs. 5A and 7; Fig. S3). Export of 3β-hydroxybutyrate from the liver to BAT was not a contributing factor because the level of 3β-hydroxybuytrate in the liver was the same in control and treated mice (Fig. S3). Second, enhanced glycolysis was suggested by the doubling of 18F-FDG uptake by treated BAT (Fig. 4), the increased transcription of glucokinase, the first enzyme in the glycolytic pathway (Fig. 6A), and the higher level of fructose-1,6-diphosphate—the rate-limiting step in glycolysis (Fig. 7; Fig. S3). Furthermore, the level of lactate was not changed following ShK-186 treatment (Fig. 7; Fig. S3), suggesting that pyruvate generated by glycolysis likely contributes to the higher level of acetyl-CoA (Fig. 7). Third, ShK-186 heightened conversion of pantothenic acid (vitamin B5) into phosphopantetheine, 3′-dephosphocoenzyme A, and finally into CoA (Figs. 5A and 7; Fig. S3). CoA is a key player in several metabolic pathways in BAT, particularly fatty acid synthesis and the tricarboxylic acid (TCA) cycle (Fig. 7). Nicotinate (vitamin B3) and its metabolite adenosine 5′-diphosphoribose were also increased in treated BAT (Fig. 5A; Fig. S3), reflecting enhanced vitamin B3 utilization to generate NADP and NAD required for multiple steps in BAT metabolism (Fig. 7). Fourth, increased fatty acid synthesis was suggested by the increased transcription of fatty acid synthase (FAS) and elongation of long-chain fatty acids family member 6 (Elovl6; Fig. 6A), key genes involved in de novo fatty acid synthesis, and by the elevated levels of acetyl-CoA, CoA, and nicotinate (Fig. 5A; Fig. S3), all of which drive fatty acid synthesis (Fig. 7). The ultimate consequence of metabolic changes in BAT is the generation of reduced electron carriers FADH and NADH in mitochondria (27–32). FADH and NADH are oxidized by the electron transport chain, resulting in the formation of protons that are pumped out of mitochondria (Fig. 7). UCP1, a symporter of H+ and anionic long-chain fatty acids (LCFA-anion; 11–18 carbon chain length) in the inner mitochondrial membrane of brown adipocytes, typically shuttles protons back into the mitochondria (28, 32). ShK-186 increased UCP1, fatty acid synthase, glucokinase, elongase 6, and peroxisome proliferator-activated receptor γ (PPARγ) transcription without affecting other BAT thermogenic genes, including genes selective for brown and beige adipocytes (Fig. 6A; Fig. S4). Increased UCP1 would enhance proton leaking back into the mitochondria, generate an enhanced proton-motive force, and heighten the dissipation of stored energy as heat (Fig. 7). Collectively, these metabolic changes suggest that ShK-186 therapy activates BAT to increase thermogenesis.
Fig. 5.
ShK-186 therapy alters the metabolite profile of BAT, liver, and WAT. (A) Interscapular BAT; (B) liver; (C) visceral WAT in control and ShK-186–treated mice. Heat map in a three-color range minimum (0.5; bright green), median (1.0, black), and maximum (2.0, red). Welch’s two-sample t tests were used to identify metabolites that differed significantly between ShK-186–treated tissues compared with controls (see SI Materials and Methods for more details about statistical analysis). Metabolites that achieved statistical significance (P ≤ 0.05), as well as those approaching significance (0.05 < P < 0.1), are shown in the columns at the right end of each heat map and are identified by a brown diamond. Metabolites that are significantly altered: red, increased P < 0.05; pink, increased P < 0.1; bright green, decreased P < 0.05; light green, decreased P < 0.1 in ShK-186–treated tissues compared with controls. Raw data are shown in Fig. S3.
Fig. 6.
Kv1.3 is expressed in BAT, and ShK-186 therapy activates BAT. (A) mRNA levels in interscapular BAT of key genes involved in BAT metabolism in control (blue bars) and ShK-186–treated mice (brown) determined relative to 18S RNA by qPCR. FAS, fatty acid synthase; GK, glucokinase; Student t test: GK *P = 0.04; FAS *P = 0.02; Elovl6 *P = 0.03; UCP1 *P = 0.04; PPARγ *P = 0.04. All bar graphs depict mean ± SEM. (B) Kv1.3 mRNA in BAT relative to 18S RNA. (C) Western blot showing Kv1.3 in BAT of mice on chow vs. obesity-inducing diet. Actin served as the control. The Kv1.3 bands of 60 kDa (nonglycosylated) and 80 kDa (glycosylated) are the same size as reported (33). Quantitation was performed by densitometry and is shown in Table S8. (D) Immunohistochemistry: Kv1.3 in interscapular BAT (Left), visceral WAT (vWAT; Center), and skeletal muscle (Right). (Insets) Isotype controls (polyclonal rabbit IgG in place of primary antibody). Studies were done at week 10; n = 4 for A, C, and D; n = 7 for B.
Fig. 7.
Graphical representation of metabolic pathways altered in BAT following ShK-186 treatment. Metabolites and genes with significantly enhanced expression (P < 0.05) are highlighted in red. The raw data are shown in Figs. 5 and 6, and Fig. S3. Dotted lines represent possible changes that may occur with Kv1.3 channel blockade.
BAT activation might be a compensatory response to metabolic changes elsewhere in the body, or it might represent a direct action of ShK-186 on channels in brown adipocytes. We detected Kv1.3 mRNA (Fig. 6B), and both glycosylated (80 kDa) and unglycosylated (60 kDa) Kv1.3 protein forms (Fig. 6C) (33) in BAT. We also saw robust immunostaining of Kv1.3 in brown adipocytes (Fig. 6D). Minimal Kv1.3 staining was detected in visceral WAT and skeletal muscle (Fig. 6D). Our results corroborate earlier reports of Kv1.3 mRNA (Gene Expression Omnibus Database accession no. 41275824) and protein in mouse BAT (4). Patch-clamp studies on in vitro-differentiated neonatal rat brown adipocytes have revealed the existence of a KV channel with properties resembling Kv1.3, including activation at potentials positive to −35 mV, slow inactivation, rapid deactivation, and block by quinine, verapamil, 4-aminopyridine, and tetraethylammonium at concentrations known to block Kv1.3 (34-41). However, charybdotoxin, a scorpion peptide blocker of Kv1.3, did not affect the channel in in vitro-differentiated brown adipocytes (35), raising the possibility that the native channel in BAT may be a Kv1.3-containing heterotetramer. Blockade of Kv1.3 channels in BAT would possibly lead to membrane depolarization and alter calcium signaling, as has been shown in other cells (Fig. 7). Membrane depolarization in BAT has been previously shown to accompany thermogenesis (28, 42–44). Thus, the metabolic changes may, at least in part, occur via direct blockade of Kv1.3 channels in BAT.
The differential effectiveness of ShK-186 therapy in mice fed an obesity diet vs. a chow diet cannot be explained by BAT activation. No difference was found in Kv1.3 protein expression in BAT from mice fed obesity or chow diets (Fig. 6C), suggesting that ShK-186 therapy may increase BAT-dependent energy expenditure in mice fed the chow diet as it does in mice on the obesity diet. In support, Kv1.3 gene deletion increases energy expenditure in mice fed chow or obesity-inducing diets compared with wild-type controls (4). These results suggest that pharmacological blockade or gene deletion of Kv1.3 increases BAT-dependent energy expenditure regardless of the diet.
ShK-186 Enhances Metabolic Activity.
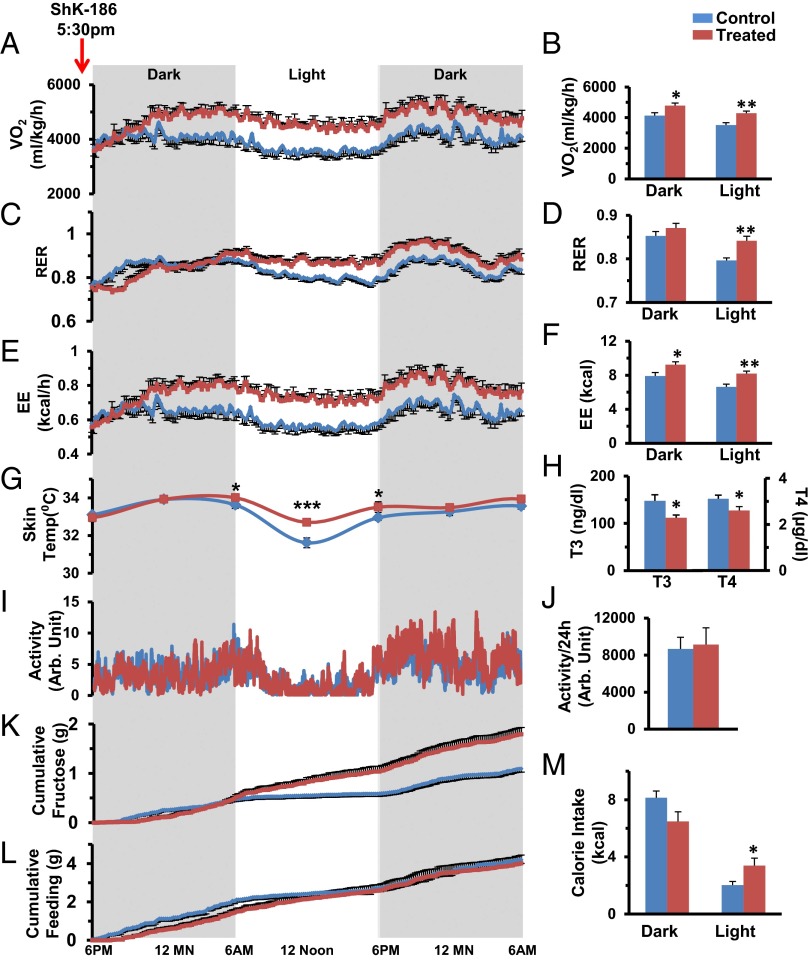
Because BAT activation may lead to increased thermogenesis in ShK-186–treated mice, we used the Comprehensive Lab Monitoring System (CLAMS) to measure energy expenditure. Ten weeks after the start of the study, mice were allowed to acclimate for 4 d in CLAMS cages while continuing their diet and therapy; their metabolic status was then evaluated for 36 h after receiving their scheduled injection of vehicle or ShK-186. ShK-186 caused a significant increase in oxygen consumption (VO2; Fig. 8 A and B) and in the respiratory exchange ratio (RER; VCO2/VO2; Fig. 8 C and D). The increased VO2 and RER resulted in increased energy expenditure (EE) in treated mice (Fig. 8 E and F), accounting for an additional ∼2.5 kcal being expended on a daily basis compared with controls (control: 14.55 ± 0.70 kcal/d; treated: 17.42 ± 0.62 kcal/d; Table S4). The increased energy expenditure manifested as a 1 °C higher body temperature at midday and a blunted diurnal variation in temperature (Fig. 8G). Thyroid hormone levels in treated mice were in the normal range and significantly lower than in controls (Fig. 8H). Locomotor activity in treated mice was no different from in controls (Fig. 8 I and J). These results indicate that the higher metabolic rate is not due to hyperthyroidism or to increased physical activity. Feeding and drinking in these mice were measured with CLAMS. ShK-186–treated animals drank more fluid (Fig. 8K), but showed no change in the consumption of solid food (Fig. 8L; Tables S5 and S6). The overall daily calorie intake from food plus drink was not altered by ShK-186 treatment (Fig. 8M; control: 12.77 ± 0.34 kcal/d; treated: 14.11 ± 1.11 kcal/d, P = 0.3; Table S7). Together, these results suggest that ShK-186’s activation of BAT results in heightened energy expenditure without a change in calorie intake (net increase in energy expenditure in treated mice ∼1.5 kcal/d), which contributes to the peptide’s antiobesity effects.
Fig. 8.
ShK-186 therapy alters VO2, RER, and EE without altering locomotor activity, calorie intake, or thyroid hormone levels. In all panels, blue represents controls and brown represents ShK-186–treated mice. (A–F) VO2 (A), RER (C), and EE (E) measured over 36 h, and dark-phase and light-phase changes in VO2 (B), RER (D), and EE (F). P values for daily differences between control and treated mice = O2 consumption (repeated-measures two-way ANOVA: P < 0.0001), RER (P = 0.001), and EE (P = 0.0001; Table S4). (G) Body temperature over 36 h, P = 0.0015 at midday. (H) Triiodothyronine (T3; Student t test, P = 0.02) and thyroxine (T4; Student t test, P = 0.04) levels. (I and J) Locomotor activity over 36 h. Fluid (K) and food (L) consumption measured over 36 h. For K, we measured intake of fructose/water in milliliters and calculated the fructose consumption in grams based on the weight-to-volume concentration of fructose, and then quantified dark-phase and light-phase calorie intake from fructose/water (K; P = 0.0006; Table S6) and food (L; P = 0.769; Table S5). (M) Total daily calorie intake was not altered by treatment (P = 0.395; Table S7). Statistical tests: A, C, E, G, I, K, and L: repeated-measures two-way ANOVA; B, D, F, H, J, and M: Student t test was performed to compare means. n = 10 for A–F; n = 11 for K–M; n = 10 for G; n = 6 for I and J. All graphs depict mean ± SEM. Measurements made at week 10 of the study. ShK-186 (500 μg/kg) administered at 5:30 PM before recording.
ShK-186 Affects Hepatic Lipid and Glucose Metabolism.
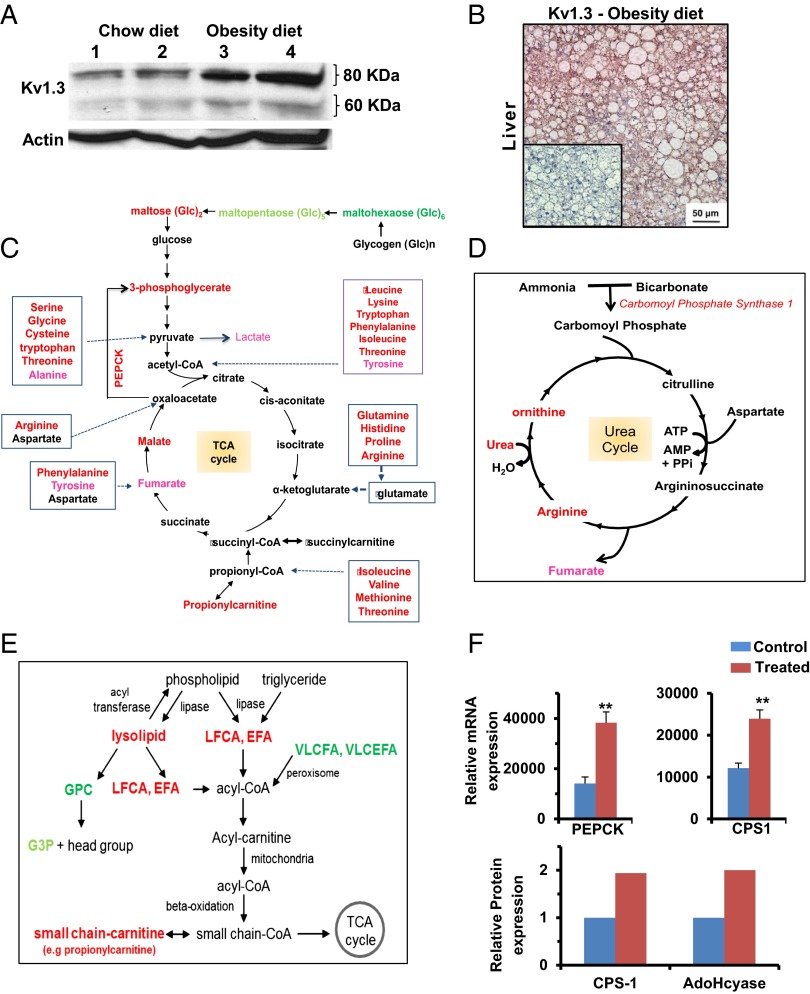
Because ShK-186 therapy (Fig. 3F) and knockout of the Kv1.3 gene (7) both enhance peripheral insulin sensitivity and glucose homeostasis, and the liver plays a critical role in carbohydrate metabolism, we investigated whether ShK-186 might affect hepatic metabolism. First, we compared Kv1.3 expression in livers of mice fed a normal chow diet vs. the obesity diet. Western blot analysis showed an approximate three- to fourfold increase in both the glycosylated (80 kDa) and nonglycosylated (60 kDa) Kv1.3 protein forms in the liver of mice on the obesity diet compared with mice on the chow diet (Fig. 9A; Table S9), and robust Kv1.3 immunostaining was seen in hepatocytes in obese mice (Fig. 9B). The mechanism responsible for the induction of Kv1.3 by the high fat and/or the high fructose in the obesity diet remains to be defined.
Fig. 9.
Kv1.3 expression is induced in the liver of mice on the obesity diet, and ShK-186 therapy alters energy and lipid metabolism in the liver. (A) Western blot showing Kv1.3 in the liver of mice on chow (lanes 1 and 2) vs. obesity diet (lanes 3 and 4). Actin served as the control. Livers were analyzed at week 10 of the study. Quantitation was performed by densitometry and is shown in Table S9. (B) Kv1.3 immunostaining in hepatocytes in liver from a mouse on the obesity diet. (Inset) Isotype control (polyclonal rabbit IgG in place of primary antibody). (C) Effect of ShK-186 therapy on energy metabolism in the liver; metabolites, or genes altered in expression are highlighted in red (increased P < 0.05), pink (increased P < 0.1), bright green (decreased P < 0.05), and light green (decreased P < 0.1). (D) Effect of ShK-186 therapy on the urea cycle in the liver; same color code as in C. (E) Effect of ShK-186 therapy on lipid metabolism in the liver. EFA, essential fatty acids; G3P, glycerol-3-phosphate; GPC, glycerophosphocholine; LCFA, long-chain fatty acids; VLCFA, very long-chain fatty acids; VLCEFA, very long-chain essential fatty acids; same color code as in C. (F) mRNA levels of phosphoenolpyruvate carboxykinase (PEPCK) and carbamoyl phosphate synthase 1 (CPS1), relative to 18S RNA, was determined by qPCR in livers of control and ShK-186–treated mice (Upper). Student t test; **P < 0.01. Protein levels of CPS1 and AdoHcyase from pooled samples was determined by 2-DIGE-MS (Lower; SI Materials and Methods).
To explore the functional consequences of this Kv1.3 induction, we examined ShK-186’s effect on liver metabolism by using global metabolite profiling and qPCR analysis. Global metabolite profiling identified a total of 292 metabolites in the liver, of which 141 increased and 20 decreased in the livers of ShK-186–treated mice (Fig. 5B; Fig. S3). These profound changes affected virtually every metabolic pathway (Fig. 5B). Specifically, we observed significant changes in central energy and lipid metabolism (Fig. 9). Metabolites in energy metabolism increased by ShK-186 therapy are depicted in Fig. 9C and include maltose (converted to glucose), 3-phosphoglycerate (intermediate in glycolysis and gluconeogenesis), malate and fumarate (two intermediates in the TCA cycle), propionylcarnitine (product of propionyl CoA derived from the TCA cycle), and lactate (derivative of pyruvate and suggestive of increased glycolysis). Metabolites involved in oxidative phosphorylation [pyrophosphate (PPi), acetyl phosphate] were also elevated (Fig. S3). Phosphoenolpyruvate carboxykinase (PEPCK) showed increased transcription in treated livers, suggesting that this enzyme increases the conversion of oxaloacetate to 3-phosphoglycerate, thereby heightening gluconeogenesis (Fig. 9 C and F). Interestingly, virtually every amino acid that feeds into the TCA cycle was significantly increased in ShK-186–treated livers (Figs. 5B and 9C), suggesting enhanced utilization of proteins to drive energy metabolism. In support, protein-breakdown products—urea, ornithine, transhydroxyproline, arginine, and dipeptides—were increased in treated livers (Fig. 9D; Fig. S3), and mRNA and protein expression of carbamoyl phosphate synthase 1 (CPS1), a key gene in the urea cycle, was also significantly higher (Fig. 9F). Further, the increase in cysteine in treated livers was paralleled by an increase in intermediate metabolite S-adenosylhomocysteinase (SAH) (Fig. S3), and higher protein expression of adenosylhomocysteinase (Fig. 9F; AdoHcyase), the enzyme that converts SAH to adenosine and homocysteine. Muscle catabolism does not appear to be a source for the amino acids used by the liver because treated mice exhibited normal muscle strength in a hanging wire test; no clinical signs of muscle wasting were observed in the mice throughout the trial; and skeletal muscle biopsies showed no histological changes compared with control muscle (Fig. S5). Thus, ShK-186 therapy caused several, apparently opposing, changes in the carbohydrate pathway in the liver, including increased glycolysis (suggested by increased levels of maltose, 3-phosphoglycerate, and lactate), gluconeogenesis (suggested by heightened transcription of PEPCK and increased level of 3-phosphoglycerate), and enhanced activity of the TCA cycle (suggested by higher levels of malate, fumarate, propionylcarnitine, and proteins that drive the cycle). These widespread changes likely contribute to the differential activity of ShK-186 therapy in mice on the normal chow vs. obesity diet.
ShK-186 therapy also caused profound changes in lipid metabolism in the liver (Figs. 5B and 9E; Fig. S3). ShK-186 increased levels of long-chain fatty acids, essential fatty acids, and lysolipids, and decreased levels of very long-chain fatty acids (>22 carbons) and glycerolipids (Fig. 9E; Fig. S3). However, β-oxidation of fatty acids was not enhanced in treated mice, as indicated by normal levels of 3-hydroxybutryate (Fig. S3). These changes may reflect futile cycling within lipid metabolic pathways. Interestingly, PPAR-activating metabolites 12-HETE, 9+13-HODE, and palmitoylethanolamide, which are associated with improved insulin resistance and diabetes control, were increased by ShK-186 therapy (Fig. S3). Together, these data demonstrate that ShK-186 therapy has the most profound effect on the liver in mice fed an obesity diet, where it heightens activity of metabolic pathways involved in energy and lipid metabolism. The increase in Kv1.3 expression in the liver of mice fed the obesity diet and the widespread metabolic changes caused by ShK-186 likely contribute to the differential effectiveness of ShK-186 therapy in mice on the obesity diet vs. the normal chow diet.
Because ShK-186 therapy reduces WAT volume, we explored the effect of ShK-186 on the abdominal WAT metabolome. We measured 174 metabolites and of these only 23 metabolites were significantly elevated and 16 were significantly lower in ShK-186–treated mice (Fig. 5C; Fig. S3). Because Kv1.3 expression was absent or minimal in abdominal and interscapular WAT in obese mice (Fig. 6D; i.e., no difference in staining between isotype control and Kv1.3), the metabolic changes caused by ShK-186 in WAT are likely a response to changes in other organs, including BAT and liver. In summary, ShK-186 therapy caused profound tissue-specific changes in the metabolomes of BAT, WAT, and liver (Figs. 5 and 9; Fig. S3), and these changes may contribute to the powerful antiobesity effects of ShK-186.
Discussion
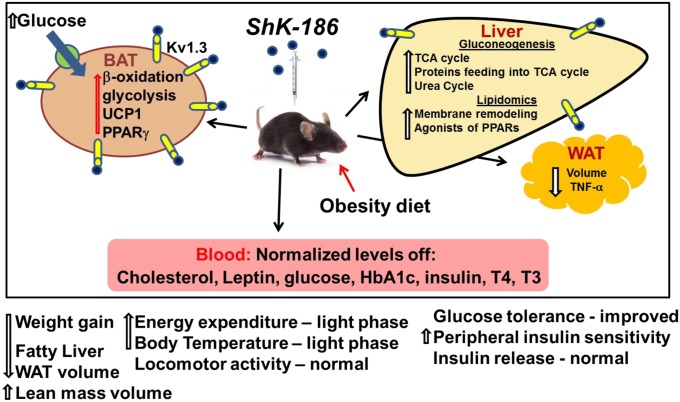
We describe a unique approach to treat diet-induced obesity and insulin resistance by selective blockade of Kv1.3 channels with ShK-186 (Fig. 10). In mice fed an obesity-inducing diet, ShK-186 normalized blood levels of cholesterol, glucose, HbA1c, insulin, leptin, and thyroid hormones, and reduced weight gain, adiposity, and fatty liver. The antiobesity effects of ShK-186 therapy are remarkably similar to the effects of Kv1.3 gene deletion in diet-induced obesity (Table S1), strongly suggesting that the antiobesity activities of ShK-186 are predominantly due to pharmacological actions on Kv1.3. These actions are due to blockade of Kv1.3 channels in peripheral tissues because <0.1% of the peptide crosses the blood–brain barrier (17). At least three mechanisms contribute to the antiobesity effects of ShK-186: BAT activation leading to increased energy expenditure, altered metabolism in the liver, and reduction of obesity-induced inflammation of abdominal WAT.
Fig. 10.
Graphical representation of changes induced by ShK-186 therapy in the diet-induced obesity model. Mice were fed an obesity-inducing diet of high fat and high fructose. ShK-186 or vehicle was administered by s.c. injection every other day. ShK-186 therapy prevented dyslipidemia, hyperglycemia, insulin resistance, adiposity, and fatty liver in this model. At least three mechanisms were involved in the peptide’s effect: increased BAT-dependent energy expenditure, enhanced energy and lipid metabolism in the liver, and reduced inflammation of WAT.
ShK-186 therapy caused substantial changes in BAT metabolism: it doubled glucose uptake; increased β-oxidation of fatty acids, glycolysis, fatty acid synthesis, and utilization of the vitamins B3 and B5; and enhanced transcription of genes involved in BAT metabolism (UCP1, glucokinase, Elovl6, fatty acid synthase, PPARγ). BAT activation in turn enhanced oxygen consumption and RER, resulting in a ∼2.5-kcal increase in energy expenditure per day in treated mice compared with control mice (Table S4), with no change in calorie intake. These results suggest that the antiobesity effects of ShK-186 are in part due to BAT activation and heightened calorie utilization. Although BAT has not been studied in Kv1.3−/− mice, the increased energy expenditure seen in these mice on obesity-inducing diets, particularly during the light phase (10), is likely to be due to BAT-dependent thermogenesis. The differential effectiveness of ShK-186 therapy in mice fed an obesity diet vs. a chow diet (Fig. 1 A and B) is not a consequence of BAT activation because Kv1.3 protein expression in BAT is the same in mice on these diets. Furthermore, Kv1.3 gene deletion is equally effective in enhancing energy expenditure in mice fed a chow or an obesity diet (4).
The molecular mechanism responsible for these robust metabolic changes in BAT is unclear at this time, but may involve direct blockade of Kv1.3 channels that are expressed in BAT in mice on the obesity diet. Channel blockade would result in membrane depolarization and mimic the membrane-depolarizing effects of high external potassium concentrations that augment BAT thermogenesis (28, 42–44). However, tetraethylammonium at a dose that blocks Kv1.3 channels was reported not to alter norepinephrine-dependent thermogenesis (37). These experiments were done on 7-d in vitro-differentiated neonatal brown adipocytes isolated from rats on a normal chow diet, whereas our studies with ShK-186 were performed on adult mice that had received 10 wk of an obesity diet and expressed Kv1.3 in BAT. We cannot therefore exclude a direct blocking mechanism. A second possibility is that ShK-186 therapy causes vasodilation, which increases BAT thermogenesis and skin temperature in an attempt to defend core body temperature. However, this possibility is unlikely for the following reasons. First, Kv1.3 is minimally expressed in normal blood vessels (45–47), and only after vascular injury does its expression increase in proliferating vascular smooth muscle cells (48–50). Second, Kv channel blockers would cause vasoconstriction, not vasodilation (51). Third, ShK-186 does not alter heart rate parameters or blood pressure in chronically treated rats (20), indicating that vascular changes, if any, are not sufficient to cause BAT-mediated thermogenesis. A third possible mechanism might involve sympathetic stimulation of BAT by ShK-186, leading to its activation. Kv1.3 is expressed in postganglionic sympathetic neurons, and blockade of Kv1.3 depolarizes the membrane potential and shortens latency-to-firing of these neurons (52). However, as stated above, ShK-186 does not exhibit cardiac effects (20, 21), suggesting that any sympathetic nerve-mediated activation of BAT by ShK-186 is not generalized. A fourth possibility is that the metabolic changes in the liver, WAT, and other tissues cause a compensatory increase in BAT metabolism, leading to heightened energy expenditure. In short, the mechanism by which ShK-186 increases thermogenesis remains elusive.
Metabolically active BAT has been demonstrated in adult humans by PET scans (53–56). Body mass index (BMI) and body fat percentage is inversely related to BAT mass, and obese adult humans have low BAT mass, which increases following gastric banding surgery (57–60). These findings have created significant interest in developing therapeutics that target BAT in humans for obesity therapy (27–32). If future studies demonstrate the presence of Kv1.3 in human BAT, it may provide a rationale for evaluating ShK-186’s effectiveness as an inducer of energy expenditure in obese humans.
The liver, a key organ for whole-body energy metabolism balance and signal integration, is a second target for ShK-186 therapy. ShK-186 therapy caused widespread changes in central energy and lipid metabolism in the liver, which may contribute to the peptide’s antiobesity effects. ShK-186’s profound actions on liver metabolism may involve direct blockade of Kv1.3 in hepatocytes, leading to membrane depolarization and altered calcium signaling. An alternate explanation for these changes is a compensatory metabolic response in the liver due to ShK-186’s action on Kv1.3 in another organ. Western blot analysis showed a significant increase in Kv1.3 protein expression in the liver in mice fed the obesity diet. This differential Kv1.3 expression is a potential contributor to the differential effectiveness of ShK-186 therapy in mice fed an obesity diet vs. a chow diet.
ShK-186 therapy prevented diet-induced insulin resistance and hyperglycemia. The antidiabetic effect of ShK-186 was due to augmented peripheral insulin sensitivity rather than enhanced insulin release from the pancreas. BAT, but not skeletal muscle, WAT, or liver, was the main peripheral tissue that exhibited augmented glucose uptake and therefore contributed to the enhanced peripheral insulin sensitivity in ShK-186–treated mice. Our demonstration of increased peripheral insulin sensitivity by Kv1.3 blockade confirms studies with Kv1.3−/− mice (6, 7) and contradicts a pharmacological study with the Kv1.3 blocker PAP-1 in diabetic mice (61). Differences in experimental procedure may explain the differences between our data and the latter study (61); they measured peripheral insulin sensitivity in ob/ob mice on a normal chow diet, whereas we did these studies in mice on an obesity-inducing diet. Second, Straub et al. (61) administered PAP-1 for 5 d, and the insulin tolerance test done on the sixth day showed no increase in peripheral insulin sensitivity (61). We detected heightened peripheral insulin sensitivity in mice that had received the obesity-inducing diet and ShK-186 or vehicle for 10 wk.
In visceral WAT from mice fed an obesity diet, ∼60% of cells in the stromal vascular fraction are T cells (62–64). These cells are mainly CD4+ and CD8+ effector memory T (TEM) cells and contribute to obesity-associated inflammation of WAT (63, 64). Classically activated M1 macrophages within fat depots are also causally linked to the development of obesity-induced adipose tissue inflammation and insulin resistance (65–71). Importantly, Kv1.3 regulates membrane potential and calcium signaling in TEM cells, and ShK-186 suppresses cytokine production, proliferation, and in vivo migration and activation of these cells (16–21). Kv1.3 channels also play a critical role in macrophages, and Kv1.3 blockers suppress cytokine production and cholesterol accumulation in macrophages (22–25, 72, 73). Thus, ShK-186 may mute obesity-associated inflammation of visceral WAT. In support, the obesity diet induced a significant increase in TNFα mRNA levels in visceral WAT compared with mice on the chow diet, and ShK-186 therapy reduced TNFα mRNA to levels found in chow-fed mice, consistent with suppression of obesity-dependent adipose tissue inflammation. This immunomodulatory effect may contribute to the differential effectiveness of ShK-186 in mice fed the chow vs. the obesity diet.
In summary, ShK-186 is a potent suppressant of obesity and insulin resistance in a diet-induced obesity mouse model. The potency of ShK-186’s antiobesity effect is evident in the effect of 20 μg/kg ShK-186, a dose allometrically equivalent to 1–2 μg/kg in humans. Despite the multiorgan effects of ShK-186, the peptide has an excellent safety profile in rodents and nonhuman primates following repeat-dose administration for a month (15–20). PAP-1, another Kv1.3 blocker, is also well tolerated by monkeys and rats administered the compound once daily for 1 and 6 mo, respectively (20, 74). Due to its selective immunomodulatory action on TEM cells, ShK-186 is not a generalized immunosuppressant and hence does not compromise the protective immune response to acute viral and bacterial infections (17, 18). ShK-186 is being developed as a therapy for autoimmune diseases and was well tolerated in a recently completed human phase 1A safety trial. Our results suggest a new use for ShK-186 as a therapeutic for obesity and insulin resistance in humans.
Materials and Methods
Animals and Diet.
C57BL6/J mice aged 8–9 wk were obtained from Harlan Laboratories and started on an obesity-inducing diet or a chow diet (SI Materials and Methods). Access to food and fluid was ad libitum. They were maintained on 12-h dark/light cycles. The Institutional Animal Use and Care Committee at the University of California, Irvine, approved all of the studies.
Other Methods.
Details are provided in SI Materials and Methods.
Supplementary Material
Acknowledgments
The present study on Kv1.3 blockers as therapy for metabolic syndrome, and the studies leading up to it, were inspired by Rahul Cherian's insistence that we look beyond the mere publication of scientific papers and provide tangible solutions for human health. We thank Dr. Jia-Ying John Yang for help setting up the animal model of obesity; Dr. Saurabh Sahar for help in qPCR experiments; Drs. Elizabeth Morin-Kensicki and Janice Jones at Metabolon for performing the metabolite quantitation and analysis; and Drs. Heike Wulff and Janice Jones for critical comments about the manuscript. Milliplex metabolic hormone assays were performed by JoAnn Yee and staff at the Pathogen Detection Laboratory, California National Primate Center, University of California, Davis. Blood lipids and insulin levels were measured by Marian Derby and the staff at the Comparative Pathology Laboratory, School of Veterinary Medicine, University of California, Davis. Support for this work was provided by National Institutes of Health (NIH) Grants R01 NS48252 (to K.G.C.), R21 DK092917 (to J.M.), and R01 HL096987 (to P.H.W.); NIH National Research Service Award F32 DK083881 (to K.L.E.-M.); a bridge fund from the University of California, Irvine; National Center for Research Resources contract HHSN268201000052C (S.I. and K.G.C.); the Ko Family Foundation, which provided funds for 2-DIGE-MS equipment; and Metabolon for metabolite profiling and CLAMS measurements and analysis (P.S.-C.).
Footnotes
Conflict of interest statement: S.K.U., K.L.E.-M., M.R.M., S.I., P.H.W., P.S.-C., J.M., and K.G.C. are coinventors of a patent on ShK-186 and obesity filed by the University of California and licensed to Kineta, Inc. S.I. is the Chief Scientific Officer of Kineta, Inc. K.G.C. owns stock options (<5%) in Kineta, Inc.
*This Direct Submission article had a prearranged editor.
This article contains supporting information online at www.pnas.org/lookup/suppl/doi:10.1073/pnas.1221206110/-/DCSupplemental.
References
- 1.Flegal KM, Carroll MD, Ogden CL, Curtin LR. Prevalence and trends in obesity among US adults, 1999–2008. JAMA. 2010;303(3):235–241. doi: 10.1001/jama.2009.2014. [DOI] [PubMed] [Google Scholar]
- 2.Dudina A, et al. SCORE investigators Relationships between body mass index, cardiovascular mortality, and risk factors: A report from the SCORE investigators. Eur J Cardiovasc Prev Rehabil. 2011;18(5):731–742. doi: 10.1177/1741826711412039. [DOI] [PubMed] [Google Scholar]
- 3.Huang ES, Basu A, O’Grady M, Capretta JC. Projecting the future diabetes population size and related costs for the U.S. Diabetes Care. 2009;32(12):2225–2229. doi: 10.2337/dc09-0459. [DOI] [PMC free article] [PubMed] [Google Scholar]
- 4.Xu J, et al. The voltage-gated potassium channel Kv1.3 regulates energy homeostasis and body weight. Hum Mol Genet. 2003;12(5):551–559. doi: 10.1093/hmg/ddg049. [DOI] [PubMed] [Google Scholar]
- 5.Tucker K, Overton JM, Fadool DA. Diet-induced obesity resistance of Kv1.3−/− mice is olfactory bulb dependent. J Neuroendocrinol. 2012;24(8):1087–1095. doi: 10.1111/j.1365-2826.2012.02314.x. [DOI] [PMC free article] [PubMed] [Google Scholar]
- 6.Li Y, Wang P, Xu J, Desir GV. Voltage-gated potassium channel Kv1.3 regulates GLUT4 trafficking to the plasma membrane via a Ca2+-dependent mechanism. Am J Physiol Cell Physiol. 2006;290(2):C345–C351. doi: 10.1152/ajpcell.00091.2005. [DOI] [PubMed] [Google Scholar]
- 7.Xu J, et al. The voltage-gated potassium channel Kv1.3 regulates peripheral insulin sensitivity. Proc Natl Acad Sci USA. 2004;101(9):3112–3117. doi: 10.1073/pnas.0308450100. [DOI] [PMC free article] [PubMed] [Google Scholar]
- 8.Tucker K, Overton JM, Fadool DA. Kv1.3 gene-targeted deletion alters longevity and reduces adiposity by increasing locomotion and metabolism in melanocortin-4 receptor-null mice. Int J Obes (Lond) 2008;32(8):1222–1232. doi: 10.1038/ijo.2008.77. [DOI] [PMC free article] [PubMed] [Google Scholar]
- 9.Fadool DA, Tucker K, Pedarzani P. Mitral cells of the olfactory bulb perform metabolic sensing and are disrupted by obesity at the level of the Kv1.3 ion channel. PLoS ONE. 2011;6(9):e24921. doi: 10.1371/journal.pone.0024921. [DOI] [PMC free article] [PubMed] [Google Scholar]
- 10.Tucker KR, Godbey SJ, Thiebaud N, Fadool DA. Olfactory ability and object memory in three mouse models of varying body weight, metabolic hormones, and adiposity. Physiol Behav. 2012;107(3):424–432. doi: 10.1016/j.physbeh.2012.09.007. [DOI] [PMC free article] [PubMed] [Google Scholar]
- 11.Tschritter O, et al. A new variant in the human Kv1.3 gene is associated with low insulin sensitivity and impaired glucose tolerance. J Clin Endocrinol Metab. 2006;91(2):654–658. doi: 10.1210/jc.2005-0725. [DOI] [PubMed] [Google Scholar]
- 12.Yang JY, Yeh HY, Lin K, Wang PH. Insulin stimulates Akt translocation to mitochondria: Implications on dysregulation of mitochondrial oxidative phosphorylation in diabetic myocardium. J Mol Cell Cardiol. 2009;46(6):919–926. doi: 10.1016/j.yjmcc.2009.02.015. [DOI] [PMC free article] [PubMed] [Google Scholar]
- 13.Meek TH, Eisenmann JC, Garland TR., Jr Western diet increases wheel running in mice selectively bred for high voluntary wheel running. Int J Obes (Lond) 2010;34(6):960–969. doi: 10.1038/ijo.2010.25. [DOI] [PubMed] [Google Scholar]
- 14.Johnson RJ, Sanchez-Lozada LG, Nakagawa T. The effect of fructose on renal biology and disease. J Am Soc Nephrol. 2010;21(12):2036–2039. doi: 10.1681/ASN.2010050506. [DOI] [PubMed] [Google Scholar]
- 15.Lustig RH. Fructose: Metabolic, hedonic, and societal parallels with ethanol. J Am Diet Assoc. 2010;110(9):1307–1321. doi: 10.1016/j.jada.2010.06.008. [DOI] [PubMed] [Google Scholar]
- 16.Chi V, et al. Development of a sea anemone toxin as an immunomodulator for therapy of autoimmune diseases. Toxicon. 2012;59(4):529–546. doi: 10.1016/j.toxicon.2011.07.016. [DOI] [PMC free article] [PubMed] [Google Scholar]
- 17.Tarcha EJ, et al. Durable pharmacological responses from the peptide ShK-186, a specific Kv1.3 channel inhibitor that suppresses T cell mediators of autoimmune disease. J Pharmacol Exp Ther. 2012;342(3):642–653. doi: 10.1124/jpet.112.191890. [DOI] [PMC free article] [PubMed] [Google Scholar]
- 18.Matheu MP, et al. Imaging of effector memory T cells during a delayed-type hypersensitivity reaction and suppression by Kv1.3 channel block. Immunity. 2008;29(4):602–614. doi: 10.1016/j.immuni.2008.07.015. [DOI] [PMC free article] [PubMed] [Google Scholar]
- 19.Cahalan MD, Chandy KG. The functional network of ion channels in T lymphocytes. Immunol Rev. 2009;231(1):59–87. doi: 10.1111/j.1600-065X.2009.00816.x. [DOI] [PMC free article] [PubMed] [Google Scholar]
- 20.Beeton C, et al. Kv1.3 channels are a therapeutic target for T cell-mediated autoimmune diseases. Proc Natl Acad Sci USA. 2006;103(46):17414–17419. doi: 10.1073/pnas.0605136103. [DOI] [PMC free article] [PubMed] [Google Scholar]
- 21.Beeton C, et al. Targeting effector memory T cells with a selective peptide inhibitor of Kv1.3 channels for therapy of autoimmune diseases. Mol Pharmacol. 2005;67(4):1369–1381. doi: 10.1124/mol.104.008193. [DOI] [PMC free article] [PubMed] [Google Scholar]
- 22.Vicente R, et al. Differential voltage-dependent K+ channel responses during proliferation and activation in macrophages. J Biol Chem. 2003;278(47):46307–46320. doi: 10.1074/jbc.M304388200. [DOI] [PubMed] [Google Scholar]
- 23.Vicente R, et al. Association of Kv1.5 and Kv1.3 contributes to the major voltage-dependent K+ channel in macrophages. J Biol Chem. 2006;281(49):37675–37685. doi: 10.1074/jbc.M605617200. [DOI] [PubMed] [Google Scholar]
- 24.Yang XF, et al. The antibody targeting the E314 peptide of human Kv1.3 pore region serves as a novel, potent and specific channel blocker. PLoS ONE. 2012;7(4):e36379. doi: 10.1371/journal.pone.0036379. [DOI] [PMC free article] [PubMed] [Google Scholar]
- 25.Yang Y, et al. Specific Kv1.3 blockade modulates key cholesterol-metabolism-associated molecules in human macrophages exposed to ox-LDL. J Lipid Res. 2013;54(1):34–43. doi: 10.1194/jlr.M023846. [DOI] [PMC free article] [PubMed] [Google Scholar]
- 26.Gut P, et al. Whole-organism screening for gluconeogenesis identifies activators of fasting metabolism. Nat Chem Biol. 2013;9(2):97–104. doi: 10.1038/nchembio.1136. [DOI] [PMC free article] [PubMed] [Google Scholar]
- 27.Boss O, Farmer SR. Recruitment of brown adipose tissue as a therapy for obesity-associated diseases. Front Endocrinol (Lausanne) 2012;3:14. doi: 10.3389/fendo.2012.00014. [DOI] [PMC free article] [PubMed] [Google Scholar]
- 28.Cannon B, Nedergaard J. Brown adipose tissue: Function and physiological significance. Physiol Rev. 2004;84(1):277–359. doi: 10.1152/physrev.00015.2003. [DOI] [PubMed] [Google Scholar]
- 29.Clapham JC, Arch JR. Thermogenic and metabolic antiobesity drugs: Rationale and opportunities. Diabetes Obes Metab. 2007;9(3):259–275. doi: 10.1111/j.1463-1326.2006.00608.x. [DOI] [PubMed] [Google Scholar]
- 30.Clapham JC, Arch JR. Targeting thermogenesis and related pathways in anti-obesity drug discovery. Pharmacol Ther. 2011;131(3):295–308. doi: 10.1016/j.pharmthera.2011.04.004. [DOI] [PubMed] [Google Scholar]
- 31.Farmer SR. Obesity: Be cool, lose weight. Nature. 2009;458(7240):839–840. doi: 10.1038/458839a. [DOI] [PubMed] [Google Scholar]
- 32.Fedorenko A, Lishko PV, Kirichok Y. Mechanism of fatty-acid-dependent UCP1 uncoupling in brown fat mitochondria. Cell. 2012;151(2):400–413. doi: 10.1016/j.cell.2012.09.010. [DOI] [PMC free article] [PubMed] [Google Scholar]
- 33.Zhu J, Yan J, Thornhill WB. N-glycosylation promotes the cell surface expression of Kv1.3 potassium channels. FEBS J. 2012;279(15):2632–2644. doi: 10.1111/j.1742-4658.2012.08642.x. [DOI] [PubMed] [Google Scholar]
- 34.Lee SC, Nuccitelli R, Pappone PA. Adrenergically activated Ca2+ increases in brown fat cells: Effects of Ca2+, K+, and K channel block. Am J Physiol. 1993;264(1 Pt 1):C217–C228. doi: 10.1152/ajpcell.1993.264.1.C217. [DOI] [PubMed] [Google Scholar]
- 35.Lucero MT, Pappone PA. Voltage-gated potassium channels in brown fat cells. J Gen Physiol. 1989;93(3):451–472. doi: 10.1085/jgp.93.3.451. [DOI] [PMC free article] [PubMed] [Google Scholar]
- 36.Lucero MT, Pappone PA. Membrane responses to norepinephrine in cultured brown fat cells. J Gen Physiol. 1990;95(3):523–544. doi: 10.1085/jgp.95.3.523. [DOI] [PMC free article] [PubMed] [Google Scholar]
- 37.Pappone PA, Lucero MT. Potassium channel block does not affect metabolic responses of brown fat cells. Am J Physiol. 1992;262(3 Pt 1):C678–C681. doi: 10.1152/ajpcell.1992.262.3.C678. [DOI] [PubMed] [Google Scholar]
- 38.Pappone PA, Ortiz-Miranda SI. Blockers of voltage-gated K channels inhibit proliferation of cultured brown fat cells. Am J Physiol. 1993;264(4 Pt 1):C1014–C1019. doi: 10.1152/ajpcell.1993.264.4.C1014. [DOI] [PubMed] [Google Scholar]
- 39.Wilson SM, Lee SC, Shook S, Pappone PA. ATP and beta-adrenergic stimulation enhance voltage-gated K current inactivation in brown adipocytes. Am J Physiol Cell Physiol. 2000;279(6):C1847–C1858. doi: 10.1152/ajpcell.2000.279.6.C1847. [DOI] [PubMed] [Google Scholar]
- 40.DeCoursey TE, Chandy KG, Gupta S, Cahalan MD. Voltage-gated K+ channels in human T lymphocytes: A role in mitogenesis? Nature. 1984;307(5950):465–468. doi: 10.1038/307465a0. [DOI] [PubMed] [Google Scholar]
- 41.Chandy KG, DeCoursey TE, Cahalan MD, McLaughlin C, Gupta S. Voltage-gated potassium channels are required for human T lymphocyte activation. J Exp Med. 1984;160(2):369–385. doi: 10.1084/jem.160.2.369. [DOI] [PMC free article] [PubMed] [Google Scholar]
- 42.Girardier L, Seydoux J, Clausen T. Membrane potential of brown adipose tissue. A suggested mechanism for the regulation of thermogenesis. J Gen Physiol. 1968;52(6):925–940. doi: 10.1085/jgp.52.6.925. [DOI] [PMC free article] [PubMed] [Google Scholar]
- 43.Girardier L, Schneider-Picard G. Alpha and beta-adrenergic mediation of membrane potential changes and metabolism in rat brown adipose tissue. J Physiol. 1983;335:629–641. doi: 10.1113/jphysiol.1983.sp014555. [DOI] [PMC free article] [PubMed] [Google Scholar]
- 44.Horwitz BA, Horowitz JM, Jr, Smith RE. Norepinephrine-induced depolarization of brown fat cells. Proc Natl Acad Sci USA. 1969;64(1):113–120. doi: 10.1073/pnas.64.1.113. [DOI] [PMC free article] [PubMed] [Google Scholar]
- 45.Fergus DJ, Martens JR, England SK. Kv channel subunits that contribute to voltage-gated K+ current in renal vascular smooth muscle. Pflugers Arch. 2003;445(6):697–704. doi: 10.1007/s00424-002-0994-7. [DOI] [PubMed] [Google Scholar]
- 46.Albarwani S, et al. Voltage-gated K+ channels in rat small cerebral arteries: Molecular identity of the functional channels. J Physiol. 2003;551(Pt 3):751–763. doi: 10.1113/jphysiol.2003.040014. [DOI] [PMC free article] [PubMed] [Google Scholar]
- 47.Thorneloe KS, et al. Molecular composition of 4-aminopyridine-sensitive voltage-gated K(+) channels of vascular smooth muscle. Circ Res. 2001;89(11):1030–1037. doi: 10.1161/hh2301.100817. [DOI] [PubMed] [Google Scholar]
- 48.Cidad P, et al. Characterization of ion channels involved in the proliferative response of femoral artery smooth muscle cells. Arterioscler Thromb Vasc Biol. 2010;30(6):1203–1211. doi: 10.1161/ATVBAHA.110.205187. [DOI] [PubMed] [Google Scholar]
- 49.Cheong A, et al. Potent suppression of vascular smooth muscle cell migration and human neointimal hyperplasia by KV1.3 channel blockers. Cardiovasc Res. 2011;89(2):282–289. doi: 10.1093/cvr/cvq305. [DOI] [PMC free article] [PubMed] [Google Scholar]
- 50.Cidad P, et al. Kv1.3 channels can modulate cell proliferation during phenotypic switch by an ion-flux independent mechanism. Arterioscler Thromb Vasc Biol. 2012;32(5):1299–1307. doi: 10.1161/ATVBAHA.111.242727. [DOI] [PubMed] [Google Scholar]
- 51.Cheong A, Dedman AM, Xu SZ, Beech DJ. K(V)alpha1 channels in murine arterioles: Differential cellular expression and regulation of diameter. Am J Physiol Heart Circ Physiol. 2001;281(3):H1057–H1065. doi: 10.1152/ajpheart.2001.281.3.H1057. [DOI] [PubMed] [Google Scholar]
- 52.Doczi MA, Morielli AD, Damon DH. Kv1.3 channels in postganglionic sympathetic neurons: Expression, function, and modulation. Am J Physiol Regul Integr Comp Physiol. 2008;295(3):R733–R740. doi: 10.1152/ajpregu.00077.2008. [DOI] [PMC free article] [PubMed] [Google Scholar]
- 53.Cypess AM, et al. Cold but not sympathomimetics activates human brown adipose tissue in vivo. Proc Natl Acad Sci USA. 2012;109(25):10001–10005. doi: 10.1073/pnas.1207911109. [DOI] [PMC free article] [PubMed] [Google Scholar]
- 54.Cypess AM, et al. Identification and importance of brown adipose tissue in adult humans. N Engl J Med. 2009;360(15):1509–1517. doi: 10.1056/NEJMoa0810780. [DOI] [PMC free article] [PubMed] [Google Scholar]
- 55.van Marken Lichtenbelt WD, et al. Cold-activated brown adipose tissue in healthy men. N Engl J Med. 2009;360(15):1500–1508. doi: 10.1056/NEJMoa0808718. [DOI] [PubMed] [Google Scholar]
- 56.Virtanen KA, et al. Functional brown adipose tissue in healthy adults. N Engl J Med. 2009;360(15):1518–1525. doi: 10.1056/NEJMoa0808949. [DOI] [PubMed] [Google Scholar]
- 57.Au-Yong IT, Thorn N, Ganatra R, Perkins AC, Symonds ME. Brown adipose tissue and seasonal variation in humans. Diabetes. 2009;58(11):2583–2587. doi: 10.2337/db09-0833. [DOI] [PMC free article] [PubMed] [Google Scholar]
- 58.Vijgen GH, et al. Increase in brown adipose tissue activity after weight loss in morbidly obese subjects. J Clin Endocrinol Metab. 2012;97(7):E1229–E1233. doi: 10.1210/jc.2012-1289. [DOI] [PubMed] [Google Scholar]
- 59.Vijgen GH, et al. Brown adipose tissue in morbidly obese subjects. PLoS ONE. 2011;6(2):e17247. doi: 10.1371/journal.pone.0017247. [DOI] [PMC free article] [PubMed] [Google Scholar]
- 60.Carey AL, et al. Ephedrine activates brown adipose tissue in lean but not obese humans. Diabetologia. 2013;56(1):147–155. doi: 10.1007/s00125-012-2748-1. [DOI] [PubMed] [Google Scholar]
- 61.Straub SV, et al. Pharmacological inhibition of Kv1.3 fails to modulate insulin sensitivity in diabetic mice or human insulin-sensitive tissues. Am J Physiol Endocrinol Metab. 2011;301(2):E380–E390. doi: 10.1152/ajpendo.00076.2011. [DOI] [PubMed] [Google Scholar]
- 62.Yang H, et al. Obesity increases the production of proinflammatory mediators from adipose tissue T cells and compromises TCR repertoire diversity: Implications for systemic inflammation and insulin resistance. J Immunol. 2010;185(3):1836–1845. doi: 10.4049/jimmunol.1000021. [DOI] [PMC free article] [PubMed] [Google Scholar]
- 63.Vandanmagsar B, et al. The NLRP3 inflammasome instigates obesity-induced inflammation and insulin resistance. Nat Med. 2011;17(2):179–188. doi: 10.1038/nm.2279. [DOI] [PMC free article] [PubMed] [Google Scholar]
- 64.Kanneganti TD, Dixit VD. Immunological complications of obesity. Nat Immunol. 2012;13(8):707–712. doi: 10.1038/ni.2343. [DOI] [PubMed] [Google Scholar]
- 65.Lumeng CN, Bodzin JL, Saltiel AR. Obesity induces a phenotypic switch in adipose tissue macrophage polarization. J Clin Invest. 2007;117(1):175–184. doi: 10.1172/JCI29881. [DOI] [PMC free article] [PubMed] [Google Scholar]
- 66.Nishimura SI, et al. CD8+ effector T cells contribute to macrophage recruitment and adipose tissue inflammation in obesity. Nat Med. 2009;15(8):914–920. doi: 10.1038/nm.1964. [DOI] [PubMed] [Google Scholar]
- 67.Wen H, Ting JP, O’Neill LA. A role for the NLRP3 inflammasome in metabolic diseases—did Warburg miss inflammation? Nat Immunol. 2012;13(4):352–357. doi: 10.1038/ni.2228. [DOI] [PMC free article] [PubMed] [Google Scholar]
- 68.Henao-Mejia J, et al. Inflammasome-mediated dysbiosis regulates progression of NAFLD and obesity. Nature. 2012;482(7384):179–185. doi: 10.1038/nature10809. [DOI] [PMC free article] [PubMed] [Google Scholar]
- 69.Stienstra R, et al. Inflammasome is a central player in the induction of obesity and insulin resistance. Proc Natl Acad Sci USA. 2011;108(37):15324–15329. doi: 10.1073/pnas.1100255108. [DOI] [PMC free article] [PubMed] [Google Scholar]
- 70.Tack CJ, Stienstra R, Joosten LA, Netea MG. Inflammation links excess fat to insulin resistance: The role of the interleukin-1 family. Immunol Rev. 2012;249(1):239–252. doi: 10.1111/j.1600-065X.2012.01145.x. [DOI] [PubMed] [Google Scholar]
- 71.Stienstra R, et al. The inflammasome-mediated caspase-1 activation controls adipocyte differentiation and insulin sensitivity. Cell Metab. 2010;12(6):593–605. doi: 10.1016/j.cmet.2010.11.011. [DOI] [PMC free article] [PubMed] [Google Scholar]
- 72.Lian YT, et al. Curcumin serves as a human Kv1.3 blocker to inhibit effector memory T lymphocyte activities. Phytother Res. 2012 doi: 10.1002/ptr.4863. [DOI] [PubMed] [Google Scholar]
- 73.Shao W, et al. Curcumin prevents high fat diet induced insulin resistance and obesity via attenuating lipogenesis in liver and inflammatory pathway in adipocytes. PLoS ONE. 2012;7(1):e28784. doi: 10.1371/journal.pone.0028784. [DOI] [PMC free article] [PubMed] [Google Scholar]
- 74.Pereira LE, et al. Pharmacokinetics, toxicity, and functional studies of the selective Kv1.3 channel blocker 5-(4-phenoxybutoxy)psoralen in rhesus macaques. Exp Biol Med (Maywood) 2007;232(10):1338–1354. doi: 10.3181/0705-RM-148. [DOI] [PMC free article] [PubMed] [Google Scholar]
Associated Data
This section collects any data citations, data availability statements, or supplementary materials included in this article.


