

Abstract
Optode-based fluorescent nanosensors are being developed for monitoring important diseased states such as hyponatremia and diabetes. However, traditional optode-based sensors are composed of nonbiodegradable polymers such as polyvinyl chloride (PVC) raising toxicity concerns for long-term in vivo use. Here, we report the development of the first biodegradable optode-based nanosensors that maintain sensing characteristics identical to traditional optode sensors. The polymer matrix of these sensors is composed of polycaprolactone (PCL) and a citric acid ester plasticizer. The PCL-based nanosensors yielded a dynamic and reversible response to sodium, were tuned to respond to extracellular sodium concentrations, and had a lifetime of at least 14 days at physiological temperature. When in the presence of lipase, the nanosensors degraded within 4 hours at lipase concentrations found in the liver but were present after 3 days at lipase concentrations found in serum. This development of biodegradable nanosensors is not only necessary for future in vivo applications, but it has also created a new sensor platform that can be extended to other sensing mechanisms such as for small molecules or enzymes.
INTRODUCTION
Optode sensors, the optical counterpart to ion-selective electrodes, have been developed to measure a range of ions such as sodium,1 potassium,2 and calcium3 and small molecules such as glucose.4–5 Miniaturization of optode sensors into micro and nanosensors has further improved their spatial resolution and response time to changes in analyte concentrations.6–14 For example, nanosensors have measured the rate of calcium release during the mitochondrial permeability transition6 and detected sodium sparks from ion channel clusters in cardiac myocytes.15 Recently, applications for optode-based sensors have extended from intracellular measurements to longitudinal in vivo monitoring for diseased states such as hyponatremia and diabetes.11, 16–18 For example, the Gratzl group has developed sliver sensors for monitoring analytes such as glucose in the skin.17–18 The clinical monitoring system proposed by our group involves injecting nanosensors into the upper layers of the skin, similar to a tattoo, and then monitoring changes in the fluorescence of the sensors using a handheld optical reader. In initial animal studies, subcutaneously-injected nanosensors tracked changes in extracellular sodium and glucose concentrations;11, 16 however, diffusion of the nanosensors away from the site of injection raised concerns regarding their long-term safety.
Limited studies have been performed on intradermal exposure of nanoparticles19 and toxicological effects of nanoparticles is dependent upon multiple parameters (i.e. size, material, and surface coating).20–22 In previous nanosensor in vivo studies, all of the sensing components were entrapped in a sebacate plasticizer and PVC-based particle.11, 16 Though both of these components have been used in medical grade products and exhibit low toxicity, plasticizer leaching and known carcinogenic effects of vinyl chloride have caused rising safety concerns associated with plasticized PVC in medical devices.23–24 Plasticizer-free ion-selective electrodes25–26 and optode sensors27 have been developed to minimize the effect of plasticizer leaching on sensor lifetime and adverse biological responses. In this work, we report the development of the first biodegradable optode-based nanosensors. Therefore when applied in vivo, the nanosensors will ultimately be degraded and cleared from the body regardless of their in vivo fate minimizing long-term toxicity. Sodium sensors were selected for proof of concept for two reasons. First, clinically, hyponatremia affects 30% of elderly patients in nursing homes28 and leads to gait disturbances and increased risk of falls in this population;29 however, unlike glucose monitors, no at-home sodium monitoring system exists. Second, the sodium sensing mechanism is well understood and mathematically described in the ion-selective optode field and will provide a robust model system for investigation into new sensor designs.30–32 Briefly, the mechanism involves three main components: a neutral ionophore, a neutral chromoionophore, and a negatively charged additive. When no sodium is present within the system, the chromoionophore is protonated while the negative additive provides charge neutrality within the sensor. As sodium is introduced, the ionophore extracts sodium into the sensor and the chromoionophore deprotonates resulting in a change of fluorescence signal. Based on the changes in signal intensity, the sodium concentration can be determined and sensor response tailored by changing the ratio of components. The biodegradable nanosensors developed here are composed of polycaprolactone (PCL) and citric acid based plasticizer and retain characteristics traditional to optode sensors.
EXPERIMENTAL SECTION
Materials
Sodium ionophore X (NaIX), sodium tetrakis[3,5-bis(trifluoromethyl)phenyl] borate (NaTFPB), and chromoionophore III (CHIII) were all purchased from Fluka (St. Louis, MO). PCL (Mn- ~14,000) was acquired from Aldrich (St. Louis, MO) and sodium chloride (NaCl), 4-(2-hydroxyethyl)piperazine-1-ethanesulfonic acid N-(2-hydroxyethyl)piperazine-N′-(2-ethanesulfonic acid) (HEPES), and polyoxyethylene-polyoxyproplene block copolymer (Pluronic® F-68) were purchased from Sigma (St. Louis, MO). Acetyltri-n-hexyl citrate (Citroflex A-6) was acquired from Vertellus (Indianapolis, IN). 1,2-disteroyl-sn-glycero-3-phosphoethanolamine-N-[methoxy(polyethylene glycol)-550] ammonium salt in chloroform (PEG 550) was purchased from Avanti Polar Lipids (Alabaster, AL) and acetone (≥ 99.5%) was acquired from Sigma-Aldrich (St. Louis, MO). Spectra/Por® In Vivo Microdialysis Hollow Fibers (Inner diameter: 200 μm, Outer diameter: 280 μm, Molecular Weight Cut-Off: 13 kilodaltons) was purchased from Spectrum Laboratories, Inc. (Rancho Dominguez, CA) and phosphate buffered saline (PBS, pH=7.4) was purchased from Life Technologies (Grand Island, NY). As provided by the manufacturer, the composition of PBS was 1.06 mM potassium phosphate monobasic, 155.17 mM sodium chloride, and 2.97 mM sodium phosphate dibasic.
Nanosensor Formulation and Fabrication
Prior to nanosensor fabrication, all sensor components were combined into an optode cocktail: 60.1mg Citroflex A-6, 30mg PCL, 0.1mg (1.11mmol kg−1) NaIX, 0.4mg (4.98mmol kg−1) NaTFPB, and 0.1mg (1.93mmol kg−1) CHIII dissolved in 3mL of acetone. This ratio of sensing components was selected based on their tailored response to sodium at physiological extracellular sodium concentrations (135–145 mM).33 Additional optode cocktails containing 90.3mg Citroflex A-6 or 90 mg PCL both with the same ratio of sensing components were used as controls in the nanosensor degradation experiments. Sodium nanosensors were fabricated using a solvent displacement method derived from previously developed methods.34–35 3mg of PEG 550 was dried onto the bottom of a 2 dram glass vial and then dissolved in 600 μL deionized water. While stirring the PEG 550/water mixture, 300 μL of optode cocktail was pipette injected into the mixture and then allowed to stir for 10 minutes. After this time, the sensor solution was centrifuged at 12,600 g for 20 minutes (Micromax RF Refrigerated Microcentrifuge, Thermo Electron Corporation, Milford, MA) and the supernatant was removed. The sensors were then washed two more times with 10mM HEPES (pH=7.4) and centrifuged at 12,600 g for 20 minutes. After the last wash, the sensors were resuspended in 10mM HEPES for characterization. This fabrication method could be scaled-up to generate more sensors depending upon the desired application without loss of calibrated response (data not shown). For example, ten times the amount of sensors could be made by using 30mg PEG 550, 6 ml deionized water, and 3 ml of optode cocktail.
Nanosensor Characterization
Nanosensor Reversibility
Reversibility was determined by entrapping the nanosensors in Spectra/Por® In Vivo Microdialysis Hollow Fibers. These fibers have a specified inner diameter of 200 μm and a molecular cut-off of 13 kD thus allowing the diffusion of sodium ions and buffer into the fiber while maintaining the nanosensors. Fibers were pre-filled with 20 mg/ml of Pluronic® F-68 in deionized water to prevent adhesion of nanosensors to the fiber walls and then filled with nanosensors. Fiber ends were sealed with epoxy and then glued onto glass coverslips attached to a microscope perfusion system. Images of the nanosensors while under perfusion were acquired on a Zeiss Confocal Microscope (Thornwood, NY). CHIII has three excitation and emission peaks (ex/em: 488 nm/570 nm, 488 nm/670 nm, 639 nm/680 nm). Sensors were imaged using the 488 nm and 639 nm lasers simultaneously to collect the emission intensities at the 570 nm and 680 nm peaks, respectively. The perfusion chamber was alternately filled with 0 mM and 500 mM of NaCl in 10 mM HEPES (pH=7.4) to measure fluorescence response and recovery of the sodium nanosensors. While under perfusion, images were acquired approximately every 11.6 seconds. Images were exported and analyzed using ImageJ software and Matlab. For all samples, an equal size rectangular region of interest containing only fluorescence was selected and all saturated and zero value pixels were removed prior to analysis. The results were not altered by removing the saturated and zero value pixels. The average fluorescence intensities for the 570 nm and 680 nm emission wavelengths were divided for each sample to get a ratio of the two wavelengths and error was calculated using the laws of error propagation.
Nanosensor Response
The response of the nanosensors to sodium was determined as follows. In a optical bottom 96-well plate, 100 μL of nanosensors were placed in wells along with 100 μL of the following solutions: 0 M, 0.020 M, 0.050 M, 0.1 M, 0.2 M, 0.240 M, 0.270 M, 0.290 M, 0.320 M, 0.380 M, 0.4 M, 0.5 M, 1 M, 2 M of NaCl in 10mM HEPES buffer solution (pH=7.4). As a result of mixing these concentrations of NaCl with the sensors, the total sodium concentration in each of the well is half as stated above. Each concentration was performed in triplicate from three different sets of nanosensors. Fluorescence endpoint measurements were only taken at the excitation and emission wavelengths of 640nm and 680nm, respectively, since emission intensities at the other two wavelengths are not high enough to provide adequate signal to noise. Fluorescence measurements were acquired on a Molecular Devices SpectraMax Gemini EM (Sunnyvale, CA). To determine the response of the sensors, the log of the concentration was plotted against α9:
where I[Na+] is the intensity of the sensors at a specific sodium concentration, I[Minimum] is the intensity at 1M NaCl and I[Maximum] is the intensity at 0 M NaCl sodium concentration. The error was determined from the raw fluorescence intensities according to the laws of error propagation. The center of the dynamic range (KD) was determined as the sodium concentration where α=0.5 and the sensitivity was calculated as the change in sodium concentration for a 1% change in normalized fluorescence signal. In addition, nanosensor response was measured while in the presence of a high background solution of potassium chloride (KCl), a common sodium sensor interferent. All NaCl solutions listed above were made in a 30 mM KCl in 10 mM HEPES solution (pH=7.4). The total KCl concentration in each well was 15 mM which is three times greater than extracellular KCl concentrations (3.5–5.0 mM).33 Each concentration was performed in triplicate for three different sets of nanosensors. Response of the nanosensors was determined similar to described above and a two-tailed student’s t-test was used to determine significant changes in response while in the presence of potassium ions.
Nanosensor Lifetime and Stability
Three parameters were used to determine the lifetime and stability of sodium nanosensors: calibrated response, size, and zeta potential. Each of these parameters was measured on Day 0, 3, 7, 10, and 14. Between measurements, the sensors were stored in an incubator at 37°C to mimic physiological conditions. At each time point, sensors were calibrated using the same conditions, solutions, and methods as described above. The size and zeta potential of the nanosensors was measured using a Brookhaven 90 Plus Particle Size Analyzer (Holtsville, NY). Sensors were diluted in PBS for all size and zeta measurements. The size was taken as the effective diameter that is derived from the measured intensity of the particles.
Scanning Electron Micrographs (SEM)
Nanosensors were diluted in deionized water and dried under vacuum on aluminum specimen mounts. We acquired images on a Hitachi S4800 at low accelerating voltages and did not coat the samples to prevent heat damage to the particles.
Nanosensor Degradation
PCL nanoparticles have been shown to be stable in buffer solution for over 140 days,34 but they are rapidly degraded in the presence of lipases.34, 36–40 Nanosensor degradation was tested in the presence of Pseudonamas lipase at 30 U/L,34 190 U/L,34 and 6,000 U/L representing low serum, high serum, and liver levels of lipase41 respectively. Since our particle is a two component system, degradation of nanosensors composed of 100% PCL and 100% Citroflex A-6 were also investigated along with our 2:1 Citroflex A-6: PCL nanosensors. Two independent parameters were used to evaluate degradation: fluorescence intensity in 0 mM NaCl and particle count rate. For fluorescence intensity, measurements were acquired on a Molecular Devices SpectraMax Gemini EM (Sunnyvale, CA) at excitation and emission wavelengths of 640 nm and 680 nm, respectively. In a 96-optical bottom well plate, 100 μL of nanosensors were mixed with 100 μL of 0 mM NaCl solution. Count rate was measured on a Brookhaven 90 Plus Particle Size Analyzer. Count rate is proportional to particle concentration and thus provides a relative change in particle concentration over time.15 Nanosensors in the absence of lipase acted as a control and initial measurements were acquired using a single control experiment (n=3). Further measurements were acquired at 4 hours, 8 hours, 28 hours, and 74 hours for the control and different lipase concentrations. In between measurements, nanosensors both in the presence and absence of lipase were stored at 37°C. Average fluorescence intensities and count rates were normalized and plotted over time to determine degradation of the nanosensors.
RESULTS AND DISCUSSION
Nanosensor Response Characteristics
As a substitute for PVC, PCL was chosen because it is a popular FDA-approved polymer with applications in sutures, scaffolds, and drug delivery devices.42 PCL is a hydrophobic aliphatic polyester that undergoes hydrolytic degradation either through bulk or surface erosion depending upon water penetration into the polymer.42 Furthermore, its rate of degradation is dependent upon molecular weight, pH, and shape.43–44 The plasticizer, Citroflex A-6, was selected as a replacement for DOS because citric acid esters are biodegradable and are used in medical plastics as a replacement for phthalates.45 Typically, response characteristics of the sensors such as the dynamic range and selectivity are primarily dictated by the incorporated sensing components and the polymer matrix is considered inert.46 However, extraction of analytes, leaching, and loading efficiency of the sensors are influenced by the polymer matrix which varies by hydrophobicity and charge depending upon the selection of matrix components.46–47 Therefore, response characteristics had to be evaluated for the biodegradable nanosensors even though their sensing mechanism is well-characterized.
The dynamic fluorescence response of the nanosensors was tested by encapsulating the nanosensors in hollow fiber dialysis tubing and attaching the tubing to a perfusion system (Figure 1). With increased sodium concentrations, the 570 nm emission peak increases in intensity (Figure 1A, Video S-1) and the 680 nm emission decreases in intensity (Figure 1B, Video S-2) as CHIII becomes deprotonated. Because of the dual emission response, the fluorescence intensity at each wavelength can be ratioed, increasing sensor sensitivity and minimizing the effects of photobleaching. Figure 1C shows the average ratioed fluorescence response of three sets of sodium nanosensors and their rapid fluorescence response and recovery to changes in sodium concentrations. From the response curve, the ratio changes by approximately 0.5 or 70% and the average response time of the sensors, as measured as the time it takes the sensors to reach 95% of their total response to sodium, is 48 seconds. This is the response time of the entire system and takes into account the perfusion time of solutions into the chamber, diffusion of sodium into the dialysis tubing, and response time of the sensors. Since extracellular sodium dynamics are expected to change on a slower timescale than intracellular dynamics, the measured response time is adequate for in vivo extracellular measurements.
Figure 1.
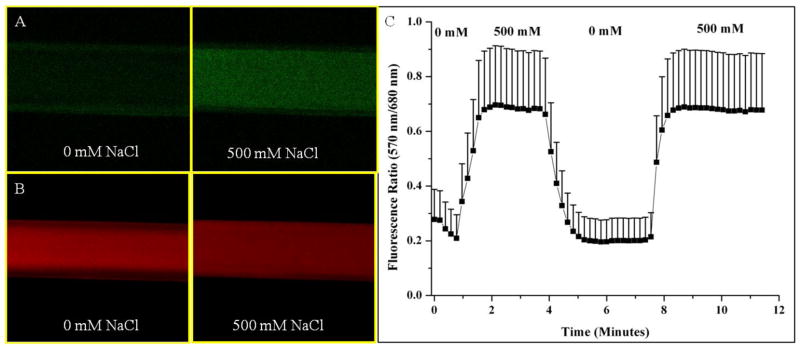
Fluorescence reversibility of biodegradable sodium nanosensors. Fluorescent confocal images of nanosensors in hollow fiber dialysis tubing at (A) 570 nm emission and (B) 680 nm emission for one set of nanosensors. (C) Reversibility of sodium nanosensors for two cycles. Emission intensities at 570 nm and 680 nm were ratioed at each time point. Error bars represent standard deviations from 3 individual sets of sodium nanosensors. Positive error bars are shown here for clarity, but error has a symmetrical distribution around the mean. Note: A ratio of fluorescence intensities is displayed instead of α.
Figure 2 shows the tailored response of the sodium nanosensors with a measured KD of 141 mM NaCl and sensitivity of 4.6 mM for a 1% change in fluorescence intensity. These values did not significantly shift (p >0.01 as determined from α values) when in the presence of over three times the extracellular potassium levels (15 mM KCl), a common sodium sensor interferent (Figure 2). Physiological concentrations of extracellular sodium are between 135 mM and 145 mM.33 Currently, the center of the dynamic range of our sensors falls within these values, but the sensors are not yet sensitive to accurately monitor sodium concentrations in this range. Future work will focus on improving the sensor sensitivity by tailoring the ratio of components. Additionally, the sensor is inherently susceptible to changes in pH. Therefore, monitoring pH independently or holding the pH constant is necessary for improved accuracy.9 For our particular application, measurement in the dermal space, pH is fairly constant, but our results could be easily confounded if particles are endocytosed and exposed to an acidic lysosomal environment. Figure 3 shows the lifetime and stability of the biodegradable nanosensors while in buffer solution at 37°C. The calibrated sensor response, size, and zeta potential remain stable over a 14 day time period. The average size of the nanosensors as determined using dynamic light scattering was 260±2.2 nm with an average polydispersity index (PdI) of 0.120±0.02. The presence of larger sensors was visible on SEM (Figure 4), but filtering techniques can be used to narrow the size distribution if desired.10
Figure 2.

Response curves of biodegradable sodium nanosensors with no interferent (■) and with 15 mM KCl background interferent solution (○). There was no significant change in response of the nanosensors to sodium while in the presence of KCl (p > 0.01). Measurements were taken in triplicate for three different sets of nanosensors (n=9). Error bars were calculated using the laws of error propagation.
Figure 3.
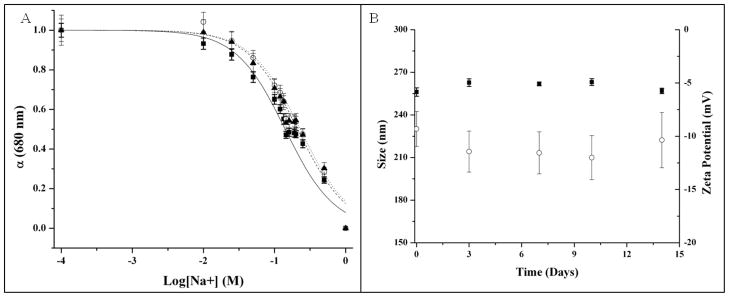
Lifetime and stability of biodegradable sodium nanosensors. (A) Response curves on Day 0 (—■—), Day 7 (--○--), and Day 14 (···▲···). Measurements were taken in triplicate for three different sets of nanosensors (n=9) and error bars were calculated using the laws of error propagation. (B) Average sizes (■) and zeta potentials (○) measured intermittently over the course of two weeks. Three samples were run from three individual sets of nanosensors. For each sample of nanosensors, 3 size measurements were made and five zeta potential measurements were made. Therefore, n=27 for size measurements and n=45 for zeta potential measurements. Error bars were calculated using the laws of error propagation.
Figure 4.
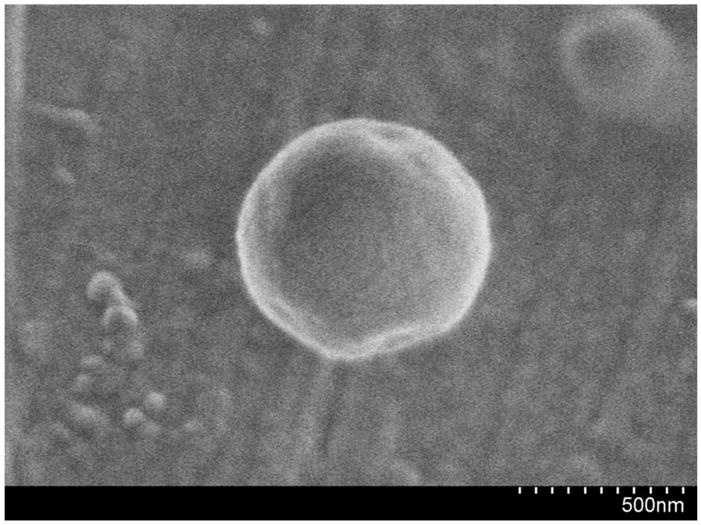
SEM micrograph of a biodegradable sodium nanosensor.
Biodegradation of Sodium Nanosensors
Once in vivo, the expected lifetime and stability of sodium nanosensors will decrease because of physiological and immune responses spurred by their injection. PCL was selected instead of poly(lactic-co-glycolic acid) (PLGA) because its degradation products do not alter the pH of the surrounding system and thus is not expected to alter sensor response.42 Since our nanosensor particle is a two component system, we investigated the individual degradation response of PCL and Citroflex A-6 independently. Nanosensors composed of only PCL showed both a decrease in fluorescence response and count rate over time (Figure 5). On the contrary, sensors composed of only Citroflex A-6 did not show a decrease in fluorescence intensity nor count rate (Figure 5). Figure 5 also shows the degradation response curves of 2:1 Citroflex A-6: PCL system in the presence of lipase. For all cases, the fluorescence intensity remained constant while the count rate decreased. Based on these results, the sensors had degraded, but the remaining plasticizer sequestered the sensing components resulting in no change in fluorescence intensity over time. Citrates are biodegradable esters45 and we expect that Citroflex A-6 also experienced biodegradation by the lipases, but this process could not be monitored using our current techniques. In the first 4 hours, the rate of decrease in count rate was similar at both high serum and liver lipase concentrations and slower at low serum levels. However, the degradation rate is expected to be faster in vivo because of optimal enzyme operating conditions and the presence of other degradation mechanisms.34
Figure 5.

Degradation profiles of sodium nanosensors composed of 100% PCL (■, □), 100% Citroflex A-6 (●,○), and 2:1 Citroflex A-6 to PCL (▲, △). Decreases in both fluorescence intensity (—, solid objects) and count rate (- - -, open objects) were used to assess degradation of sodium nanosensors while in the presence of (A) no lipase, (B) low serum concentrations of lipase (30 U/L), (C) high serum concentrations of lipase (190 U/L), and (D) liver lipase concentration (6,000 U/L). Averages of fluorescence intensity (n=6) and count rate (n=9) are shown with error bars calculated using the laws of error propagation.
CONCLUSIONS
We have designed biocompatible and biodegradable sodium nanosensors composed of PCL and Citroflex A-6. These sensors have favorable characteristics for in vivo applications such as fast and dynamic fluorescence response tailored to sodium levels. The sensors degrade in the presence of lipases with accelerated degradation rates at concentrations that would be found in the liver, a primary bioaccumulation site for nanoparticles. Future work will investigate the toxicity of the degraded nanosensor components including the active sensing components that will be released upon degradation. Though this system has been developed for sodium, the new sensor platform can be extended by exchanging the sensing components to monitor other analytes such as potassium and chloride, small molecules such as glucose, or even larger molecules such as enzymes.
Supplementary Material
Acknowledgments
We thank the IGERT Nanomedicine Science and Technology program at Northeastern University (funding from NCI and NSF grant DGE-0504331). Additional funding was also from NIH grant 5RO1GM084366 and the CIMIT Prize for Primary Healthcare. We would also like to thank Professor Mansoor Amiji, J. Matthew Dubach, Kevin J. Cash, and Timothy Ruckh for their technical guidance in preparing this manuscript and William Fowle for his help in acquiring the SEM micrographs.
References
- 1.Seiler K, Wang K, Bakker E, Morf WE, Rusterholz B, Spichiger UE, Simon W. Clin Chem (Washington, DC, US) 1991;37(8):1350–5. [PubMed] [Google Scholar]
- 2.Wang K, Seiler K, Morf WE, Spichiger UE, Simon W, Lindner E, Pungor E. Anal Sci. 1990;6(5):715. [Google Scholar]
- 3.Morf WE, Seiler K, Rusterholz B, Simon W. Anal Chem (Washington, DC, US) 1990;62(7):738–742. [Google Scholar]
- 4.Trettnak W, Wolfbeis OS. Anal Chim Acta. 1989;221(0):195–203. [Google Scholar]
- 5.Balaconis MK, Billingsley K, Dubach MJ, Cash KJ, Clark HA. Journal of Diabetes Science and Technology. 2011;5(1):68–75. doi: 10.1177/193229681100500110. [DOI] [PMC free article] [PubMed] [Google Scholar]
- 6.Clark HA, Hoyer M, Philbert MA, Kopelman R. Anal Chem (Washington, DC, US) 1999;71(21):4831–4836. doi: 10.1021/ac990629o. [DOI] [PubMed] [Google Scholar]
- 7.Clark HA, Kopelman R, Tjalkens R, Philbert MA. Anal Chem (Washington, DC, US) 1999;71(21):4837–4843. doi: 10.1021/ac990630n. [DOI] [PubMed] [Google Scholar]
- 8.Brasuel M, Kopelman R, Miller TJ, Tjalkens R, Philbert MA. Anal Chem (Washington, DC, US) 2001;73(10):2221–2228. doi: 10.1021/ac0012041. [DOI] [PubMed] [Google Scholar]
- 9.Shortreed M, Bakker E, Kopelman R. Anal Chem (Washington, DC, US) 1996;68(15):2656–2662. doi: 10.1021/ac960035a. [DOI] [PubMed] [Google Scholar]
- 10.Dubach JM, Harjes DI, Clark HA. Nano Lett. 2007;7(6):1827–1831. doi: 10.1021/nl0707860. [DOI] [PubMed] [Google Scholar]
- 11.Billingsley K, Balaconis MK, Dubach JM, Zhang N, Lim E, Francis KP, Clark HA. Anal Chem (Washington, DC, US) 2010;82(9):3707–3713. doi: 10.1021/ac100042e. [DOI] [PMC free article] [PubMed] [Google Scholar]
- 12.Xu H, Aylott JW, Kopelman R. Analyst (Cambridge, UK) 2002;127:1471–1477. doi: 10.1039/b202782h. [DOI] [PubMed] [Google Scholar]
- 13.Tsagkatakis I, Peper S, Retter R, Bell M, Bakker E. Anal Chem (Washington, DC, US) 2001;73(24):6083–6087. doi: 10.1021/ac010694+. [DOI] [PubMed] [Google Scholar]
- 14.Ozaydin-Ince G, Dubach JM, Gleason KK, Clark HA. Proc Natl Acad Sci U S A. 2011 doi: 10.1073/pnas.1015544108. [DOI] [PMC free article] [PubMed] [Google Scholar]
- 15.Dubach JM, Das S, Rosenzweig A, Clark HA. Proc Natl Acad Sci U S A. 2009;106(38):16145–50. doi: 10.1073/pnas.0905909106. [DOI] [PMC free article] [PubMed] [Google Scholar]
- 16.Dubach JM, Lim E, Zhang N, Francis KP, Clark HA. Integr Biol. 2011;3(2):142–148. doi: 10.1039/c0ib00020e. [DOI] [PubMed] [Google Scholar]
- 17.Tohda K, Gratzl M. ChemPhysChem. 2003;4(2):155–161. doi: 10.1002/cphc.200390025. [DOI] [PubMed] [Google Scholar]
- 18.Tohda K, Gratzl M. Anal Sci. 2006;22(3):383–388. doi: 10.2116/analsci.22.383. [DOI] [PubMed] [Google Scholar]
- 19.Gopee NV, Roberts DW, Webb P, Cozart CR, Siitonen PH, Warbritton AR, Yu WW, Colvin VL, Walker NJ, Howard PC. Toxicol Sci. 2007;98(1):249–257. doi: 10.1093/toxsci/kfm074. [DOI] [PMC free article] [PubMed] [Google Scholar]
- 20.Alexis F, Pridgen E, Molnar LK, Farokhzad OC. Mol Pharmaceutics. 2008;5(4):505–515. doi: 10.1021/mp800051m. [DOI] [PMC free article] [PubMed] [Google Scholar]
- 21.Dobrovolskaia MA, Aggarwal P, Hall JB, McNeil SE. Mol Pharmaceutics. 2008;5(4):487–495. doi: 10.1021/mp800032f. [DOI] [PMC free article] [PubMed] [Google Scholar]
- 22.Li M, Al-Jamal KT, Kostarelos K, Reineke J. ACS Nano. 2010;4(11):6303–6317. doi: 10.1021/nn1018818. [DOI] [PubMed] [Google Scholar]
- 23.Tickner JA, Schettler T, Guidotti T, McCally M, Rossi M. Am J Ind Med. 2001;39(1):100–111. doi: 10.1002/1097-0274(200101)39:1<100::aid-ajim10>3.0.co;2-q. [DOI] [PubMed] [Google Scholar]
- 24.Rahman M, Brazel CS. Prog Polym Sci. 2004;29(12):1223–1248. [Google Scholar]
- 25.Cha GS, Liu D, Meyerhoff ME, Cantor HC, Midgley AR, Goldberg HD, Brown RB. Anal Chem (Washington, DC, US) 1991;63(17):1666–1672. doi: 10.1021/ac00017a003. [DOI] [PubMed] [Google Scholar]
- 26.Heng LY, Hall EAH. Anal Chem (Washington, DC, US) 1999;72(1):42–51. doi: 10.1021/ac9904765. [DOI] [PubMed] [Google Scholar]
- 27.Peper S, Tsagkatakis I, Bakker E. Anal Chim Acta. 2001;442(1):25–33. [Google Scholar]
- 28.Schrier RW. Nat Rev Nephrol. 2010;6(4):185–185. doi: 10.1038/nrneph.2010.21. [DOI] [PubMed] [Google Scholar]
- 29.Renneboog B, Musch W, Vandemergel X, Manto MU, Decaux G. Am J Med. 2006;119(1):71.e1–71.e8. doi: 10.1016/j.amjmed.2005.09.026. [DOI] [PubMed] [Google Scholar]
- 30.Bakker E, Bühlmann P, Pretsch E. Chem Rev. 1997;97(8):3083–3132. doi: 10.1021/cr940394a. [DOI] [PubMed] [Google Scholar]
- 31.Johnson RD, Bachas LG. Anal Bioanal Chem. 2003;376(3):328–341. doi: 10.1007/s00216-003-1931-0. [DOI] [PubMed] [Google Scholar]
- 32.Bühlmann P, Pretsch E, Bakker E. Chem Rev. 1998;98(4):1593–1688. doi: 10.1021/cr970113+. [DOI] [PubMed] [Google Scholar]
- 33.Kimizuka T, Ozaki Y, Sumi Y. Ann Nucl Med. 2004;18(1):63–67. doi: 10.1007/BF02985616. [DOI] [PubMed] [Google Scholar]
- 34.Chawla JS, Amiji MM. Int J Pharm. 2002;249(1–2):127–138. doi: 10.1016/s0378-5173(02)00483-0. [DOI] [PubMed] [Google Scholar]
- 35.Espuelas MS, Legrand P, Irache JM, Gamazo C, Orecchioni AM, Devissaguet JP, Ygartua P. Int J Pharm. 1997;158(1):19–27. [Google Scholar]
- 36.Chen DR, Bei JZ, Wang SG. Polym Degrad Stab. 2000;67(3):455–459. [Google Scholar]
- 37.Gan Z, Yu D, Zhong Z, Liang Q, Jing X. Polymer. 1999;40(10):2859–2862. [Google Scholar]
- 38.Wu C, Jim TF, Gan Z, Zhao Y, Wang S. Polymer. 2000;41(10):3593–3597. [Google Scholar]
- 39.Liu L, Li S, Garreau H, Vert M. Biomacromolecules. 2000;1(3):350–359. doi: 10.1021/bm000046k. [DOI] [PubMed] [Google Scholar]
- 40.Gan Z, Fung JT, Jing X, Wu C, Kuliche WK. Polymer. 1999;40(8):1961–1967. [Google Scholar]
- 41.Tietz NW, Shuey DF. Clin Chem (Washington, DC, US) 1993;39(5):746–56. [PubMed] [Google Scholar]
- 42.Woodruff M, Hutmacher DW. Prog Polym Sci. 2010;35(10):1217–1256. [Google Scholar]
- 43.Geng Y, Discher DE. J Am Chem Soc. 2005;127(37):12780–12781. doi: 10.1021/ja053902e. [DOI] [PMC free article] [PubMed] [Google Scholar]
- 44.Wu C, Gan Z. Polymer. 1998;39(18):4429–4431. [Google Scholar]
- 45.Rahman M, Brazel CS. Progress in Polymer Science. 2004;29(12):1223–1248. [Google Scholar]
- 46.Koo YEL, Smith R, Kopelman R. Annu Rev Anal Chem. 2009;2(1):57–76. doi: 10.1146/annurev.anchem.1.031207.112823. [DOI] [PMC free article] [PubMed] [Google Scholar]
- 47.Koo YEL, Agayan RAPM, Rehemtulla ADRB, Kopelman R. New Approaches in Biomedical Spectroscopy. Vol. 963. American Chemical Society; 2007. Photonic Explorers Based on Multifunctional Nanoplatforms: In Vitro and In Vivo Biomedical Applications; pp. 200–218. [Google Scholar]
Associated Data
This section collects any data citations, data availability statements, or supplementary materials included in this article.