

We still do not have a complete understanding of all the steps in the assembly and maturation of the ribosome despite recent progress in this area. In this study, Leong et al. used cryo-EM and mass spectrometry to examine the immature 30S particles that accumulate in strains lacking the late-stage assembly factor RimM. Their studies show that the particles isolated from ΔrimM mutants, like those of ΔyjeQ mutants (RNA 17: 697), lack densities corresponding to helices 44 and 45. In addition, tertiary ribosomal proteins are depleted in the particles. These observations support a model in which multiple parallel assembly pathways converge into a late assembly intermediate; functionally related proteins then act simultaneously or sequentially to catalyze the final steps of 30S maturation.
Keywords: ribosome assembly, 30S subunit, RimM protein, YjeQ protein, cryo-electron microscopy
Abstract
Assembly of the Escherichia coli 30S ribosomal subunits proceeds through multiple parallel pathways. The protein factors RimM, YjeQ, RbfA, and Era work in conjunction to assist at the late stages of the maturation process of the small subunit. However, it is unclear how the functional interplay between these factors occurs in the context of multiple parallel pathways. To understand how these factors work together, we have characterized the immature 30S subunits that accumulate in ΔrimM cells and compared them with immature 30S subunits from a ΔyjeQ strain. The cryo-EM maps obtained from these particles showed that the densities representing helices 44 and 45 in the rRNA were partially missing, suggesting mobility of these motifs. These 30S subunits were also partially depleted in all tertiary ribosomal proteins, particularly those binding in the head domain. Using image classification, we identified four subpopulations of ΔrimM immature 30S subunits differing in the amount of missing density for helices 44 and 45, as well as the amount of density existing in these maps for the underrepresented proteins. The structural defects found in these immature subunits resembled those of the 30S subunits that accumulate in the ΔyjeQ strain. These findings are consistent with an “early convergency model” in which multiple parallel assembly pathways of the 30S subunit converge into a late assembly intermediate, as opposed to the mature state. Functionally related factors will bind to this intermediate to catalyze the last steps of maturation leading to the mature 30S subunit.
INTRODUCTION
The ribosome in Escherichia coli comprises three strands of RNA (16S , 23S, and 5S rRNA) and over 50 ribosomal proteins (r-proteins). At least 20 protein factors facilitate the assembly of these components in vivo into the 70S ribosomal particle (Wilson and Nierhaus 2007). The exact role of most of these factors during the assembly of the ribosome is still unclear. Existing data suggest that one of the roles played by these cofactors is to assist the folding of the rRNA and allow the assembly process to proceed more quickly by preventing the large molecules of rRNA from falling into kinetic traps (Wilson and Nierhaus 2007; Britton 2009; Connolly and Culver 2009; Shajani et al. 2011).
Recent time-resolved hydroxyl radical footprinting studies in the bacterial 30S ribosomal subunit (Adilakshmi et al. 2008) suggest that the late stages of assembly of the particle, including the folding of the 3′ domain and decoding center, have a stronger tendency to fall into kinetic traps. Accordingly, most of the described cofactors assisting assembly in the small ribosomal subunit are believed to act late on the maturation process. One of these factors is the RimM protein.
Bacterial strains lacking RimM show a sevenfold reduction in their growth rate and a decreased translation efficiency (Bylund et al. 1997). These strains also exhibit accumulation of free 30S and 50S subunits and fewer polysomes (Lovgren et al. 2004). Primer extension analysis has shown that strains lacking RimM accumulate immature 16S rRNA still containing the 115 nt of the 5′ precursor sequence (Bylund et al. 1998). RimM associates with free 30S subunits, but it does not associate with 50S subunits or 70S particles (Bylund et al. 1997). The mechanism through which RimM facilitates the assembly of the 30S subunit has remained elusive.
RimM is a 21-kDa protein conserved in most eubacteria, but it is not found in Archaea, and it has been reported in only four eukaryotic species (Lovgren et al. 2004). RimM contains a characteristic N-terminal and a PRC (photosynthetic reaction center)-barrel C-terminal domain, linked by an unstructured region (Suzuki et al. 2007). The N-terminal domain comprises the first 80 residues of the protein, which fold into a closed β-barrel structure. The highly conserved GXXG motif contained in this region is part of a KH domain in other proteins, and it is often involved in mediating interactions with RNA (Grishin 2001). The PRC-barrel domain contains approximately the 75 C-terminal residues of RimM, and it is named after the H subunit of the photosynthetic reaction center in purple bacteria because of its structural similarities (Anantharaman and Aravind 2002). The H subunit of the photosynthetic reaction center in purple bacteria mediates electron transfer during photosynthesis. However, in RimM, the PRC-barrel domain lacks a conserved acidic residue that acts as a redox regulator during photosynthesis. Instead, this domain in RimM is believed to mediate the interaction with the rRNA or r-proteins of the 30S subunit. In this regard, a crystal structure of Thermus thermophilus RimM bound to S19 was deposited in the Protein Data Bank (PDB ID: 3A1P) and shows that the PRC-barrel forms multiple binding contacts with a β-sheet region of the S19 globular domain as well as with its extended C-terminal tail. The conserved tyrosine residues in position 106 and 107 located in the linker region between the two domains of RimM have also been found to be essential for the interaction with r-protein S19 (Lovgren and Wikstrom 2001; Lovgren et al. 2004).
Extensive genetic, structural, and biochemical evidence suggests that RimM assists in the late stages of assembly of the 30S subunit in conjunction with at least three other factors: Era, RbfA, and YjeQ (also called RsgA) (Bylund et al. 1998, 2001; Inoue et al. 2003, 2006; Campbell and Brown 2008). Structurally, it has been shown that YjeQ, RbfA, and Era all bind in close proximity to the decoding center of the mature 30S subunit (Sharma et al. 2005; Datta et al. 2007; Guo et al. 2011; Jomaa et al. 2011b), suggesting that these factors play a joint role in the organization of the functional core of the small subunit. Genetic evidence suggests that RimM binds to a distinct region of the head of the 30S subunit comprised of helices 31 and 33b of the 16S rRNA and r-proteins S13 and S19 right above the decoding center (Lovgren et al. 2004). With the PRC β-barrel domain of RimM bound to S19, it is plausible that the N-terminal domain of the assembly factor may extend into the A site contacting RbfA or YjeQ to also mediate in the maturation of the decoding center. However, very little is known of how RimM may fit into a coordinated sequence of events, along with YjeQ, Era, and RbfA, to mediate this process.
To improve our understanding of the role of RimM in the late stages of assembly of the 30S subunit and its integration into a functional interplay with RbfA, Era, and YjeQ, we biochemically and structurally characterized the 30S subunits that accumulate in a rimM null strain of E. coli. These ribosomal subunits accumulate unprocessed 16S rRNA and had an incomplete protein complement. In particular, all tertiary r-proteins showed some degree of depletion but mainly those located in the head domain. Cryo-electron microscopy (cryo-EM) maps obtained from these particles showed missing densities for helices 44 and 45 of their rRNA and decreased densities for the depleted r-proteins. The conformational defects observed in the rRNA were incompatible with binding to the 50S subunits or participation in translation. More importantly, we found multiple similarities between these immature 30S subunits and those that accumulate in yjeQ null strains (Jomaa et al. 2011a). This finding will be discussed in the context of potential models framing the functional interplay of RimM, RbfA, Era, and YjeQ during the late stages of assembly of the 30S subunit.
RESULTS
Slow-growth phenotype and altered ribosome profiles in the rimM null strain from the Keio collection
The purpose of this work was to characterize the immature 30S subunits that accumulate in a ΔrimM strain of E. coli and compare them with the small ribosomal subunits that were previously isolated from a ΔyjeQ strain (Jomaa et al. 2011a). To eliminate differences caused by a diverse genotypic background, we performed our analysis with the same E. coli strain that was used previously in the ΔyjeQ study. In this case, the strain was harboring a clean deletion of rimM instead (referred to as ΔrimM strain hereafter). Both the ΔrimM and ΔyjeQ strains used in these two studies are part of the Keio collection (Baba et al. 2006), which is a library of E. coli K12 strains with single-gene deletions of all nonessential genes. In each deletion, the open reading frame coding region was replaced by a kanamycin resistance cassette.
We used polymerase chain reaction (PCR) analysis to verify the deletion of the rimM gene in the E. coli strain and the presence of the kanamycin resistance cassette (Fig. 1A). The analysis revealed that the rimM gene was present in the parental strain (BW25113), but it had been removed in the ΔrimM strain, which now contained the kanamycin resistance cassette.
FIGURE 1.
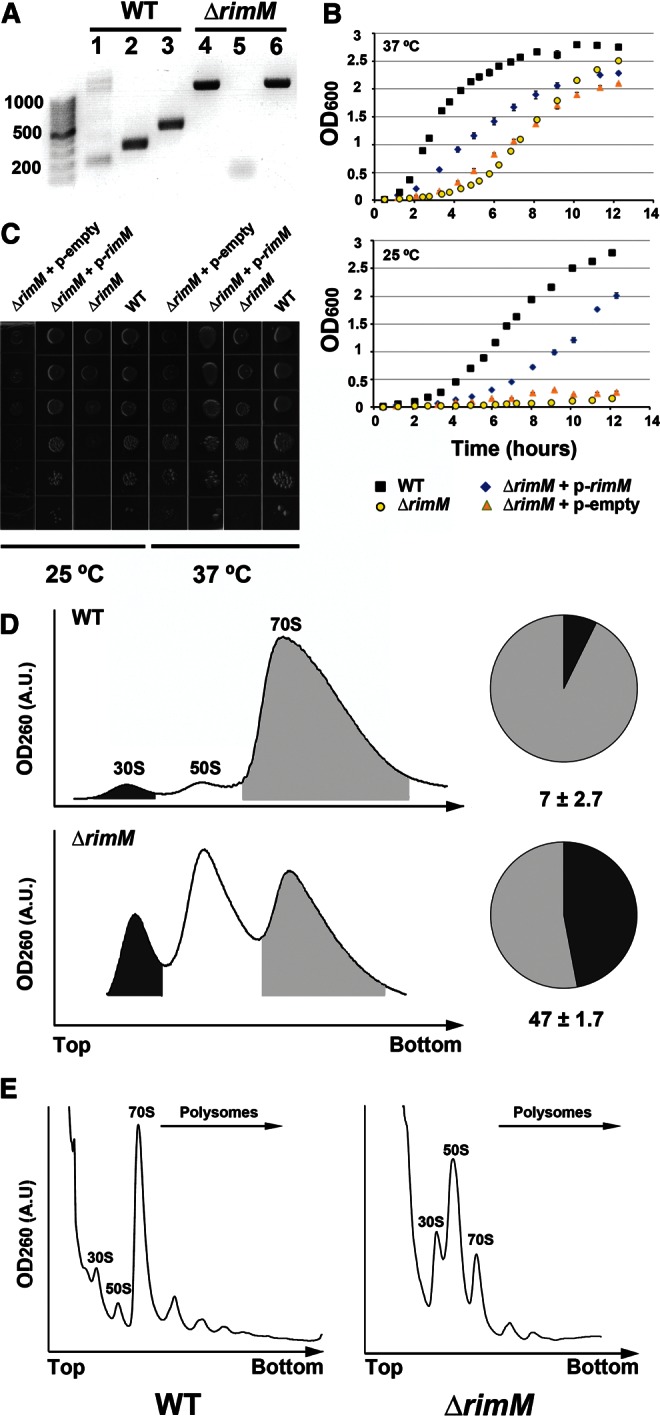
Cold-sensitive phenotype and ribosome profiling of the ΔrimM E. coli strain. (A) PCR screening of the ΔrimM strain. The image shows the obtained PCR products loaded in a 1% agarose gel. The wild-type parental E. coli BW25113 strain shows a defined 400-bp product amplified by RimM primers that anneal in a sequence internal to the intact rimM gene (lane 2). Using the set of primers annealing sequences upstream and downstream, the rimM gene produced a product of 600 bp corresponding to the complete 549-bp rimM gene plus 50 bp from the flanking sequences (lane 3). In contrast, the ΔrimM strain has a well-defined band of ∼1.2 kb amplified by primers annealing in sequences P1 and P2 flanking the kanamycin resistance cassette introduced during gene deletion (lane 4). This set of primers only produced various unspecific bands of different sizes with the parental strain (lane 1). There was no amplification with RimM primers internal to the rimM gene (lane 5); however, using the set of primers annealing rimM flanking sequences showed a large band of slightly >1.2 kb corresponding to the successfully inserted kanamycin resistance cassette flanked by these sequences (lane 6). (B) Growth profiles of the parental and ΔrimM strain in LB liquid media. The growth profile of the ΔrimM strain is shown for the untreated strain as well as after being transformed with an empty high-copy plasmid pCA24N (labeled as p-empty) or having reintroduced the rimM gene in this vector (labeled as p-rimM). (C) Dilution plating experiment of saturated cultures of ΔrimM and parental strains. The ΔrimM strain complemented with the pCA24N empty vector or encoding the rimM gene are also shown. Cultures were diluted in 10-fold increments, spotted on LB agar plates, and incubated at the indicated temperature. (D) Ribosomes from the parental (top panel) and ΔrimM strain were fractionated on 10%–30% sucrose gradients, providing the sedimentation profiles shown in the figure. Peaks corresponding to the ribosomal subunits and 70S ribosomes are labeled. Peak area for the 30S subunit (shaded in black) was measured with respect to the area under the 70S peak (shaded in gray) to calculate the percentage of free 30S subunit in both strains (pie charts in the right panels). (E) The effects of the rimM deletion are shown in the polysome profiles. Ribosome particles are labeled above the corresponding peaks.
It has been previously reported that that bacterial rimM null strains of E. coli display a slow growth phenotype (Bylund et al. 1997, 1998). To determine whether the ΔrimM strain from the Keio collection had a similar phenotype, we compared the growth of the ΔrimM and parental strains at 37°C and 25°C in LB liquid and LB agar media. Growth profiles in the liquid media collected at slightly over twelve hours (Fig. 1B) showed that, at 37°C, the doubling time at exponential phase of the ΔrimM strain is 2.5 times higher, but it reaches almost a similar OD600 value at stationary phase as the parental strain. At 25°C, the difference in doubling time between parental and ΔrimM strain was similar (Table 1), but in this case, the density reached by the mutant strain was at least one order of magnitude lower than in the parental strain (Fig. 1B). The slower growth rate of the ΔrimM strain at 37°C and 25°C was also evident in solid media with the null strain showing colonies significantly smaller in size (Fig. 1C). These experiments allowed us to analyze whether the ΔrimM strain from the Keio collection exhibited a cold-sensitive phenotype, which is a well-known hallmark of ribosome assembly defects in bacteria (Bylund et al. 1997, 1998; Campbell et al. 2006; Connolly and Culver 2009; Nord et al. 2009). However, we found that the ratios between the growth rates at log phase in the parental and ΔrimM strains at 37°C and 25°C were very similar (2.5 and 2.3, respectively) (Table 1). Therefore, we concluded that a cold-sensitive phenotype in this strain was not apparent.
TABLE 1.
Doubling time and growth rates of the E. coli BW25113 strains in LB liquid media
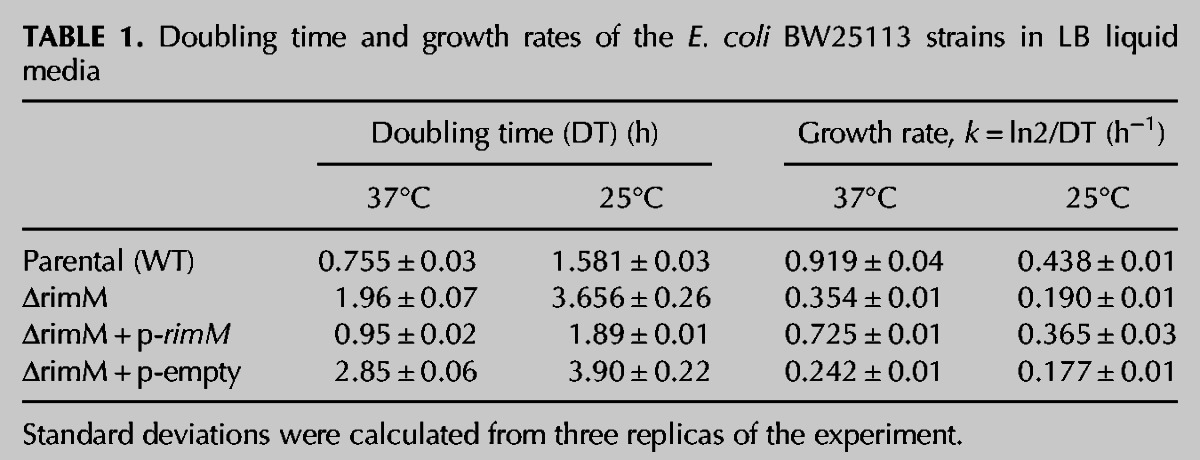
To ensure that the deletion of the rimM gene was responsible for the slow growth phenotype in the ΔrimM cells, the gene was reintroduced with the high-copy pCA24N plasmid. Reintroduction of the gene in a plasmid instead of in the chromosome eliminated the possibility of polar effects on downstream genes. In this vector, RimM expression is under the control of an isopropyl-beta-D-thiogalactopyranoside (IPTG)-inducible T5 promotor (Kitagawa et al. 2005). We found that, even in the absence of inducer, the leak in RimM expression was sufficient to partially correct the slow-growth phenotype of the ΔrimM strain (Fig. 1B,C). Indeed, overexpression of RimM protein by addition of IPTG to the media led to levels of protein that were toxic to the cells, preventing the recovery of the slow growth phenotype (data not shown). Transformation of the empty pCA24N vector in ΔrimM cells had no effect on their growth (Fig. 1B, C) allowing us to conclude that the slow growth phenotype observed for this strain of the Keio collection was due to the absence of the RimM protein.
Previous work has also shown that rimM null strains exhibit accumulation of free 30S and 50S subunits and fewer polysomes (Lovgren et al. 2004). To assess the status of ribosomes in the ΔrimM strain from the Keio collection, we obtained ribosome (Fig. 1D) and polysome (Fig. 1E) profiles for this and the parental strains using sucrose gradient density centrifugation. Consistent with other null rimM strains, the ΔrimM strain from the Keio collection also showed a severe reduction of the proportion of 70S ribosomes and a corresponding increase in the levels of free 30S and 50S subunits when compared to the parental strain. The percentage of 30S subunits that were not associated into 70S ribosomes in the ΔrimM strain was ∼47%. In contrast, only 7% of the 30S subunits were found in the free form in the parental strain (Fig. 1D). In addition, the polysome profile obtained from the ΔrimM strain showed only a few polysomes, compared to the multiple and higher polysome peaks found in the parental strain (Fig. 1E).
Immature 30S subunits with unprocessed rRNA and incomplete protein complement accumulate in the rimM null strain from the Keio collection
In E. coli, the rRNA molecule for the 30S subunit (16S rRNA) is synthesized as part of one primary transcript that includes as well the two rRNA molecules for the 50S subunit (23S and 5S rRNAs). RNase III cleaves this primary transcript into three precursor rRNAs, each containing the sequence for the mature rRNA molecule plus additional precursor sequences at the 5′ and 3′ ends (Srivastava and Schlessinger 1990). The 17S rRNA is the precursor rRNA for the 30S subunit and contains 115 and 33 additional nucleotides in its 5′ and 3′ ends, respectively. These precursor sequences are cleaved by RNase E and RNase G (5′ end) and a still uncharacterized RNase (3′ end) producing the 16S rRNA that is present in mature 30S subunits (Li et al. 1999).
In this part of the study, we analyzed the rRNA content in the ΔrimM strain and compared it to the ΔyjeQ and parental strains from the Keio collection. Purification and visualization of the total RNA from these strains in polyacrylamide gels (Fig. 2A) showed that the parental strain mainly contained fully processed 16S and 23S rRNAs. The ΔyjeQ and ΔrimM cells contained the bands corresponding to the 16S and 23S rRNA molecules, but they also accumulated an additional rRNA molecule of a slightly larger size than the 16S rRNA. This molecule was present in low abundance (<5%) in the sample from the parental strain. In the case of the parental and ΔyjeQ cells, this molecule has been previously identified as 17S rRNA (Jomaa et al. 2011a), but for the ΔrimM cells, we performed the identification of this band by Northern blot hybridization. To this end, total rRNA samples from parental, ΔyjeQ and ΔrimM cells were resolved in a polyacrylamide gel and transferred to a membrane, which was hybridized with oligonucleotide probes complementary to specific sequences in the 5′ end or the 3′ precursor sequences of 17S rRNA. In addition, we also used a probe corresponding to a short internal region of 16S rRNA (Fig. 2B). Both precursor sequence probes hybridized with the rRNA band of slightly higher molecular weight than the 16S rRNA, identifying it as 17S rRNA. The 16S internal probe hybridized to both the 17S rRNA band as well as the lower molecular weight band confirming their identity as 16S rRNA (Fig. 2C). These results confirmed that ΔrimM cells from the Keio collection accumulate unprocessed 17S rRNA-containing 30S ribosomal subunits in a similar manner to the strain lacking the yjeQ gene. Samples from ΔyjeQ cells and, in small amounts, those from ΔrimM cells also contained a lower molecular band recognized by the 16S internal probe. This band corresponds to a degradation product or an incorrectly processed 16S rRNA (Fig. 2C, asterisk; Himeno et al. 2004; Jomaa et al. 2011a).
FIGURE 2.
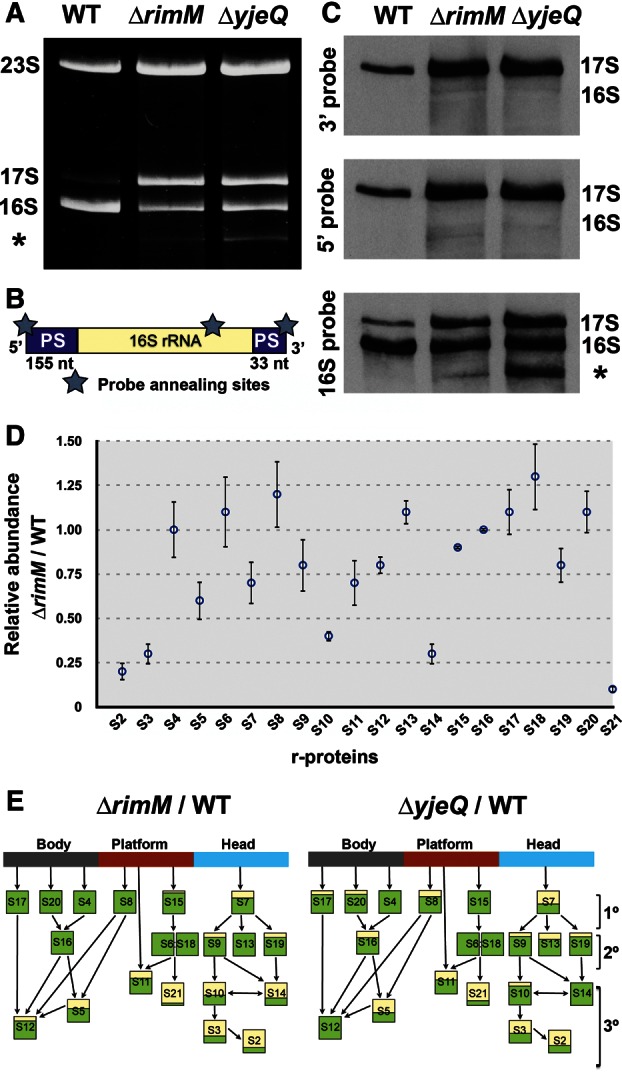
Ribosomal RNA and protein complement of immature 30S subunits accumulated in the ΔrimM strain. (A) Total rRNA purified from ΔrimM and ΔyjeQ cells resolved in a polyacrylamide gel and stained with ethidium bromide. The 23S, 16S, and 17S rRNA bands are indicated. (B) Diagram of the 17S rRNA molecule showing the 5′ and 3′ precursor sequences. The stars indicate the annealing sites for the oligonucleotide probes used in the Northern blot analysis. PS stands for precursor sequence. (C) The identity of small ribosomal rRNA species in the wild-type, ΔrimM, and ΔyjeQ strains from the Keio collection was revealed by Northern blot hybridization using 3′ end DIG-dUTP-labeled oligonucleotide probes visualized using a chemiluminescent reaction. The 16S and 17S rRNA bands are labeled. The asterisk in A and C indicates a lower molecular band corresponding to a degradation product or incorrectly processed 16S rRNA (Jomaa et al. 2011a). (D) iTRAQ analysis of the 30S subunits purified from the ΔrimM strain under associating conditions. The relative level for each r-protein with respect to wild-type parental cells is expressed as the ratio ΔrimM/WT. The ratio for each protein is calculated as the average of the ratios obtained for all the peptides assigned to each r-protein. Error bars represent the standard deviations of the average for each ratio. (E) The ΔrimM/WT average ratios were plotted in the Nomura assembly maps (lower panels) and shown along with a similar analysis performed for the free 30S subunits purified from the ΔyjeQ strain under identical conditions (data taken from Jomaa et al. 2011a). The proportion of the box colored in yellow is proportional to the degree of underrepresentation of each r-protein in the 30S subunits purified from ΔrimM and ΔyjeQ cells. The groups of primary (1°), secondary (2°), and tertiary (3°) proteins are indicated.
The protein complement in the free 30S subunits that accumulate in the ΔrimM cells was analyzed by iTRAQ (isobaric tag for relative and absolute quantification) method (Ross et al. 2004). This is the same technique that was previously used to study the protein complement in the free 30S subunits that accumulate in ΔyjeQ cells (Jomaa et al. 2011a), allowing a side-by-side comparison of both 30S ribosomal subunits. Here, we performed the iTRAQ double duplex isobaric labeling experiment that compares the relative amount of r-proteins in the free 30S subunits from ΔrimM cells with respect to the mature 30S subunits from the parental strain. Free 30S subunits from ΔrimM cells were purified under associating conditions. In the case of the parental strain, mature 30S subunits were first dissociated from the 50S subunits and then purified (see Materials and Methods section). Results from this analysis are shown in Figure 2D and expressed as ΔrimM/WT ratios for the r-proteins of the 30S subunit. These average ratios were subsequently plotted in the Nomura 30S subunit assembly map (Fig. 2E) and displayed along with a similar analysis for the ΔyjeQ 30S subunits (Jomaa et al. 2011a).
Our analysis identified all the r-proteins in the 30S subunit except S1. This protein does not withstand the high-salt washes used during our ribosomal purification (Jomaa et al. 2011a). This result was expected, and thus r-protein S1 was not included in the analysis. We found that most of the primary and secondary r-proteins in the free 30S subunits purified from ΔrimM cells were represented at similar levels compared to those of the mature 30S subunits from the parental strain, allowing us to conclude that the free ΔrimM subunits were immature particles at late stages of assembly. However, tertiary r-proteins that bind to the head domain (S2, S3, S10, and S14) as well as S21 (Fig. 2D,E), a tertiary protein that binds to the platform domain (Supplemental Fig. S1), showed significant underrepresentation. In addition, the primary (S7) and secondary (S9 and S19) r-proteins also binding to the head domain, as well as the tertiary proteins binding to the body (S5 and S12) and platform (S11) domains, were slightly underrepresented (Supplemental Fig. S1).
Considering that in vivo, S7 nucleates the assembly of all other r-proteins in the head (Bunner et al. 2008; Sykes et al. 2010), it is unlikely that the entry of S7 in the assembling 30S subunit is affected. A more plausible interpretation is that S7 may be less tightly bound in the immature particle, and it may have dissociated during purification. Interestingly, S13 and S19, which are believed to form the binding site for RimM to the 30S subunit, were not depleted (S13) or only slightly depleted (S19) in these immature particles. This result indicates that entry of these two r-proteins is not dependent on the presence of RimM. However, entrance of all the other r-proteins in the head domain of the 30S subunit was affected proportionally to their hierarchy of binding (i.e., primary and secondary were less depleted than tertiary r-proteins). These results are consistent with a role for RimM in mediating the entrance of the tertiary r-proteins in the head domain of the 30S subunit.
In addition, we found that r-proteins S8, S13, and S18 had a ratio slightly higher than one indicating that these r-proteins are slightly underrepresented in the mature 30S subunits. Dissociating conditions (see Materials and Methods) were used to purify the mature 30S subunits from parental cells. These conditions expose the ribosomal particles to low magnesium concentrations (1.1 mM magnesium acetate), which may have caused partial dissociation of some r-proteins. Instead, exposure to low magnesium concentrations was not necessary to purify the immature 30S subunits as they are already dissociated from the 50S subunits in ΔrimM cells.
When comparing the iTRAQ analysis of the free 30S subunits accumulated in the ΔrimM and ΔyjeQ cells plotted in the Nomura map (Fig. 2E, bottom panel) common patterns emerge. In both cases, tertiary r-proteins S2, S3, and S21 exhibited the higher degree of depletion. In addition, S7, S9, and S19 were also slightly depleted in both immature 30S subunits. The main difference that we found was that, in the ΔyjeQ 30S subunits, the primary S8, S20, and S17 and secondary S16 r-proteins, which do not bind to the head domain, were slightly depleted. However, they were at normal levels in ΔrimM 30S subunits. It is not possible to discriminate from the published work (Jomaa et al. 2011a) whether these proteins have a defective entrance to the assembling subunit in the absence of the YjeQ protein or if the proteins partially dissociate during purification. However, the main conclusion that stems from this comparison is that both ΔrimM and ΔyjeQ cells accumulate free 30S subunits that have not completed their maturation and are severely depleted in the tertiary r-proteins S2, S3, and S21. These immature 30S subunits are not identical in terms of the protein complement; nevertheless, they show a comparable pattern of r-protein depletion.
The immature 30S subunit that accumulates in the rimM and yjeQ null strains from the Keio collection exhibit similar structural defects
Next, we studied the structure of the immature 30S subunits that accumulated in ΔrimM cells by cryo-EM. The first step in our structural characterization was to perform a reference-free maximum likelihood-based 2D image classification of the projection images collected of purified 30S subunits from ΔrimM cells (Supplemental Fig. S2). The 2D class averages obtained in this analysis were matched with 2D projections from the cryo-EM structure of the mature E. coli 30S subunit (EMDB ID 1775) (Jomaa et al. 2011a). This analysis revealed that the densities for the main structural domains of a 30S subunit (head, body, and platform) were properly defined and resembled those in the projections from the mature 30S subunits. This result suggested that the immature 30S subunits that accumulate in ΔrimM cells were at late stages of assembly. Alternatively, it was possible that the collected data set was contaminated with particle images representing mature 30S subunits.
Therefore, the first step to obtain the 3D structure of the immature 30S subunit included a supervised classification step (Valle et al. 2002; Gao et al. 2004) aiming to separate particle images representing mature 30S subunits that may have copurified with the immature particles (Supplemental Fig. S3). The two references used in this classification were the cryo-EM structure of the mature E. coli 30S subunit (EMDB ID 1775) (Jomaa et al. 2011a) (reference 1) and the 3D reconstruction obtained from all the particle images in the data set (reference 2) (Supplemental Fig. S3, top panel). This second reference was obtained by a projection matching approach using the X-ray structure of the E. coli 30S subunit (PDB ID: 2AVY) (Schuwirth et al. 2005). The fact that the 2D class averages obtained from our data set resembled the projections from the mature 30S subunit (Supplemental Fig. S2) justified the use of this X-ray structure for our reference-based alignments.
The similarity of the particle images to the two references was assessed by plotting the difference in cross-correlation coefficients for each particle image against equivalent projections from the two references (ΔCC = CC2 − CC1). The obtained distribution was bimodal, with two peaks of similar height and area (Supplemental Fig. S3, middle panel). Initially, the distribution of particles was divided into two groups, using ΔCC = 0 as the cutoff value. Particles in each group were used to produce an initial map by the maximum likelihood approach (Scheres et al. 2005b,c). These initial maps were subsequently used to refine the 3D reconstructions for each group of the data by projection matching techniques. Both maps (Supplemental Fig. S3, bottom panel; only map corresponding to particles with ΔCC > 1 is shown) showed the main characteristic domains of the mature 30S subunit. However, these structures clearly differed from the mature 30S subunit structure in that most of the density representing helix 44 of the rRNA was missing (helix 44 is highlighted in reference 1 in Supplemental Fig. S3). This result suggested that the percentage of particles representing mature 30S subunits contaminating the data set was small. To investigate the presence of mature particles even further, we obtained a 3D reconstruction only from those particles with the highest similarity (lowest ΔCC value) to the mature 30S subunit structure (reference 1). To this end, the left peak of the distribution was spilt into two parts at the arbitrary ΔCC value shown in Supplemental Figure S3. The two 3D maps obtained continued to show features not consistent with the mature structure of the 30S subunit (Supplemental Fig. S3, bottom panel). A similar classification approach was shown to be very effective in discriminating mature from immature particles in electron micrographs of immature 30S subunits purified from ΔyjeQ cells (Jomaa et al. 2011a). Therefore, we concluded that, in the case of 30S subunits purified from ΔrimM cells, the amount of particle images representing mature 30S subunits contaminating the data set was minimal.
Consequently, we proceeded to perform a maximum likelihood-based classification (Scheres et al. 2005b,c, 2007; Jomaa et al. 2011a) of the entire data set to explore the conformational variability within the population of immature 30S subunits purified from ΔrimM cells. We found that these 30S subunits were mainly present in four conformationally different subpopulations (Fig. 3). The percentage of particles for each class was 22%, 27%, 24%, and 27%, respectively. Performing maximum likelihood-based classifications assuming the existence of more than four subpopulations consistently produced duplication of the 3D structures displayed in Figure 3 (data not shown). Furthermore, we did not obtain a structure that could be assigned to the population of particles containing the degraded rRNA molecules present in small amounts in ΔrimM cells (Fig. 2A,C, asterisk). It is possible that these particles may not exist as a structurally congruent subpopulation and they were eliminated during the classification and 3D reconstruction process. However, these multiple classification experiments allowed us to conclude that the immature 30S subunits purified from ΔrimM cells mainly exist as four conformational subpopulations. Particles in additional conformations may also coexist in the sample, but they are probably not sufficiently abundant to be detected by our classification approaches.
FIGURE 3.
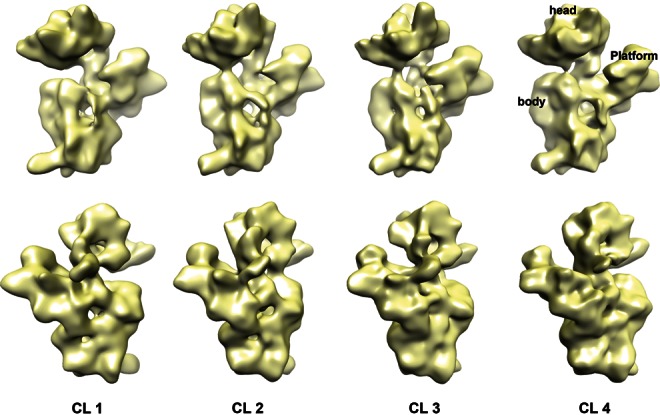
Conformational subpopulations of immature 30S subunits purified from ΔrimM cells. Front (top panel) and back (bottom panel) views of the cryo-EM maps representing four conformational subpopulations (labeled CL 1 to CL 4) of immature 30S subunits purified from ΔrimM cells. Particle classification was obtained using a maximum likelihood-based classification approach. Main domains of the 30S subunit are labeled in the structure for subpopulation class 4. The Fourier shell correlation plots estimating the resolution of these maps are shown in Supplemental Figure S4.
The four cryo-EM maps produced from the maximum likelihood-based classification experiments were refined to a resolution that ranged between 15 Å and 17 Å (Supplemental Fig. S4). These maps represented late assembly intermediates of the 30S subunit, as the main domains of the subunit (head, body, and platform) were present in the structures (Fig. 3).
To assist in the understanding of the conformational differences in the rRNA between these immature particles and the mature 30S subunits, the X-ray structure of the mature 30S subunit (PDB ID 2AVY) (Schuwirth et al. 2005) was docked as a rigid body into the cryo-EM maps obtained for the four conformational subpopulations of the immature 30S subunits and the mature 30S subunit (EMDB ID 1775) (Fig. 4A; Jomaa et al. 2011a). The maps corresponding to the immature 30S subunits showed different degrees of distortion in helices 44 and 45, which are important functional motifs of the rRNA involved in the decoding mechanism (Fig. 4B; Supplemental Fig. S5A). This feature of the cryo-EM maps suggested an increased flexibility of these regions. To better estimate the amount of density missing from helices 44 and 45 in each map, we calculated difference maps by subtracting the 3D maps of the four subpopulations of immature 30S subunits from that of the mature 30S subunit (EMDB ID 1775) (Jomaa et al. 2011a). Most of the densities observed in the difference maps colocalized with r-proteins in the head domain (see below). However, consistent with the distortions observed in helices 44 and 45, it also showed large densities overlapping with these structural motifs (Fig. 5A; Supplemental Fig. S5B).
FIGURE 4.
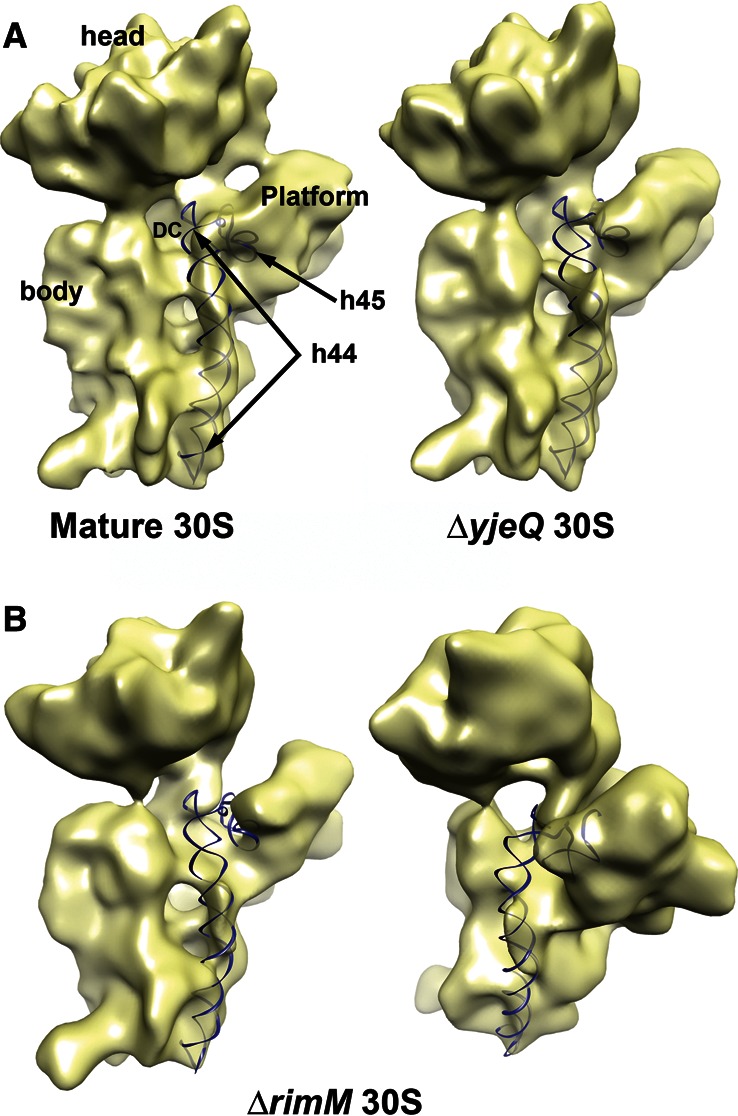
Structural defects in the 3′ minor domain in the immature 30S subunits purified from ΔrimM cells. (A) Cryo-EM maps of the mature 30S subunit and immature 30S subunit purified from ΔyjeQ cells. The X-ray structure of the 16S rRNA (PDB ID 2AVY) was fitted into the cryo-EM maps, and helices 44 and 45 are shown as a ribbon representation. The remaining of the 16S rRNA and r-proteins from the X-ray structure are not shown for clarity. Main landmarks of the 30S subunit are indicated in the left panel. (B) Front and platform view of the cryo-EM map of subpopulation four (CL 4) of the immature 30S subunit purified from ΔrimM cells. The X-ray structure of the mature 30S subunit was docked into the map, and helices 44 and 45 are shown.
FIGURE 5.
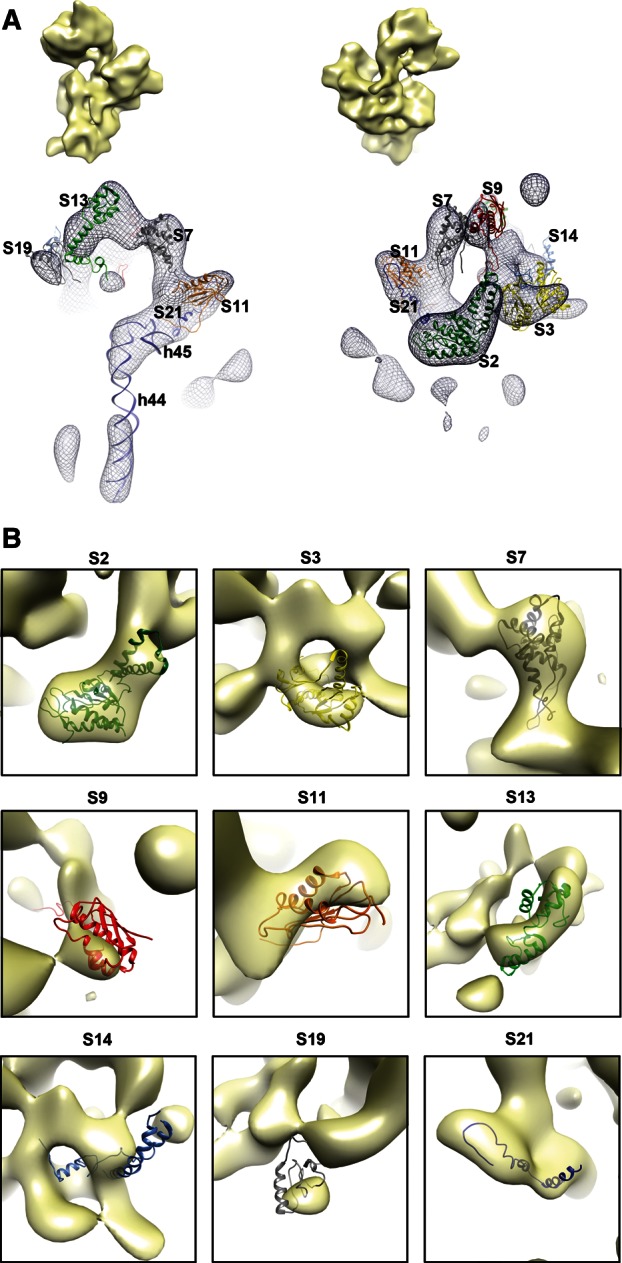
Structural defects in the head domain in the immature 30S subunits purified from ΔrimM cells. (A) Front and back views of the difference map obtained by subtracting the cryo-EM map of the immature 30S subunits (CL 4) from ΔrimM cells from that of the mature 30S subunit (EMDB ID 1775). Densities in the different maps are represented as a mesh, and the X-ray structure of the mature 30S subunit (PDB ID 2AVY) is shown docked into the difference map. The cryo-EM maps above each view are an aid for orientation, and they represent the cryo-EM map of the immature 30S subunit in the same view as the difference map below. The difference map showed densities overlapping with helices 44 and 45 of the 16 rRNA from the docked X-ray structure of the 30S subunit, indicating that these structural motifs do not have a correspondent density in the cryo-EM maps of the immature 30S subunits. The densities in the head domain of the difference map colocalized with the r-proteins from the structure of the mature 30S subunit that iTRAQ analysis identified as underrepresented in the immature 30S subunits from ΔrimM cells. (B) Images in this panel provide a detailed view of the docking of underrepresented r-proteins from the X-ray structure of the mature 30S subunit into the densities of the difference map. A higher proportion of a r-protein being enclosed in the density of the difference map indicates a larger amount of the corresponding density for that r-protein missing in the cryo-EM map of the immature 30S subunit. The densities in the difference map are shown as a semitransparent surface. The cryo-EM map for subpopulation 4 of immature 30S subunits was used to produce the difference map displayed in this panel. A similar difference map analysis performed with the cryo-EM maps for the other three subpopulations is shown in Supplemental Figures S5, S6, and S7.
The upper domain of helix 44 contributes to the association with the 50S subunit, forming the essential inter-subunit bridge B2a with the 50S subunit. In addition, this region of rRNA constitutes the decoding center, the functional core of the 30S subunit. Therefore, these distortions observed in the structures of the immature 30S subunit from ΔrimM cells provide the structural basis to explain previous studies which found these 30S subunits were unable to bind the 50S subunit or participate in translation (Bylund et al. 1997). More importantly, these distortions in the decoding center were similar to those previously described in the immature 30S subunits purified from ΔyjeQ cells (Jomaa et al. 2011a) from the Keio collection (Fig. 4A, right panel), indicating some degree of structural similarity between the two immature particles.
The immature ΔrimM 30S subunits exhibit structural defects in the head domain consistent with an incomplete protein complement
In addition to the densities for helix 44 and helix 45, the difference maps obtained for the four subpopulations of immature 30S subunits in ΔrimM cells also showed densities mainly in the head domain that colocalized with several r-proteins (Fig. 5A). In particular, r-proteins S2, S3, and S21 (located in the cleft between the head and the platform), for which iTRAQ analysis determined to be severely underrepresented (Fig. 2D), showed corresponding densities in the difference maps (Fig. 5A). Most of the volume of these r-proteins was enclosed by these densities, consistent with their high degree of underrepresentation in the immature structure (Fig. 5B). However, the densities corresponding to each depleted r-protein varied across the difference maps obtained for the four conformational subpopulations of immature 30S subunits (Supplemental Fig. S6). The best correlation was found for the difference map for class 4. These results demonstrated that our image classification approach was effective in separating immature 30S subunits subpopulations exhibiting different degrees of depletion for particular r-proteins.
In the difference maps, we also found densities colocalizing with r-proteins S7, S9, S11, and S19 (Fig. 5A), which iTRAQ analysis found to be slightly underrepresented (Fig. 2D). In these cases, the volume of these proteins enclosed in the corresponding density of the difference map was smaller, consistent with their lower degree of depletion (Fig. 5B). These volumes also varied between the four difference maps obtained from the subpopulations of immature 30S subunits (Supplemental Fig. S7).
In addition, we also found a few exceptions in the correlation between the iTRAQ data and difference map analysis. One of them was the r-protein S13 which, along with S19, is believed to form the binding site for RimM to the 30S subunit. The C terminus of S13 was enclosed in a corresponding density present in the difference maps (Supplemental Fig. S7). This density was larger in the difference map for class 4, and in this case, almost the entire volume of r-protein S13 was enclosed in the density (Fig. 5B). However, S13 was not found to be underrepresented according to iTRAQ analysis (Fig. 2D). This result suggested that S13 has a higher degree of flexibility in the immature 30S subunits, causing a partial smearing of the corresponding density in the cryo-EM maps of the immature subunits. Alternatively, it is plausible that S13 is more loosely bound in the immature 30S subunit and partially dissociates during the dilution or vitrification process that the sample undergoes during cryo-EM. Conversely, we did not find a density for S10 and only a small one for S14 in the difference maps (Fig. 5B; Supplemental Fig. S6). However, these r-proteins were found to be severely underrepresented according to our iTRAQ analysis (Fig. 2D). Similarly, r-proteins S5 and S12, in the body of the 30S subunit, were found to be slightly depleted, but they did not show a corresponding density in the difference maps (Fig. 5A). It is possible that concomitant movements of the r-RNA obscured the absence of these proteins, generating densities in the structures for the immature 30S subunits similar to those produced by these r-proteins in the mature subunit.
DISCUSSION
The defects observed in immature 30S subunits purified from ΔrimM cells suggest a role for RimM in assisting the entrance of tertiary r-proteins that bind to the head domain of the 30S subunit, as well as in the folding of the 3′ minor domain of the 16S rRNA. More importantly, the distortions observed in the decoding center and r-protein depletion pattern resemble those found in the immature 30S subunits that accumulate in ΔyjeQ cells. These findings suggest that RimM assists in the late stages of assembly of the 30S subunit. These results are also consistent with previous data (Bylund et al. 1998, 2001; Inoue et al. 2003, 2006; Campbell and Brown 2008), suggesting that RimM performs its function in conjunction with other assembly factors, including YjeQ.
Early in vitro and in vivo experiments were able to identify discrete assembly intermediates of the 30S and 50S subunits (Hayes and Hayes 1971; Lindahl 1975; Sieber and Nierhaus 1978; Nierhaus 1980). These early studies seeded the hypothesis that assembly proceeds through a single pathway characterized by the existence of rate limiting intermediates. Under this model, it was thought that assembly factors were required to assist the immature particles in overcoming energy barriers along the assembly pathway.
More recently, experiments from the Woodson (Adilakshmi et al. 2008) and Williamson (Talkington et al. 2005; Williamson 2005) laboratories have established that, in the case of the 30S subunit, the particle nucleates in multiple points along the rRNA, and assembly proceeds through multiple parallel pathways with no single rate-limiting steps. Under this model, the role of trans-acting factors is to guide the folding landscape of the rRNA and to facilitate productive conformations and specific protein-RNA interactions (Shajani et al. 2011).
A central question to this study is how assembly factors that work in conjunction perform their role and assist the ribosomal assembly if the process follows multiple parallel pathways that occur simultaneously. Herein, we have addressed this question specifically for RimM, which is functionally related to Era, RbfA, and YjeQ.
It is difficult to envision how assembly factors that are known to work in conjunction would assist an assembly process that follows parallel pathways, converging only in the mature state, unless all factors assist every pathway. Alternatively, if each factor is assisting one of the parallel pathways, then elimination of any of these factors would cause accumulation of a different assembly intermediate. In addition, it is most likely that factors acting in one pathway would not bind immature intermediates that accumulate as a result of eliminating a factor involved in a different pathway. This scenario does not agree with the findings presented here or the existing literature (Goto et al. 2011) as described below.
The similarities found between the immature particles that accumulate in the ΔrimM and ΔyjeQ strain (Jomaa et al. 2011a) are consistent with a model that we named here as the “early convergency model” (Fig. 6, top panel), in which several parallel assembly pathways converge into a common immature assembly intermediate as opposed to the mature state. Functionally related factors, such as RimM, Era, RbfA, and YjeQ, will bind to this intermediate with a defined hierarchy to catalyze the last steps of maturation. After binding, their mechanism of action may follow a “simultaneous” pattern (i.e., all of them bind to the same intermediate to catalyze together the last maturation steps), a “sequential” pattern (i.e., each factor performs its function independently and is released before the next factor binds to the maturing 30S subunit) (Fig. 6, bottom panel), or by a combination of these two possibilities (not displayed in Fig. 6).
FIGURE 6.
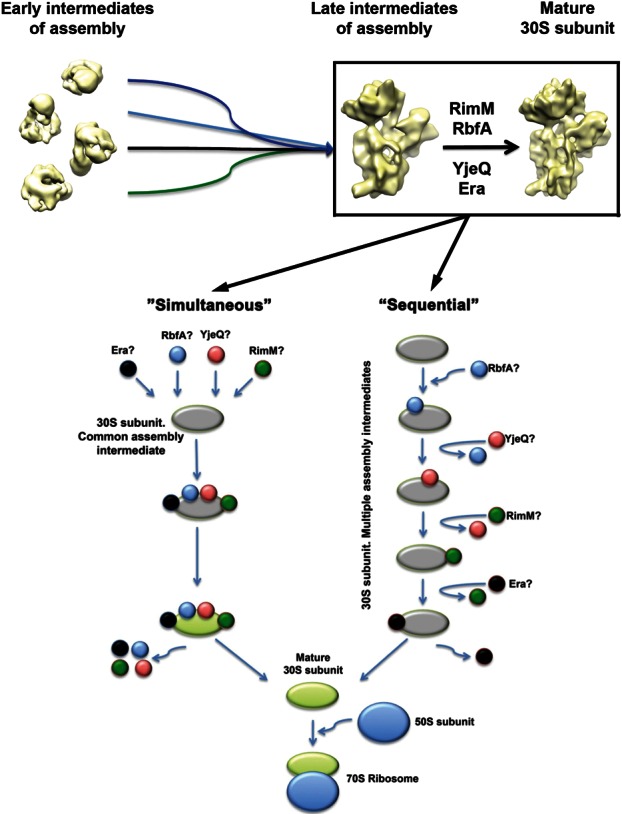
Early convergence model for the assembly of the 30S subunit. The “early convergency model” presented in this diagram (top panel) suggests that multiple parallel assembly pathways converge into a late assembly intermediate. A group of functionally related assembly factors (RimM, RbfA, YjeQ, and Era) will target this intermediate and catalyze the latest steps of maturation. Binding of these factors to the assembly intermediate will occur following a defined hierarchy. The bottom panel illustrates the two alternative models for the mechanism of action of RimM, RbfA, YjeQ, and Era. In the “simultaneous” model, all these assembly factors bind to the same intermediate to catalyze together the last maturation steps. In an alternative model, each factor performs its function independently and is released before the next factor binds to the maturing 30S subunit. A “hybrid” model is also possible (not displayed) where some factors may function sequentially, and others may act simultaneously. The question mark beside the name of each factor indicates that the order of binding is unknown.
For RimM, Era, RbfA, and YjeQ, the hierarchy of binding to the immature intermediate or whether their binding follows a simultaneous or sequential model is still unknown. YjeQ (Goto et al. 2011) and RimM (data not shown) are not capable of binding the immature 30S subunit that accumulates in their respective yjeQ and rimM null strains. However, RbfA binds the immature 30S subunit purified from the ΔyjeQ strain (Goto et al. 2011). Therefore, it is plausible that RbfA may be the first factor binding the assembling subunit. This initial binding event may allow for the binding of YjeQ, RimM, and Era. Structurally, the immature 30S subunits that accumulate in ΔrimM cells differ more from the mature 30S subunit structure than the immature particles purified from a ΔyjeQ strain (Jomaa et al. 2011a). Whether that implies that the particles from ΔrimM cells constitute an earlier assembly intermediate or that RimM binding to the assembling 30S subunit occurs before YjeQ does still has to be determined. Further experiments beyond the scope of this study will define the hierarchy of binding for these functionally linked factors.
We are mindful that, in addition to RimM, Era, RbfA, and YjeQ, other trans-acting factors assisting the late stages of assembly of the 30S subunit in bacteria have been described (Wilson and Nierhaus 2007). Undoubtedly, future work will expand the current list of assembly factors and define a network of functional interactions among known and newly established factors. In this context, it is possible that the entire folding landscape of the 30S particle may converge to a few common intermediates instead of the mature state. Each group of functionally related factors will target one of these intermediate particles to catalyze the latest steps of maturation.
What are the functional advantages of the early convergency model of assembly for the cell? Tight regulation of the last steps in the maturation process of the ribosome is essential for cell survival under conditions with scarce nutrients (Britton 2009). Translating ribosomes become stalled when amino acids are depleted, but removal and degradation of partially translated proteins represents an important energy cost for the cell during times of limited resources. Therefore, the cell needs to have regulatory mechanisms in place to minimize the number of ribosomes that engage in translation under such conditions. Convergence of multiple parallel assembly pathways into a late assembly intermediate may provide the cell with an efficient mechanism to arrest assembly just before the ribosomal subunit reaches the mature state. Under the early convergency model, the final maturation steps will be catalyzed by functionally related factors (RimM, Era, RbfA, and YjeQ) limiting the number of 30S subunits that have the ability to engage in protein translation. Most importantly, it may create a reservoir of immature ribosomal subunits on “standby” that can complete their maturation process and become readily available for protein translation as soon as nutrients become available. Considering that some of these factors are GTPases (YjeQ and Era) (Daigle et al. 2002; Sharma et al. 2005), this mechanism could allow the cell to couple ribosomal assembly with intracellular GTP concentrations (Potrykus and Cashel 2008). A decrease in the GTP/GDP ratio would increase the amount of the GDP-bound form of the GTPase factors, inhibiting association with the 30S subunit and preventing catalysis of the last step of maturation of the ribosomal particle. Conversely, if assembly occurs through multiple parallel pathways converging only in the mature state, the cell needs to shut down each single pathway independently to completely stop production of mature ribosomal subunits. It is arguable whether a tight control on the amount of mature subunits produced by the cell is possible under the late convergency model.
MATERIALS AND METHODS
PCR screening of the ΔrimM Keio collection strain
The primers used for the analysis were as follows:
P1 5′-ATTCCGGGGATCCGTCGACC-3′
P2 5′-TGTAGGCTGGAGCTGCTTCG-3′
RimM Rev 5′-TTCGTGGGTGGCTCAGAGTGTTTTC-3′
RimM Fwd 5′-CGGTACGAGACGTTCCTTGATACCA-3′
RimM flanking 1 5′-GCCGTCTTTTACCGTTTATCCGGTG-3′
RimM flanking 2 5′-CAAAGCAGCTTAATCTGTCACGGTG-3′
In the Keio collection, the kanamycin resistance cassette introduced during gene deletion is flanked by 20-nt-long upstream (P1) and downstream (P2) sequences (Baba et al. 2006) that are the same as in our P1 and P2 primers. These primers anneal to the P1 and P2 sequences and amplify the entire kanamycin resistance cassette when present (∼1200 bp). The RimM Rev and RimM Fwd set of primers was designed to anneal within the sequence of the rimM gene and produce a product of 400 bp. Finally, the RimM flanking 1 and 2 primers correspond to upstream and downstream sequences from the rimM gene, respectively, and they were used to positively identify a product the size of the gene (549 bp + 50 bp) or the cassette inserted into the same region (∼1.2 kb + 50 bp).
Template DNA samples were prepared from the wild-type parental E. coli BW25113 and ΔrimM strains. Strains were grown overnight in 3-mL cultures of Luria-Bertani (LB) media (with 30 µg/mL of kanamycin for ΔrimM). Cell pellets were resuspended in 50 μL of TNE buffer (50 mM Tris-HCl, pH 8, 100 mM NaCl, and 0.1 mM EDTA). Lysis was performed by adding 5 μL of a 10 mg/mL solution of lysozyme and incubating the cells on ice first for 30 min and then heating at 65°C for 10 min. Genomic DNA was extracted by adding 50 μL of equilibrated phenol-chloroform (1:1 v/v), and the mixture was centrifuged for 3 min at 10,000g at room temperature. The upper phase was recovered and the DNA precipitated by adding an equal volume of ice-cold 100% ethanol. DNA was pelleted by centrifugation at 10,000g for 20 min at 4°C. DNA pellets were washed with ice-cold 70% ethanol and subsequently centrifuged at 10,000g at 4°C for 5 min. DNA pellets were dried and then resuspended in 100 μL sterile water for use in PCR.
The PCR was performed with the following cycle times and temperatures: 5 min DNA template melting at 95°C and 30 cycles of amplification (1 min DNA template melting at 95°C, 1 min annealing at 63°C, 2 min elongation at 72°C), followed by a final 20-min elongation step at 72°C. The completed PCR reactions were resolved on a 1% agarose gel in TE buffer (50 mM Tris-HCl, pH 8.0 and 0.1 mM EDTA), stained with GelRed (Biotium) and visualized with a UV transilluminator.
Culture growth conditions
To obtain the growth curves, the ΔrimM and parental strains were inoculated in 50 mL of LB media from overnight cultures at a 1:100 dilution. Cells were incubated at either 25°C or 37°C with shacking, and culture density was monitored by measuring the optical density at 600 nm (OD600). To reintroduce the RimM protein into ΔrimM cells, we used the high-copy plasmid pCA24N. This vector expresses N-terminal histidine-tagged RimM under the control of isopropyl-beta-D-thiogalactopyranoside-inducible promotor PT5-lac. This expression plasmid was purified from the corresponding clone from the ASKA library collection, which contains a complete set of open reading frame clones of E. coli (Kitagawa et al. 2005). The purified pCA24N plasmid (empty or expressing RimM) was transformed into the ΔrimM cells using standard protocols (Sambrook et al. 1989) before proceeding to obtain the growth curves as described above. Doubling times of cultures were calculated as DT = (t2 − t1) × [log2/(log OD600@t2/log OD600@t1)] and expressed in hours. Growth rates were expressed as k = ln2/DT and expressed in h−1.
Dilution plating experiments were performed by inoculating 0.5 mL of a saturated overnight culture in 50 mL of fresh LB media. Cultures were grown at 37°C with shaking until an OD600 of 0.2. Then, serial dilutions were made in 10-fold increments, and 5 µL of each dilution was immediately spotted onto LB agar plates and incubated at either 37°C or 25°C. The plates were incubated for ∼18 and 40 h, respectively, or until isolated colonies of the parental strain reached ∼2 mm in diameter.
30S subunit purification and sucrose gradient ultracentrifugation analysis
For each strain, 1 L of LB was inoculated with 10 mL of saturated overnight culture and grown to an OD600 of 0.2. Cultures were then cooled to 4°C, and subsequent steps were carried out at this temperature. Bacteria were harvested at 5000g for 10 min and the pellets resuspended in buffer A (20 mM Tris-HCl, pH 7.5, 10 mM magnesium acetate, 100 mM NH4Cl, 0.5 mM EDTA, and 3 mM 2-mercaptoethanol) with the addition of Roche Complete Mini protease inhibitor cocktail and DNaseI (Roche). Resuspended cells were then lysed by pressurized extruder or by four passes in a French press at 20,000 lbs/in2. The cell lysate was centrifuged at 30,000g for 40 min to clear cell debris. Clarified lysate (S30 fraction) was layered over a 1.1 M sucrose cushion of equal volume, composed of buffer B (20 mM Tris-HCl at pH 7.5, 10.5 mM magnesium acetate, 500 mM NH4Cl, 0.5 mM EDTA, 3 mM 2-mercaptoethanol) and centrifuged for 16 h at 100,000g. The ribosome pellet was resuspended in buffer C (10 mM Tris-HCl at pH 7.5, 10.5 mM magnesium acetate, 100 mM NH4Cl, 0.5 mM EDTA, and 7 mM 2-mercaptoethanol) and pelleted again at 100,000g for 16 h.
The washed ribosome pellet was resuspended in buffer E (10 mM Tris-HCL, pH 7.5, 10 mM Mg acetate, 60 mM NH4Cl, and 3 mM 2-mercaptoethanol). Ribosomal subunits remain associated under these buffer conditions. Sixty to 80 A260 units of resuspended crude ribosomes were then applied to 34 mL 10%–30% (w/v) sucrose gradients prepared with Buffer E. The gradients were centrifuged for 16 h at 40,000g on a Beckman SW32 Ti rotor. Gradients were fractionated using a Brandel fractionator apparatus and an AKTAprime FPLC system (GE Healthcare). The elution profile was monitored by UV absorbance at A260, and fractions corresponding to the 30S subunit peak were pooled and collected for cryo-electron microscopy and iTRAQ analysis. The 30S subunits were removed from the sucrose buffer by centrifuge spinning at 100,000g for 16 h, after which the pellet was rinsed, resuspended, and stored at −80°C in buffer E. Sample concentration was determined by sample absorbance at 260 nm, where 1 A260 unit is equivalent to 69 pmol of 30S.
The purified 30S subunits from the parental E. coli strain were purified using the same protocol. However, the ribosome pellet was resuspended in buffer F (10 mM Tris-HCl, pH 7.5, 1.1 mM magnesium acetate, 60 mM NH4Cl, 0.5 mM EDTA, and 2 mM 2-mercaptoethanol), and the sucrose gradients were also prepared in this buffer. The final purified 30S subunits were resuspended in buffer E.
The proportion of free 30S to bound 30S (i.e., 30S subunits in 70S binary complexes) in the ΔrimM and parental strains was calculated using the 30S and 70S peak areas of the sucrose gradient profiles. The area of the 30S peak plus one-third the area of the 70S peak corresponds to the total 30S population as it contributes to the absorbance. The area of the 30S peak was divided by the total 30S absorbance to obtain the percentage of free 30S.
To obtain the polysome profiles (Ron et al. 1966), 100-mL cultures of the strains were grown in LB at 37°C to an OD600 of 0.2. Polysomes were stabilized by addition of chloramphenicol (Brow and Noller 1983) to a final concentration of 0.1 mg/mL and continued to shake for 2–3 min before the cultures were harvested in two conical tubes by centrifugation at 5000g for 10 min. Each pellet was resuspended in 0.5 mL of cold buffer containing 20 mM Tris-HCl, pH 7.5, 15 mM MgCl2, and transferred to plastic centrifuge tubes. Lysozyme was added to a final concentration of 1 mg/mL and the tubes incubated on ice for 15 min. The suspension was frozen in liquid nitrogen and then thawed slowly in a water bath at 30°C until melted. After three cycles of freezing and thawing, cell lysis was completed by adding 15 µL of 10% sodium deoxycholate and 10 µL of DNase I (1 mg/mL). The mixture was spun at 5000g for 15 min, and the supernatant was transferred to new plastic tubes. The sample concentration was determined by absorbance at 260 nm, and 10 A260 units of resuspended crude ribosomes were then applied to 10 mL 10%–40% (w/v) sucrose gradients prepared in buffer containing 10 mM Tris-HCl, pH 7.5, 50 mM KCl, 10 mM MgCl2, and 6 mM 2-mercaptoethanol. The gradients were spun for 3.5 h at 21,000g on a Beckman SW41 Ti rotor at 4°C. Gradients were fractionated using a Brandel fractionator apparatus and a syringe pump. The elution profile was monitored by UV absorbance at A260.
Analysis of cellular rRNA
Overnight cultures of the parental and ΔrimM strains were inoculated at a 1:100 dilution into fresh LB media and grown at 37°C with shaking to an OD600 of 0.2. Samples of 2 mL were then taken from the cultures and pelleted in a microcentrifuge at 9000g for 10 min. The rRNA from each sample was purified using the RNeasy mini kit (Qiagen) according to the manufacturer’s protocol. RNA concentration in the sample was then measured by A260, where 1 absorbance unit is equivalent to 40 μg/mL of RNA. Approximately 2 μg of purified RNA samples were loaded on an 8 M urea, 4% [w/v] polyacrylamide gel in 1× Tris-borate-EDTA (TBE) assembled in an adjustable slab gel apparatus (CBS Scientific Co.). Samples were resolved by electrophoresis at 300V for 16 h and then stained with ethidium bromide in 0.5× TBE for visualizing on a UV transilluminator.
Northern hybridization analysis followed the manufacturer’s protocol for the DIG (Digoxigenin) chemiluminescent nucleotide detection (Roche). The rRNA resolved on the 8 M urea, 4% [w/v] polyacrylamide gel was transferred to a nitrocellulose membrane using a Bio-Rad Transblot semi-dry transfer system at 25V for 45 min and fixed by exposing the membrane to UV light (302 nm) for 1.5 min. The membranes were equilibrated in Roche Easy-Hyb solution at 50°C for 30 min and then hybridized with 0.1–1 pmol/mL 3′ end DIG-dUTP-labeled oligonucleotide probes in Easy-Hyb solution containing 0.1 mg/mL poly-adenosine at 50°C, overnight. The sequences for the probes were as follows:
5′ probe (5′-TTAAGAATCCGTATCTTCGAGTGCCCACA-3′)
3′ probe (5′-TGTGTGAGCACTGCAAAGTACGCTTCTTTAAGGTAAGG-3′) and 16S internal probe (5′-GGGCCATGATGACTTGACGTCATCCCCACC-3′)
Labeling of the oligonucleotides at the 3′ end was performed with DIG Oligonucleotide Tailing Kit 2nd generation (Roche) following manufacturer protocols.
The hybridized membrane was washed, blocked, and developed for chemiluminescence according to manufacturer protocols (Roche). Membranes were exposed to Kodak BioMax XAR film, which was subsequently developed.
Membranes were first typically hybridized and developed with the 3′ probe, followed by subsequent hybridizations with the 5′ and 16S probes. A membrane stripping procedure was performed on the membranes between hybridizations. The probe was stripped by rinsing the membrane first with distilled water and then with boiling 0.1% SDS solution for 10 min. The membrane was then rinsed with wash buffer (100 mM maleic acid, 150 mM NaCl, pH 7.5, 0.3% [v/v] Tween 20) before hybridization with the next probe.
iTRAQ analysis
The 30S subunits from parental and ΔrimM E.coli cells were purified under dissociating and associating conditions, respectively. Total protein concentration in the samples was measured using the Bio-Rad Protein Assay (Bio-Rad). A total of 15 µg of protein was taken from each 30S subunit purification, precipitated with 80% ice-cold acetone, and washed twice with 100% acetone. The pellet was resuspended in buffer containing 0.5 M triethylammonium bicarbonate, 0.01% SDS, followed by protein reduction with Tris(2-carboxyethyl)phosphine and cysteine blockage with methylmethanethiosulfate. Samples were then digested with trypsin as described previously (Jiang et al. 2006).
Labeling of the peptides with the iTAQ reagents was done according to manufacturer protocols (AB SCIEX). The iTRAQ reagents 117 and 114 were used to label tryptic peptides from purified 30S subunits from ΔrimM and parental cells, respectively. Labeling reactions from both samples were combined and dried by lyophilization. iTRAQ-labeled peptides underwent NanoLC using a Dionex Ultimate 3000. Tryptic peptides were loaded onto a μ-Precolumn Cartridge and separated on an acetonitrile gradient (ranging from 5% to 60%) on a Nano LC column. Fractions were collected at 20-sec intervals, followed by mass spectrometry analysis on AB SCIEX TOF/TOF 5800 System (AB SCIEX). Mass spectra were acquired in positive ion reflection mode. TOF/TOF tandem MS fragmentation spectra were acquired for each ion, averaging 4000 laser shots per fragmentation spectrum (excluding trypsin autolytic peptides and other known background ions).
The resulting fragmentation spectra were submitted to GPS Explorer workstation equipped with MASCOT search engine (Matrix Science) to search the database of National Center for Biotechnology Information nonredundant (NCBInr). Searches were performed without constraining protein molecular weight or isoelectric point, with variable methylthiolation of cysteine and oxidation of methionine residues, fixed N-terminal- and lysine-modifications with iTRAQ labels, and one missed cleavage. Quantitation was performed on peptides displaying an ion score confidence interval of 99% or higher.
Cryo-electron microscopy and image analysis
Holey carbon grids with an additional continuous layer of thin carbon (5–10 nm) were glow discharged at 5 mA for 15 sec immediately before a 3.4 µL drop of sample was deposited on the grid. Samples contained purified 30S subunits from ΔrimM cells in buffer E at a concentration of 60 nM. We used a Vitrobot (FEI) to blot the grids and perform the vitrification of the specimen in liquid ethane. The blotting chamber of the Vitrobot was set up at 25°C and 100% relative humidity. Grids were blotted twice, 7 sec each time, before they were plunged into liquid ethane. Grids were transferred to a JEOL 2010F electron microscope operated at 200 kV using a Gatan 914 cryo-holder.
Electron micrographs were collected under low dose conditions (10–15 e−/Å2) at a nominal magnification of 50,000×. Electron micrographs were collected using a range of defocus from −1.5 to −4 µm and digitalized with a step size of 12.7 µm in a Nikon Supercool Scan 9000. The sampling of the images was 2.54 Å/pixel.
A total of 86,205 particles representing the 30S subunits purified from ΔrimM cells were selected from the micrographs using Boxer (Ludtke et al. 1999). CTF parameter estimation was done using CTFFIND (Mindell and Grigorieff 2003), and the CTF correction was performed using Xmipp (Scheres et al. 2008).
The 2D analysis of the projection images was performed using a reference-free maximum likelihood-based classification approach as implemented in the Xmipp (Scheres et al. 2008). The classification was run for a total of 100 iterations.
The supervised classification to separate contaminating projections of mature 30S subunits was performed as previously described (Jomaa et al. 2011a) using Spider (Valle et al. 2002; Gao et al. 2004). The three subpopulations of particles resulting from the classification were refined independently using the projection matching approach as implemented in the Xmipp program (Scheres et al. 2008). The initial maps for these refinements were produced using a maximum likelihood-based approach (Scheres et al. 2005b,c) to prevent model bias.
Classifications using a maximum likelihood-based approach were done as previously described (Scheres et al. 2005a,c, 2007). Briefly, the cryo-EM structure of the mature E. coli 30S subunit (Jomaa et al. 2011a) (EMDB ID 1775) low-pass filtered to 70 Å was used as an initial reference to produce four seeds from random subsets of experimental images by performing one iteration of maximum likelihood optimization. We obtained four homogeneous subpopulations after 25 iterations of maximum likelihood-based classification with these four seeds and twofold downscaled images of the data set. Each subpopulation of particles was referred back to the full size images to produce a 3D map using projection matching approaches. The reference maps for the projection matching refinements were produced from the particles in each subclass using a maximum likelihood-based refinement approach (Scheres et al. 2005b,c) to prevent model bias. Estimation of the resolution of the final maps was done from the even- and odd-numbered particles following the last cycle of refinement. Each group of particles produced a 3D map, and from the two maps, we obtained the Fourier shell correlation. Resolution value was obtained from this plot using the 0.5 criteria, and this value was used to low-pass filter the final three-dimensional reconstructions (Supplemental Fig. S1).
The Chimera program (Pettersen et al. 2004) was used to visualize the cryo-EM maps and to also perform the rigid body fitting of the X-ray structure of the E. coli 30S subunit (PDB ID: 2AVY) (Schuwirth et al. 2005) into the 3D density maps.
DATA DEPOSITION
The cryo-EM maps reported here have been deposited in the Electron Microscopy Data Bank. The EMDB IDs are 5595, 5596, 5597, and 5598 for the conformational subpopulations CL 1, CL 2, CL 3, and CL 4 in Figure 3, respectively.
SUPPLEMENTAL MATERIAL
Supplemental material is available for this article.
Supplementary Material
ACKNOWLEDGMENTS
We thank the staff at the EM Facility of the Faculty of Sciences and at the Canadian Centre for Electron Microscopy at McMaster. This work is supported by a grant from the National Science and Engineering Research Council of Canada (RGPIN288327-07) to J.O. A.J. is supported by a CIHR Doctoral Research Award. We thank Dr. Eric Brown for helpful discussions on the manuscript and making accessible clones from the Keio and ASKA collection. The funders had no role in study design, data collection and analysis, decision to publish, or preparation of the manuscript.
REFERENCES
- Adilakshmi T, Bellur DL, Woodson SA 2008. Concurrent nucleation of 16S folding and induced fit in 30S ribosome assembly. Nature 455: 1268–1272 [DOI] [PMC free article] [PubMed] [Google Scholar]
- Anantharaman V, Aravind L 2002. The PRC-barrel: A widespread, conserved domain shared by photosynthetic reaction center subunits and proteins of RNA metabolism. Genome Biol 3: RESEARCH0061. [DOI] [PMC free article] [PubMed] [Google Scholar]
- Baba T, Ara T, Hasegawa M, Takai Y, Okumura Y, Baba M, Datsenko KA, Tomita M, Wanner BL, Mori H 2006. Construction of Escherichia coli K-12 in-frame, single-gene knockout mutants: The Keio collection. Mol Syst Biol 2: 2006.0008 10.1038/msb4100050 [DOI] [PMC free article] [PubMed] [Google Scholar]
- Britton RA 2009. Role of GTPases in bacterial ribosome assembly. Annu Rev Microbiol 63: 155–176 [DOI] [PubMed] [Google Scholar]
- Brow DA, Noller HF 1983. Protection of ribosomal RNA from kethoxal in polyribosomes. Implication of specific sites in ribosome function. J Mol Biol 163: 27–46 [DOI] [PubMed] [Google Scholar]
- Bunner AE, Trauger SA, Siuzdak G, Williamson JR 2008. Quantitative ESI-TOF analysis of macromolecular assembly kinetics. Anal Chem 80: 9379–9386 [DOI] [PMC free article] [PubMed] [Google Scholar]
- Bylund GO, Persson BC, Lundberg LA, Wikstrom PM 1997. A novel ribosome-associated protein is important for efficient translation in Escherichia coli. J Bacteriol 179: 4567–4574 [DOI] [PMC free article] [PubMed] [Google Scholar]
- Bylund GO, Wipemo LC, Lundberg LA, Wikstrom PM 1998. RimM and RbfA are essential for efficient processing of 16S rRNA in Escherichia coli. J Bacteriol 180: 73–82 [DOI] [PMC free article] [PubMed] [Google Scholar]
- Bylund GO, Lovgren JM, Wikstrom PM 2001. Characterization of mutations in the metY-nusA-infB operon that suppress the slow growth of a ΔrimM mutant. J Bacteriol 183: 6095–6106 [DOI] [PMC free article] [PubMed] [Google Scholar]
- Campbell TL, Brown ED 2008. Genetic interaction screens with ordered overexpression and deletion clone sets implicate the Escherichia coli GTPase YjeQ in late ribosome biogenesis. J Bacteriol 190: 2537–2545 [DOI] [PMC free article] [PubMed] [Google Scholar]
- Campbell TL, Henderson J, Heinrichs DE, Brown ED 2006. The yjeQ gene is required for virulence of Staphylococcus aureus. Infect Immun 74: 4918–4921 [DOI] [PMC free article] [PubMed] [Google Scholar]
- Connolly K, Culver G 2009. Deconstructing ribosome construction. Trends Biochem Sci 34: 256–263 [DOI] [PMC free article] [PubMed] [Google Scholar]
- Daigle DM, Rossi L, Berghuis AM, Aravind L, Koonin EV, Brown ED 2002. YjeQ, an essential, conserved, uncharacterized protein from Escherichia coli, is an unusual GTPase with circularly permuted G-motifs and marked burst kinetics. Biochemistry 41: 11109–11117 [DOI] [PubMed] [Google Scholar]
- Datta PP, Wilson DN, Kawazoe M, Swami NK, Kaminishi T, Sharma MR, Booth TM, Takemoto C, Fucini P, Yokoyama S, et al. 2007. Structural aspects of RbfA action during small ribosomal subunit assembly. Mol Cell 28: 434–445 [DOI] [PMC free article] [PubMed] [Google Scholar]
- Gao H, Valle M, Ehrenberg M, Frank J 2004. Dynamics of EF-G interaction with the ribosome explored by classification of a heterogeneous cryo-EM dataset. J Struct Biol 147: 283–290 [DOI] [PubMed] [Google Scholar]
- Goto S, Kato S, Kimura T, Muto A, Himeno H 2011. RsgA releases RbfA from 30S ribosome during a late stage of ribosome biosynthesis. EMBO J 30: 104–114 [DOI] [PMC free article] [PubMed] [Google Scholar]
- Grishin NV 2001. KH domain: One motif, two folds. Nucleic Acids Res 29: 638–643 [DOI] [PMC free article] [PubMed] [Google Scholar]
- Guo Q, Yuan Y, Xu Y, Feng B, Liu L, Chen K, Sun M, Yang Z, Lei J, Gao N 2011. Structural basis for the function of a small GTPase RsgA on the 30S ribosomal subunit maturation revealed by cryoelectron microscopy. Proc Natl Acad Sci 108: 13100–13105 [DOI] [PMC free article] [PubMed] [Google Scholar]
- Hayes F, Hayes DH 1971. Biosynthesis of ribosomes in E. coli. I. Properties of ribosomal precursor particles and their RNA components. Biochimie 53: 369–382 [DOI] [PubMed] [Google Scholar]
- Himeno H, Hanawa-Suetsugu K, Kimura T, Takagi K, Sugiyama W, Shirata S, Mikami T, Odagiri F, Osanai Y, Watanabe D, et al. 2004. A novel GTPase activated by the small subunit of ribosome. Nucleic Acids Res 32: 5303–5309 [DOI] [PMC free article] [PubMed] [Google Scholar]
- Inoue K, Alsina J, Chen J, Inouye M 2003. Suppression of defective ribosome assembly in a rbfA deletion mutant by overexpression of Era, an essential GTPase in Escherichia coli. Mol Microbiol 48: 1005–1016 [DOI] [PubMed] [Google Scholar]
- Inoue K, Chen J, Tan Q, Inouye M 2006. Era and RbfA have overlapping function in ribosome biogenesis in Escherichia coli. J Mol Microbiol Biotechnol 11: 41–52 [DOI] [PubMed] [Google Scholar]
- Jiang M, Datta K, Walker A, Strahler J, Bagamasbad P, Andrews PC, Maddock JR 2006. The Escherichia coli GTPase CgtAE is involved in late steps of large ribosome assembly. J Bacteriol 188: 6757–6770 [DOI] [PMC free article] [PubMed] [Google Scholar]
- Jomaa A, Stewart G, Martin-Benito J, Zielke R, Campbell TL, Maddock JR, Brown ED, Ortega J 2011a. Understanding ribosome assembly: The structure of in vivo assembled immature 30S subunits revealed by cryo-electron microscopy. RNA 17: 697–709 [DOI] [PMC free article] [PubMed] [Google Scholar]
- Jomaa A, Stewart G, Mears JA, Kireeva I, Brown ED, Ortega J 2011b. Cryo-electron microscopy structure of the 30S subunit in complex with the YjeQ biogenesis factor. RNA 17: 2026–2038 [DOI] [PMC free article] [PubMed] [Google Scholar]
- Kitagawa M, Ara T, Arifuzzaman M, Ioka-Nakamichi T, Inamoto E, Toyonaga H, Mori H 2005. Complete set of ORF clones of Escherichia coli ASKA library (a complete set of E. coli K-12 ORF archive): Unique resources for biological research. DNA Res 12: 291–299 [DOI] [PubMed] [Google Scholar]
- Li Z, Pandit S, Deutscher MP 1999. RNase G (CafA protein) and RNase E are both required for the 5′ maturation of 16S ribosomal RNA. EMBO J 18: 2878–2885 [DOI] [PMC free article] [PubMed] [Google Scholar]
- Lindahl L 1975. Intermediates and time kinetics of the in vivo assembly of Escherichia coli ribosomes. J Mol Biol 92: 15–37 [DOI] [PubMed] [Google Scholar]
- Lovgren JM, Wikstrom PM 2001. Hybrid protein between ribosomal protein S16 and RimM of Escherichia coli retains the ribosome maturation function of both proteins. J Bacteriol 183: 5352–5357 [DOI] [PMC free article] [PubMed] [Google Scholar]
- Lovgren JM, Bylund GO, Srivastava MK, Lundberg LA, Persson OP, Wingsle G, Wikstrom PM 2004. The PRC-barrel domain of the ribosome maturation protein RimM mediates binding to ribosomal protein S19 in the 30S ribosomal subunits. RNA 10: 1798–1812 [DOI] [PMC free article] [PubMed] [Google Scholar]
- Ludtke SJ, Baldwin PR, Chiu W 1999. EMAN: Semiautomated software for high-resolution single-particle reconstructions. J Struct Biol 128: 82–97 [DOI] [PubMed] [Google Scholar]
- Mindell JA, Grigorieff N 2003. Accurate determination of local defocus and specimen tilt in electron microscopy. J Struct Biol 142: 334–347 [DOI] [PubMed] [Google Scholar]
- Nierhaus KH 1980. The assembly of the prokaryotic ribosome. Biosystems 12: 273–282 [DOI] [PubMed] [Google Scholar]
- Nord S, Bylund GO, Lovgren JM, Wikstrom PM 2009. The RimP protein is important for maturation of the 30S ribosomal subunit. J Mol Biol 386: 742–753 [DOI] [PubMed] [Google Scholar]
- Pettersen EF, Goddard TD, Huang CC, Couch GS, Greenblatt DM, Meng EC, Ferrin TE 2004. UCSF Chimera—a visualization system for exploratory research and analysis. J Comput Chem 25: 1605–1612 [DOI] [PubMed] [Google Scholar]
- Potrykus K, Cashel M 2008. (p)ppGpp: Still magical? Annu Rev Microbiol 62: 35–51 [DOI] [PubMed] [Google Scholar]
- Ron EZ, Kohler RE, Davis BD 1966. Polysomes extracted from Escherichia coli by freeze-thaw-lysozyme lysis. Science 153: 1119–1120 [DOI] [PubMed] [Google Scholar]
- Ross PL, Huang YN, Marchese JN, Williamson B, Parker K, Hattan S, Khainovski N, Pillai S, Dey S, Daniels S, et al. 2004. Multiplexed protein quantitation in Saccharomyces cerevisiae using amine-reactive isobaric tagging reagents. Mol Cell Proteomics 3: 1154–1169 [DOI] [PubMed] [Google Scholar]
- Sambrook J, Fritsch EF, Maniatis T 1989. Molecular cloning: A laboratory manual. Cold Spring Harbor Laboratory Press, Cold Spring Harbor, NY [Google Scholar]
- Scheres SH, Marabini R, Lanzavecchia S, Cantele F, Rutten T, Fuller SD, Carazo JM, Burnett RM, San Martin C 2005a. Classification of single-projection reconstructions for cryo-electron microscopy data of icosahedral viruses. J Struct Biol 151: 79–91 [DOI] [PubMed] [Google Scholar]
- Scheres SH, Valle M, Carazo JM 2005b. Fast maximum-likelihood refinement of electron microscopy images. Bioinformatics 21 (Suppl 2): i243–ii244 [DOI] [PubMed] [Google Scholar]
- Scheres SH, Valle M, Nunez R, Sorzano CO, Marabini R, Herman GT, Carazo JM 2005c. Maximum-likelihood multi-reference refinement for electron microscopy images. J Mol Biol 348: 139–149 [DOI] [PubMed] [Google Scholar]
- Scheres SH, Gao H, Valle M, Herman GT, Eggermont PP, Frank J, Carazo JM 2007. Disentangling conformational states of macromolecules in 3D-EM through likelihood optimization. Nat Methods 4: 27–29 [DOI] [PubMed] [Google Scholar]
- Scheres SH, Nunez-Ramirez R, Sorzano CO, Carazo JM, Marabini R 2008. Image processing for electron microscopy single-particle analysis using XMIPP. Nat Protoc 3: 977–990 [DOI] [PMC free article] [PubMed] [Google Scholar]
- Schuwirth BS, Borovinskaya MA, Hau CW, Zhang W, Vila-Sanjurjo A, Holton JM, Cate JH 2005. Structures of the bacterial ribosome at 3.5 Å resolution. Science 310: 827–834 [DOI] [PubMed] [Google Scholar]
- Shajani Z, Sykes MT, Williamson JR 2011. Assembly of bacterial ribosomes. Annu Rev Biochem 80: 501–526 [DOI] [PubMed] [Google Scholar]
- Sharma MR, Barat C, Wilson DN, Booth TM, Kawazoe M, Hori-Takemoto C, Shirouzu M, Yokoyama S, Fucini P, Agrawal RK 2005. Interaction of Era with the 30S ribosomal subunit implications for 30S subunit assembly. Mol Cell 18: 319–329 [DOI] [PubMed] [Google Scholar]
- Sieber G, Nierhaus KH 1978. Kinetic and thermodynamic parameters of the assembly in vitro of the large subunit from Escherichia coli ribosomes. Biochemistry 17: 3505–3511 [DOI] [PubMed] [Google Scholar]
- Srivastava AK, Schlessinger D 1990. Mechanism and regulation of bacterial ribosomal RNA processing. Annu Rev Microbiol 44: 105–129 [DOI] [PubMed] [Google Scholar]
- Suzuki S, Tatsuguchi A, Matsumoto E, Kawazoe M, Kaminishi T, Shirouzu M, Muto Y, Takemoto C, Yokoyama S 2007. Structural characterization of the ribosome maturation protein, RimM. J Bacteriol 189: 6397–6406 [DOI] [PMC free article] [PubMed] [Google Scholar]
- Sykes MT, Shajani Z, Sperling E, Beck AH, Williamson JR 2010. Quantitative proteomic analysis of ribosome assembly and turnover in vivo. J Mol Biol 403: 331–345 [DOI] [PMC free article] [PubMed] [Google Scholar]
- Talkington MW, Siuzdak G, Williamson JR 2005. An assembly landscape for the 30S ribosomal subunit. Nature 438: 628–632 [DOI] [PMC free article] [PubMed] [Google Scholar]
- Valle M, Sengupta J, Swami NK, Grassucci RA, Burkhardt N, Nierhaus KH, Agrawal RK, Frank J 2002. Cryo-EM reveals an active role for aminoacyl-tRNA in the accommodation process. EMBO J 21: 3557–3567 [DOI] [PMC free article] [PubMed] [Google Scholar]
- Williamson JR 2005. Assembly of the 30S ribosomal subunit. Q Rev Biophys 38: 397–403 [DOI] [PubMed] [Google Scholar]
- Wilson DN, Nierhaus KH 2007. The weird and wonderful world of bacterial ribosome regulation. Crit Rev Biochem Mol Biol 42: 187–219 [DOI] [PubMed] [Google Scholar]
Associated Data
This section collects any data citations, data availability statements, or supplementary materials included in this article.