Abstract

The adsorption of hen egg white lysozyme at a model charged surface is studied using fully atomistic molecular dynamics simulations. The simulations are performed over a 90 ns time scale which is sufficient to observe rotational and translational steps in the adsorption process. Electrostatics is found to play a key role in guiding the protein to the favorable binding orientation with the N,C-terminal face against the substrate. However, full immobilization appears to only occur through the strong interaction of Arg128 with the surface, facilitated by the protein’s flexibility at the terminal face. Simulated mutation at this residue confirms its crucial role. This work demonstrates that electrostatics alone might not be sufficient to guide the development of material systems that exploit protein adsorption and immobilization.
Understanding protein adsorption at solid surfaces is crucial for the development of many fields in nanotechnology, such as biomaterialisation,1 biomaterial production for medical devices, dental restoratives, drug delivery systems,2 or in vitro diagnostics.3,4 In recent work, we have employed molecular dynamics simulations to investigate the initial stages of hen egg white lysozyme (HEWL) adsorption on a charged silica surface, highlighting the important role electrostatics plays in aligning the protein to the surface and exposing its biologically active face to solution.5 Here, we present further simulations which lead to a surprising conclusion: while electrostatics guide the protein to a favorable orientation at the surface for adsorption, the protein appears to adsorb strongly through one residue only. In our simulations, HEWL remains largely intact when adsorbed, yet it possesses sufficient flexibility at its N,C-terminal face to allow this strong interaction to occur. This demonstrates that electrostatics alone might not be enough to guide the development of material systems that exploit protein adsorption and immobilization.
Lysozyme is a widely studied protein with a well-characterized structure.6 Its adsorption onto surfaces provides a model system for both experiment and simulation, since it is large enough to take a compact globular structure yet is small enough for detailed atomistic modeling. In-liquid atomic force microscopy (AFM) has been used to image the early stages of the development of a lysozyme layer on mica, which presents a flat, charged surface for the adsorption and clustering of the protein.7,8 A comparison of AFM images and Monte Carlo simulation show that the adsorbed protein has a surface mobility ∼9 orders of magnitude lower than that in solution, and that full immobilization of the protein only occurs once large, two-dimensional protein clusters have formed.9
The paradigm for understanding adsorption in this system is that electrostatics plays a crucial role in guiding the protein to bare substrate and causing it to adsorb. Many models employ a rigid molecule approximation in order to simulate the evolution of protein layers.10−12 In order to test the validity of this approach, and to learn more details of the process, we have recently used fully atomistic molecular dynamics simulations of lysozyme adsorption onto a model charged silica surface.5,13 We found that 20 ns trajectories were sufficient to understand the initial stages of adsorption, and clearly showed that electrostatics can steer the protein adsorption.
In this work, we extend this study to a 90 ns time scale, which allows us to investigate the role of electrostatics more fully. In particular, these simulations are long enough for protein rotations and translations to play a role in the dynamics of adsorption. As we shall show, this time scale also allows us to investigate the diffusion of weakly adsorbed protein across the surface. We have also investigated the impact of mutating a certain residue in the lysozyme sequence in order to clarify its role in the adsorption. As a result, we can now formulate a more complete picture of the protein adsorption process, one that has important consequences for the future design of material systems exploiting surface functionalization.
We study the adsorption of lysozyme starting in a water box at pH 7 with the surface presented at four different orientations. We believe that this provides a reasonable exploration of possible adsorption geometries, since the protein has the possibility of moving to find suitable adsorption states.5 Furthermore, our previous simulations of a cage system have not revealed viable alternatives. All the computational model details may be found in the Methods section given in the Supporting Information.
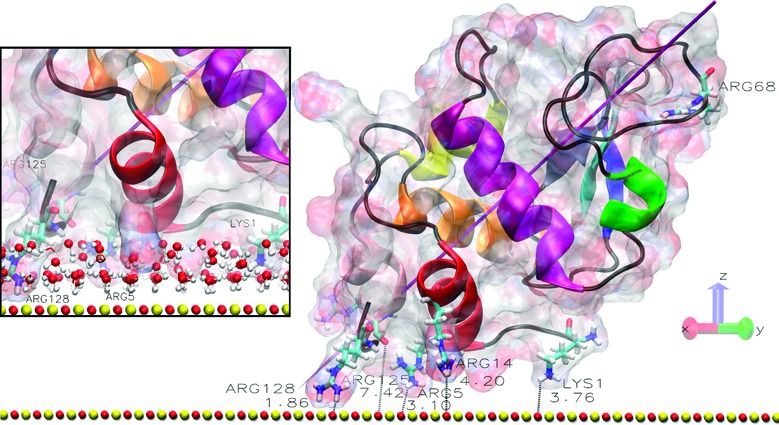
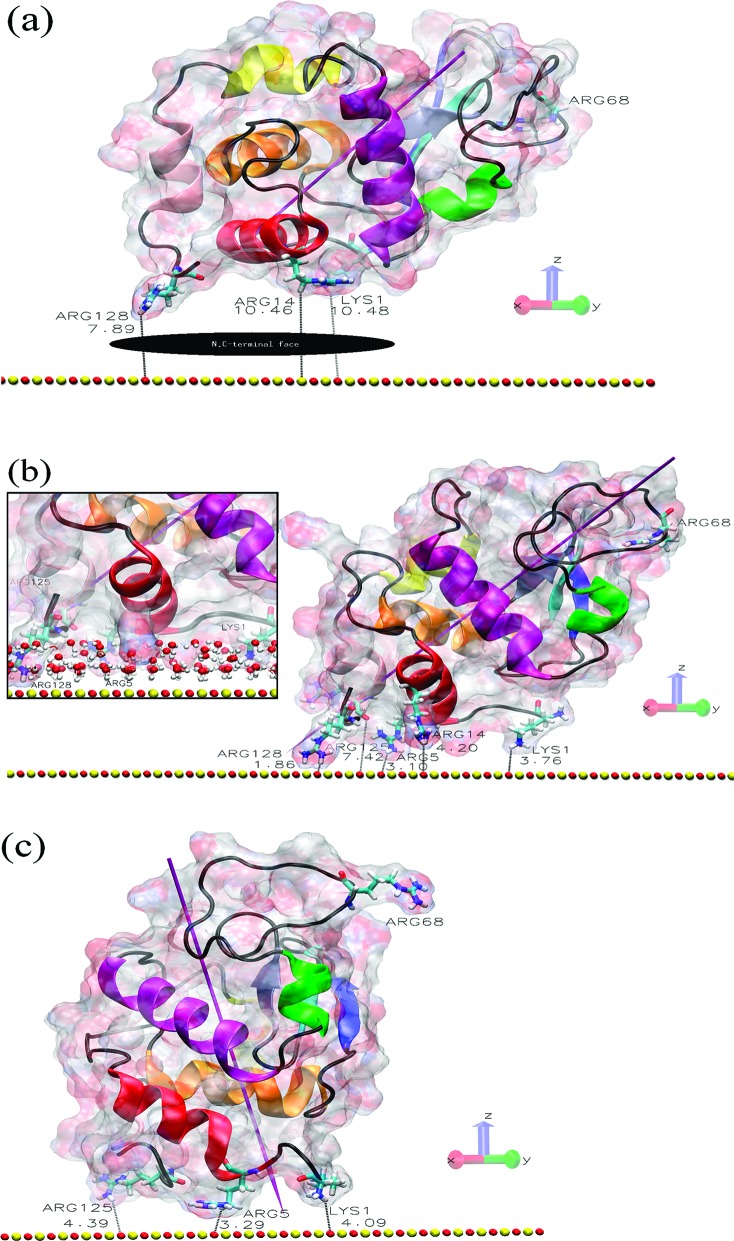
In Figure 1a, we show the starting position for orientation O1, which leads to adsorption of the protein as shown in Figure 1b. Since this is the most common adsorbed state we have found in our study, we have simulated four separate 90 ns trajectories starting in O1 to test that they all lead to essentially the same final adsorbed state. Repeating the O1 simulations with different initial velocities gives more confidence that the adsorbed state shown in Figure 1a is representative of the true adsorbed configuration. In the Supporting Information, we show that indeed all of these trajectories do lead to the adsorbed state we described previously after only a 20 ns trajectory.5 Here, the dipole moment of the protein points toward the surface, and the protein adsorbs at its N,C-terminal face as observed experimentally.14,15 We also provide a movie of the O1 adsorption process in the Supporting Information, which shows that the protein essentially is adsorbed after about 10 ns and thereafter is anchored to the surface via the residue Arg128. The distance between Arg128 and the nearest surface atom (∼1.9 Å) is shown in Figure 1b. This small distance shows that the residue has penetrated the structured water layers that form above the charge solid surface, as illustrated in the inset of Figure 1b. Likewise, the other O1 trajectories displayed in the Supporting Information show the same feature.
Figure 1.
Protein and surface relative orientation before and after a 90 ns trajectory. (a) Initial view of the HEWL−surface positions in orientation O1 with the N,C-terminal protein face indicated. (b) Final structure of the O1 system, where the inset shows the penetration of the surface water layers. (c) Final structure of the O1_90 ns_R128G simulation, where we start with the O1 structure after the 90 ns adsorption trajectory and then mutate Arg128 to Gly128 and simulate a subsequent 90 ns trajectory (for further details, see the Methods section in the Supporting Information). The shortest protein−surface distances (in Å) are shown, and important residues are labeled. The surface atoms are shown as red (oxygen atoms) and yellow (silicon) spheres. The HEWL surface is shown as a ghost surface colored by charge, with protein secondary structure elements indicated as a cartoon and colored as follows: red, helix A; orange, helix B; purple, helix C; yellow, helix D; pink, helix 310 from domain α; green, helix 310 from domain β; blue, sheet β1; cyan, sheet β2; gray, sheet β3; black, other structures including loops. Important residues are shown as licorice and colored by element (hydrogen, white; carbon, cyan; nitrogen, blue; oxygen, red). The magenta needle indicates the protein dipole moment.
The simulation with orientation O2 starts with the surface facing the opposite side of the protein from O1 at a separation of ∼7 Å. Here, we find that the protein diffuses away from the surface, as expected because its dipole moment points this way too. Since we are utilizing periodic boundary conditions, the protein then adsorbs to the image of the surface at the top of the water box in the conformation found before (the image surface started ∼10 Å from the protein’s N,C-terminal face). In orientation O3, with the surface initially facing the left-hand side of the protein as viewed in Figure 1a, we find that the protein rotates during the simulation to once again adsorb at the N,C-terminal face and become anchored at Arg128. These simulations highlight the role that electrostatics plays in rotating and steering the protein to the best orientation for adsorption, followed by the strong interaction with the surface via the water layers. The simulated trajectories are sufficiently long to capture any important translational and rotational diffusive events in the initial stages of adsorption.
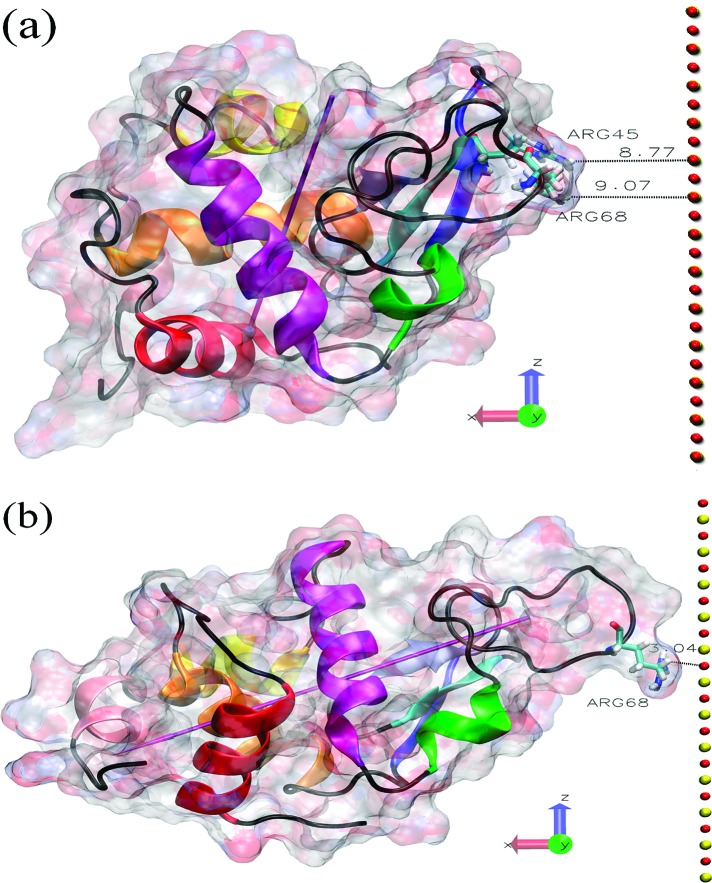
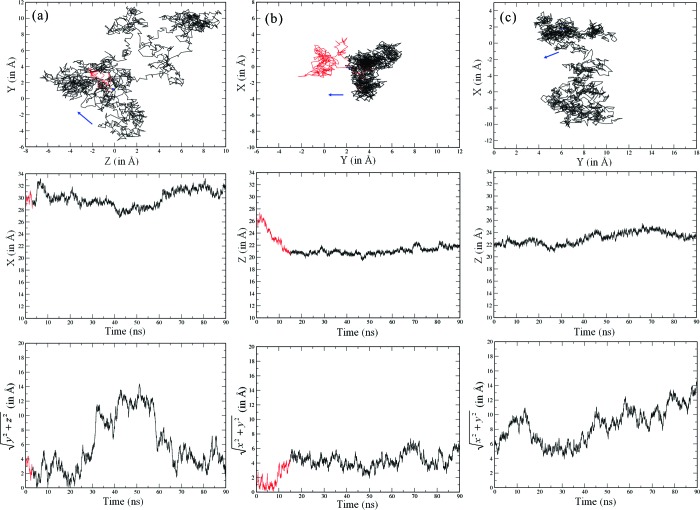
Our fourth orientation O4 starts with the surface facing the right-hand side of the lysozyme, as illustrated in Figure 2a. As shown in Figure 2b, this simulation leads to the adsorption of the protein in an alternative site located at Arg68 in a flexible loop region. The dipole moment here points away from the surface, and it is apparent that the lysozyme is somewhat stretched away from the surface. The typical distance between Arg68 and the nearest surface atom is ∼3 Å, showing that the lysozyme is not strongly anchored in this configuration since the inner water layer on the surface is not disrupted. The movie for this O4 trajectory, provided in the Supporting Information, shows that Arg68 can diffuse above the inner water layer with a hop frequency of about ∼108 s−1, yielding a surface diffusion constant of the protein of ∼10−8 cm2 s−1, 2 orders of magnitude below that in bulk solution.16 In Figure 3a, we show the trace of the lysozyme’s center of mass over time found in this O4 simulation, demonstrating this surface diffusion. For comparison, we show in Figure 3b the center of mass movement for the O1 simulation, demonstrating the anchoring effect of Arg128 penetrating the inner water layer.
Figure 2.
Protein−surface relative orientation. (a) Initial state of the O4 system. (b) Final structure of the O4 system after the 90 ns trajectory. The coloring scheme is the same as that in Figure 1. In both cases, the shortest initial and final protein−surface distances (in Å) are shown.
Figure 3.
Protein center of mass (COM) diffusion: (a) O4, (b) O1, and (c) O1_90 ns_R128G. The top plots show plan views of the diffusion across the plane of the surface, with blue dots showing the starting points and the arrows indicating the COM displacement after 0.1 ns. The red part of the plot indicates the diffusion before and during adsorption, and the black part indicates the diffusion on the surface. The middle plots show changes in time of the COM distance perpendicular to the surface. The bottom plots show the distance diffused by the COM across the surface plane over time.
The surface diffusion of the lysozyme in orientation O4 is not in line with experimental observations which reveal a much lower surface diffusion constant (∼10−15cm2 s−1).8 We therefore conclude that O4 is not a long-term adsorption state. It is possible that it is an artifact of starting the simulation with the surface so close to the protein, so that the steering effect of the electrostatics does not have time to operate. Moreover, the protein dipole moment steering effect may be underestimated since a 12 Å cutoff was used for the electrostatics in these calculations, and it may partially explain why reorientation of O4 is not observed in the 90 ns time scale. Even if a lysozyme were to adsorb in this orientation, it is likely that during its subsequent surface diffusion the protein would come to reorient itself into the stronger O1 binding state. Of course, we do not expect to see the lysozyme in O1 diffuse across the surface during the accessible time scale of our simulations, given the very small magnitude observed experimentally.8,9
We turn finally to the role of Arg128 in anchoring the lysozyme in the orientation O1 adsorption state. We consistently find that this residue plays the dominant role, which is clearly related to its positive charge (at pH 7) and the length of its side group. We therefore have performed simulations with this residue replaced with Gly, a neutral residue with the shortest possible side group (hydrogen). Starting a new trajectory above the surface in O1 with this mutation, we find that the lysozyme does not adsorb in the first 10 ns or so but diffuses in the bulk for about 85 ns before starting to adsorb at the upper image surface (see the Supporting Information). When we instead start a mutated lysozyme trajectory from the previously adsorbed state in O1, we find that the lysozyme interacts weakly with the surface in a manner similar to orientation O4. While Arg125 can temporarily penetrate the water layers, it has restricted flexibility since it belongs to the helix 310 from domain α and so does not anchor the protein in the way Arg128 does (Figure 1c). As a consequence, the mutated lysozyme now diffuses on the surface water layer at a comparable rate to that found with O4, as illustrated in its center-of-mass trace in Figure 3c.
The results from these simulation studies of lysozyme adsorption at a charged solid surface imply that the paradigm of electrostatic steering of protein adsorption processes does not in itself provide a full understanding. Instead, protein immobilization occurs through the strong interaction between the surface and charged residues in flexible locations on the protein surface, and these residues must penetrate the water layers that form above the surface for strong adsorption to occur. For lysozyme, the electrostatics will guide the adsorbing protein to present its N,C-terminal face to the surface, where Arg128 has this necessary flexibility. In doing this, the protein largely retains its secondary and tertiary structure, and in particular the active site of protein remains intact and exposed to solution.5 Thus, the adsorbed protein is expected to keep its activity when adsorbed on a flat surface. Of course, we must keep in mind that some of the effects we find in our simulation might be artifacts of the force field or the parametrizations we have used. Nevertheless, the experimental observation of adsorbed lysozyme keeping its activity supports our conclusions.17,18
This emerging picture of protein adsorption at charged surfaces implies new design rules for surface functionalization through protein adsorption. Specifically, while electrostatics are important for guiding the protein to adsorption sites, it appears that suitably charged residues in flexible regions are required to anchor the protein.
Acknowledgments
This work was supported by the UK Engineering and Physical Sciences Research Council through Grant Number EP/E012284 and by the University of Strathclyde. Parts of our results were obtained using the National Service for Computational Chemistry Software (NSCCS) resources, URL: http://www.nsccs.ac.uk.
Supporting Information Available
Initial and final protein orientations on the surface, protein penetration through the water layers, movies showing protein dynamics and methods description. This material is available free of charge via the Internet at http://pubs.acs.org.
Supplementary Material
References
- Sarikaya M.; Tamerler C.; Jen A. K. Y.; Schulten K; Baneyx F. Nat. Mater. 2003, 2, 577. [DOI] [PubMed] [Google Scholar]
- Huebsch N.; Mooney D. J. Nature 2009, 462, 426. [DOI] [PMC free article] [PubMed] [Google Scholar]
- Peng G.; Tisch U.; Adams O.; Hakim M.; Shehada N.; Broza Y. Y.; Billan S.; Abdah-Bortnyak R.; Kuten A.; Haick H. Nat. Nanotechnol. 2009, 4, 669. [DOI] [PubMed] [Google Scholar]
- Lee H.; Yoon T. J; Weissleder R. Angew. Chem., Int. Ed. 2009, 48, 5657. [DOI] [PMC free article] [PubMed] [Google Scholar]
- Kubiak K.; Mulheran P. A. J. Phys. Chem. B 2009, 113, 12189. [DOI] [PubMed] [Google Scholar]
- Sauter C.; Otalora F.; Gavira J.-A.; Vidal O.; Giege R.; Garcia-Ruiz J. M. Acta Crystallogr., Sect. D: Biol. Crystallogr. 2001, 57, 1119. [DOI] [PubMed] [Google Scholar]
- Kim D. T.; Blanch H. W; Radke C. J. Langmuir 2002, 18, 5841. [Google Scholar]
- Mulheran P. A.; Pellenc D.; Bennett R. A.; Green R. J.; Sperrin M. Phys. Rev. Lett. 2008, 100, 068102. [DOI] [PubMed] [Google Scholar]
- Pellenc D.; Bennett R. A.; Green R. J.; Sperrin M; Mulheran P. A. Langmuir 2008, 24, 9648. [DOI] [PubMed] [Google Scholar]
- Ravichandran S.; Madura J. D.; Talbot J. J. Phys. Chem. B 2001, 105, 3610. [Google Scholar]
- Carlsson F.; Hyltner E.; Arnebrant T.; Malmsten M.; Linse P. J. Phys. Chem. B 2004, 108, 9871. [Google Scholar]
- Hsu H. J.; Sheu S. Y.; Tsay R. Y. Colloids Surf., B 2008, 67, 183. [DOI] [PubMed] [Google Scholar]
- Mulheran P. A; Kubiak K. Mol. Simul. 2009, 35, 561. [Google Scholar]
- Aizawa T.; Koganesawa N.; Kamakura A.; Masaki K.; Matsuura A.; Nagadome H.; Terada Y.; Kawano K.; Nitta K. FEBS Lett. 1998, 422, 175. [DOI] [PubMed] [Google Scholar]
- Dismer F.; Petzhold M.; Hubbuch J. J. Chromatogr., A 2008, 1194, 11. [DOI] [PubMed] [Google Scholar]
- Dubin S. B.; Noel A. C.; Benedek G. B. J. Chem. Phys. 1971, 54, 5158. [Google Scholar]
- Ding H. M.; Shao L.; Liu R. J.; Xiao Q. G.; Chen J. F. J. Colloid Interface Sci. 2005, 290, 102. [DOI] [PubMed] [Google Scholar]
- Nguyen T. T. B.; Chang H. Ch.; Wu V. W. K. Diamond Rel. Mater. 2007, 16, 872. [Google Scholar]
Associated Data
This section collects any data citations, data availability statements, or supplementary materials included in this article.


