

Abstract
Although cooperation and trust are essential features for the development of prosperous populations, they also put cooperating individuals at risk for exploitation and abuse. Empirical and theoretical evidence suggests that the solution to the problem resides in the practice of mimicry and imitation, the expectation of opponent’s mimicry and the reliance on similarity indices. Here we fuse the principles of enacted and expected mimicry and condition their application on two similarity indices to produce a model of mimicry and relative similarity. Testing the model in computer simulations of behavioral niches, populated with agents that enact various strategies and learning algorithms, shows how mimicry and relative similarity outperforms all the opponent strategies it was tested against, pushes noncooperative opponents toward extinction, and promotes the development of cooperative populations. The proposed model sheds light on the evolution of cooperation and provides a blueprint for intentional induction of cooperation within and among populations. It is suggested that reducing conflict intensities among human populations necessitates (i) instigation of social initiatives that increase the perception of similarity among opponents and (ii) efficient lowering of the similarity threshold of the interaction, the minimal level of similarity that makes cooperation advisable.
Keywords: conflict resolution, prisoner’s dilemma, SERS, TFT, WSLS
Cooperation among individuals is a key determinant of prosperous populations (1, 2), yet cooperative individuals are prone to exploitation by competitive and hostile opponents. How then can organisms evolve cooperative behaviors? Theoretical and empirical evidence suggests that a key to this riddle may reside in the reliance on mimicry, similarity, and imitation. Coevolution of various species demonstrates how mimicry of color, movement, and shape provides powerful protection against predators, helps in luring prey (3), and enables parasites to attain cooperative behavior from their hosts (4). Among humans, similarity induces interpersonal attraction (5), affiliation (6), rapport (7), generosity (8), and cooperation (9–11). Imitation provides the means for learning and coping with social and strategic structures (12–17), whereas homophilous imitation, the imitation of others who are similar to one’s self, generates stable and homogeneous populations (18). Simulation studies of the evolution of cooperation using the prisoner’s dilemma (PD) paradigm (Table 1) revealed two powerful strategies, each representing a different aspect of mimicry and imitation. Tit for tat (TFT) (19), which looks backward and mimics opponent’s previous move; and win–stay, lose–shift (WSLS) (20), which looks ahead by initiating a cooperative move whenever both opponents have made identical choices. Animating both strategies, we may describe TFT as enacting mimicry and WSLS as expecting similar opponents to make matching cooperative choices. Nevertheless, not any instance of observed similarity indicates the existence of a genuine and sufficiently high level of similarity. The occurrence of similar choices may result from stochastic processes, be strategically manipulated, or result from a rather low level of similarity. Subjective expected relative similarity (SERS) theory (10) shows that every PD game, as well as other similarity sensitive interactions (11), has a similarity threshold that distinguishes among insufficiently and sufficiently high levels of an opponent’s similarity (Table 1). As shown in the present work, fusing the principles embedded in TFT and WSLS while conditioning their function on SERS generates an overwhelmingly powerful and cooperative strategy. The merged mechanism is backward- and forward-looking; it fights noncooperative opponents and promotes the evolution of cooperation in its environment.
Table 1.
PD game and SERS solution
| Player 1 | Player 2 | |
| Cooperate | Defect | |
| Cooperate | R, R | S, T |
| Defect | T, S | P, P |
Payoffs for player 1(left value in each cell) and player 2 (right value in each cell) are denoted as T, R, P, and S, where T > R > P > S and 2R > S + T, to define the PD structure. Introducing ps, the probability that indicates the extent of similarity with the opponent, which can be estimated from the relative frequency of both players choosing the same action (cooperate/cooperate or defect/defect) in previous encounters of a repeated game, we denote the expected payoffs for cooperation (ps × R + (1 − ps) × S) and defection (ps × P + (1 − ps) × T), respectively. Hence similarity-focused and payoff-maximizing individuals may take the risk associated with cooperation whenever the similarity with the opponent exceeds the threshold: ps* = (T − S)/(T − S + R − P). This threshold minimizes the risks associated with the choice of cooperation and is hence used by MaRS agents for the evaluation of passive and reactive similarity indices.
Mimicry and Relative Similarity
Combining the principles embedded within TFT, WSLS, and SERS, we derive a strategy of mimicry and relative similarity (MaRS) that is applicable to repeated PD conflicts as well as to other strategic interactions that are sensitive to an opponent’s similarity (11). MaRS is a simple strategy that switches among three states of mimicry—enacted, expected, and excluded—allowing it to select an optimal response for every opponent and stage of the game (Table 2). Enacted mimicry resembles TFT, expected mimicry resembles WSLS’s shift toward cooperation, and excluded mimicry turns off all cooperative tendencies and transforms MaRS into a defector. The transitions from one state of mimicry to another are guided by the current extent of similarity between the opponent and itself. MaRS monitors two types of similarity by updating two respective registries in a first-in-first-out manner: (i) the passive similarity registry that reflects the proportion of similar choices, regardless of whether they were cooperative or hostile; and (ii) the reactive similarity registry that reflects the opponent’s propensity to reciprocate switches toward cooperation that were initiated by MaRS. The former is updated by using values of 1 and 0 for similar and dissimilar choices, respectively. The latter is updated by values of 1 and 0 for reciprocated and nonreciprocated switches, respectively. Nevertheless, to assure further the genuine nature of reciprocated cooperative switches, MaRS continues to monitor the succeeding moves. If the opponent switches back to defection, the reactive registry is updated with −1, thus canceling out the 1 earned for the previous reciprocation. Continuously monitoring both similarity types allows computing two indices and applying them as criteria for the selection and transition among the states of mimicry. As derived from SERS, the indices are weighed in respect to the similarity threshold of the game, ps*. This threshold is the precise level of similarity that accounts for an identical expected payoff, regardless whether one chooses to cooperate or to defect [referring to the PD game payoffs of T,R,P, and S, where T > R > P > S and 2R > S + T, ps* = (T − S)/(T − S + R − P); Table 1]. If similarity with the opponent exceeds this threshold, cooperation provides a higher expected value than defection. If similarity fails to reach the threshold, the choice of defection promises a better expected value. As the choice among the three mimicry modes also involves taking the risk associated with cooperation (e.g., mimicking a cooperative move in enacted mimicry or initiating cooperation while using expected mimicry), ps* provides an adequate criterion for assessing the magnitude of both similarity indices.
Table 2.
MaRS strategy
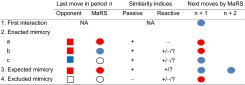 |
The MaRS strategy comprises enacted, expected, and excluded mimicry. The moves of MaRS and its opponent are denoted by circles and squares. Cooperation and defection are indicated by blue and red colors, respectively. Empty circles or squares indicate that the actual choice is not important. “+”, “−”, and “?” indicate that the current similarity index (passive or reactive) is above or below the similarity threshold ps* of the game, or that its value is yet unknown, where ps* = (T – S)/(T – S + R - P); “n”, “n + 1”, and “n + 2” denote subsequent moves. Note that only expected mimicry defines the next two moves. NA, not available.
The operation of MaRS can be described in terms of its switches among the three mimicry modes (Fig. 1) or in terms of its transitions among the choices of cooperation and defection (Fig. 2). SI Appendix, Tables S1–S3, provide further details by showing a step-by-step example of a repeated PD game between MaRS and a random playing opponent, as well as a comparison with TFT and WSLS playing against the same sequence of random moves. SI Appendix, Appendix 1, describes the function of MaRS in a pseudoprogramming code. Note that the capacity of MaRS’s similarity registries is a free parameter. Large capacities reflect long memory spans and slow adaptation rates, whereas small capacities reflect short memory spans and fast adaptation rates. Although it is not easy to predict which memory span will provide an optimal performance when interacting with unfamiliar opponents, delaying the use of the reactive memory for a few interactions helps to prevent premature conclusions in regard to the reactive similarity with the opponent. Such a delay reflects the need of organisms to orient themselves and adapt to the behavior of their opponents. The simulations presented hereafter approximate the capacities typically attributed to human working memory, which holds 7 ± 2 items (21) and delays the use of the reactive memory until it contains five items.
Fig. 1.

The transition of MaRS among three mimicry modes: enacted, expected, and excluded. Each transition is conditioned upon the detection of up-to-date similarity levels by the passive similarity index psp, the reactive similarity index psr, or both. The criterion for sufficient similarity is the similarity threshold ps*, which is derived from the game’s payoff matrix, whereby ps* = (T − S)/(T – S + R − P). “psr = ?” indicates that the extent of reactive similarity has not yet been determined. Note that the transitions start at the third interaction, at which point a mimicry type has already been determined and MaRS considers its next move.
Fig. 2.

The transitions of MaRS among the choices of cooperation (marked as “C”) and defection (marked as “D”) for a repeated PD game. The arrows are marked with ordered triples (opponent’s last move, passive similarity rank, reactive similarity rank) defining the conditions for each type of transition. Plus sign, minus sign, and question mark indicate whether the current value of the similarity index, either psp or psr, is above (or identical) or below the similarity threshold ps*, or whether its value has not yet been determined, whereby ps* = (T − S)/(T − S + R − P). An asterisk accounts for all possible states of the similarity indices; a question mark indicates that the value of the index is yet undefined. Each triplet is labeled with the relevant type of mimicry: enacted, expected, or excluded. Note that, for all cases of enacted mimicry, the passive similarity value is above the similarity threshold (+), and that, for all cases of excluded mimicry, the passive similarity value is below the similarity threshold (−). Also note that, in the case of expected mimicry, MaRS cooperates twice. t = 0 indicates that the game is about to begin.
Testing MaRS in Simulated Behavioral Niches
To test the performance of MaRS, we constructed several artificial behavioral niches composed of simulated strategies and learning algorithms that interact in a repeated PD roundtable competition over many generations. At the termination of each generation, the pooled gains of each strategy are transformed into a new proportion of agents that enact the same strategy during the next generation. This procedure simulates selection pressures, generating a growth in the number of successful agents and a decrease in the number of less successful ones.
We populate the simulated niches with two sets of strategies. The first set consist of strategies, typically associated with the PD game, comprising nonreactive cooperators (all C), nonreactive defectors (all D), random playing agents (random), TFT (17), and WSLS (18).
The second set consists of five prominent stimulus- and belief-based learning algorithms: (i) reinforcement learning (22, 23), a simple stimulus-learning mechanism that chooses each action with a probability proportional to the relative gains earned while using it in previous encounters; (ii) payoff-sampling learning (24, 25), which randomly samples payoffs obtained following the use of each choice; (iii) impulse-balance learning (25, 26), which examines the gap between obtained and forgone payoffs and generates impulses toward better choices; (iv) fictitious play (27, 28), which maximizes the payoffs against the entire history of opponent’s previous choices; and (v) action-sampling learning (25), which optimizes its actions against a random sample of the opponent’s previous choices and thus constitutes a stochastic version of fictitious play.
Fig. 3 depicts the evolutionary course developing from six different initial population compositions. Fig. 3A depicts the evolutionary course of an initial population that comprises of six strategies: MaRS and five other strategies typically associated with the PD game. After the extinction of the nonreactive defectors and the random playing agents, the proportion of all cooperative strategies stabilizes to form a cooperative population in which most agents are MaRS, followed by TFT, WSLS, and nonreactive cooperators. Fig. 3B depicts the evolutionary course of an identical set of six strategies, but with an enlarged proportion of unconditional defectors and random agents. Although, initially, the unconditional defectors prosper, soon their course of development changes. After the extinction of the nonreactive defectors and the random playing agents, the proportion of all remaining strategies stabilizes to form a cooperative population with a meaningful majority of MaRS agents, followed by TFT, a small proportion of WSLS, and a tiny proportion of nonreactive cooperators (i.e., all C). Note that, although Fig. 3 A and B depicts a convergence to two different equilibria, they point to the existence of a continuum of such states. To outline their range consider the existence of any proportion of the four cooperative strategies (MaRS, TFT, WSLS, and all C) while setting the number of all D and random playing agents to zero. As all cooperative strategies cooperate in each and every encounter with all others, no evolutionary dynamics develop and the proportions of the cooperative strategies in the initial population do not change. However, modifying the original population by adding all D and random agents is expected to diminish the fitness of the cooperative strategies and account for changes in the composition of the population. A crucial factor in this dynamics is the function of MaRS, which identifies the intruders, acts to diminish their number (SI Appendix, Fig. S2), and restores the cooperative nature of the population. When the hostile and random agents have been removed, the population converges, as depicted in Fig. 3 A and B, and its exact composition depends on the proportions of the initial population and the number of generations that passed before the convergence has been reached.
Fig. 3.

Evolutionary simulations of six behavioral niches initially populated with different combinations of strategies. Every generation comprises interactions of all agents with all other agents in a repeated PD game (T = 5, R = 3, P = 1, S = 0; ps* = 0.71) with 200 repetitions. At the termination of each generation, the aggregated gains of each strategy are transformed into a new and proportional composition of agents, which then forms the population of agents for the next generation. Every population on the left side (panels A, C, and E) has a parallel population with an initially enlarged proportion of hostile and unpredictable agents presented on the right side (panels B, D, and F). Learning algorithms were equipped with memory spans of seven items; the MaRS passive and reactive similarity indices were activated after containing one and five items, respectively, and were restricted to a maximum of 10 items. Each panel consists of the averages over 100 evolutionary runs with identical initial conditions.
Fig. 3C depicts the evolutionary course of an initial population with equal proportions of MaRS and five learning strategies. After a few generations, all learning strategies go extinct and MaRS agents take over the entire population. Fig. 3D depicts the evolutionary course of an extended and rather hostile population that also contains many nonreactive defectors and random playing agents. As before all strategies, including all D and random, go extinct and the population becomes fully cooperative, populated exclusively by MaRS agents. Fig. 3E depicts the evolutionary course of an initial population with equal proportions of all 11 strategies. Most agents go extinct within 10 generations, and the only surviving strategies are MaRS, followed by TFT and a rather small proportion of unconditional cooperators. The converged population has become completely cooperative. Fig. 3F depicts the evolutionary course initially composed of the same 11 types of agents, but with an enlarged proportion of unconditional defectors and random behaving agents. Although, initially, the unconditional defectors prosper, soon their course of development changes and the cooperative agents take over. Finally, all agents go extinct except for three cooperative strategies: MaRS followed by TFT and a small proportion of WSLS agents. As before, the converged population has become completely cooperative.
Although the aforementioned simulations reveal the performance of MaRS while confronting many other prominent rivals, embedded in various environments, all simulations were conducted while using a single matrix of the PD game, whereby T = 5, R = 3, P = 1, and S = 0, reflecting a similarity threshold of ps* = 0.714. Nevertheless, there exists a direct relation between higher thresholds and MaRS’s advantage over other strategies (SI Appendix, Fig.S1). The reason for the increased advantage of MaRS stems from the costs it pays for misidentifying an opponent for being sufficiently similar, hence applying enacted mimicry instead of excluded mimicry, or for attempting to assess an opponent’s reactive similarity by applying expected mimicry. When the payoff matrix has a low similarity threshold, short and hence nonrepresentative samples of random opponents or short samples of strategies that are almost sufficiently similar may seem to reveal sufficient similarity and motivate risky moves. Such nonrepresentative samples become scarcer when the required similarity threshold has higher values. Importantly, this does not lead to the conclusion that MaRS performs poorly when encountering random opponents. In fact, a key advantage of MaRS is that it is not easily misled by random playing agents. If the passive similarity with the opponent is insufficiently high, sporadic cooperative moves will not be reciprocated, nor will they motivate MaRS to switch to expected mimicry. Even if a random opponent has exhibited several instances of sufficient similarity, motivating MaRS to apply expected mimicry, the consequences will be monitored by the reactive similarity registry and are likely to prevent such moves in future encounters (SI Appendix, Table S1). In fact, adding random agents to a heterogeneous population actually increases the advantage of MaRS (SI Appendix, Fig. S2).
Discussion
Fusing enacted and expected mimicry generates a powerful and cooperative mechanism that enhances fitness and reduces the risks associated with trust and cooperation. When conflicts take the form of repeated PD games, individuals get the opportunity to learn and monitor the extent of similarity with their opponents. They can then react by choosing whether to enact, expect, or exclude mimicry. This rather simple behavior has the capacity to protect individuals from exploitation and drive the evolution of cooperation within entire populations. Like TFT, MaRS paves the way for the induction of cooperation and supports the survival of other cooperative strategies (29). The existence of MaRS in heterogeneous populations helps those cooperative strategies that do not have the capacity of MaRS to combat hostile and random opponents. Despite the fact that MaRS cannot prevail in a duel with an unconditional defector, interacting within heterogeneous populations allows MaRS to fight unpredictable and hostile strategies and cooperate with cooperative ones, including itself. This capacity enables a handful of MaRS agents to invade a population of unconditional defectors (e.g, adding 2% of MaRS agents, with identical parameters to those shown in Fig. 3, to a population of 1,000 unconditional defectors results in a complete extinction of the defectors after 40 generations). The operation of MaRS promotes cooperation, minimizes the extent of exploitation, and accounts for high fitness levels. Even if the algorithm is exposed, MaRS agents do not face additional risks; their opponents can fake neither passive or reactive similarity, nor can they escape the reciprocity of enacted mimicry. Having the capacity to learn and adapt to opponents’ strategies, MaRS can be thought of as being endowed with a “theory of mind” (30). It distinguishes among various types of opponents and games and may hence respond differently to identical moves conducted by different opponents. This adaptive response prevents other strategies from enforcing a claim for an unfair share of the payoffs (30). Nonetheless, being dependent on its memory to characterize an opponent’s similarity implies having greater vulnerability to errors. When an error has occurred, it is carried forward through memory and may influence several future moves of MaRS. If encountering other memory-dependent strategies, the errors are likely to have an impact also on their future conduct and add to the complexity of the developing interactions.
Although a comprehensive study of various error types and their impacts on heterogeneous strategy populations is a worthwhile task, it is beyond the scope of the present manuscript. Instead, we make three comments in respect of genuine populations:
First, MaRS as materialized in the present study begins each repeated interaction with empty memory registries and a slight cooperative bias; however, biological and social environments may comprise biased individuals with strong predispositions in regard to an opponent’s similarity. Experiments testing human participants have already shown how individuals who undergo manipulations of perceived similarity respond in accordance with the SERS theory (10, 11). This mechanism highlights the negative impact of propaganda and prejudice, which alienate and distance opponents. It also calls for the development of simple intervention methods that promote cooperation among hostile populations by highlighting their similarity to each other.
Second, in the present simulation, we changed payoff structures of PD games without having to pay any cost. Clearly, this is not the case when trying to change the nature of economic, social or political conflicts. The logic of SERS underlying the function of MaRS explains the cooperative benefit of reduced similarity thresholds as well as the hostile potential of high similarity thresholds. This suggests that third parties who are willing to reduce conflict outbreaks, yet are not sufficiently powerful to completely change the nature of the encounter, should invest in reducing similarity thresholds. Based on the structure of the similarity threshold ps* (and the constraints of the PD game), we distinguish among two intervention types. The first, we term the robin hood approach because, like the legendary outlaw who robbed the rich and gave to the poor, this approach reduces the difference between the payoffs of the exploiter and the exploited. To this aim, one may reduce T, enlarge S, or, in accordance with Robin Hood’s legend, transfer payoffs from T to S. The second, which we term the educational approach, enlarges the difference between the payoffs obtained following mutual cooperation and the payoffs obtained following mutual defection. To this aim, one may enlarge R, reduce P, or transfer payoffs from P to R. Both approaches reduce the similarity threshold of the game, yet the educational approach is more efficient than the robin hood approach because it provides a more effective reduction for every extent of intervention (SI Appendix, Appendix 2 and Fig. S3, provide a formal proof).
Finally, we suggest the consideration of imitation and mimicry, such as those observed in chimpanzees (15) and young children (12–14), to provide the basic behavioral experiences needed for triggering the development of cooperative populations. Learning to mimic similar others, while also learning when to expect being mimicked by them, seems to provide a fundamental aspect of the evolution of cooperation.
Supplementary Material
Acknowledgments
We thank the University of Bonn, the Max Planck Institute for Research on Collective Goods, and the University of Haifa research authority for providing infrastructure and support; Andreas Glöckner and the anonymous reviewers for many insightful comments; and Anton Gerstein for technical support. This work was supported by the German–Israeli Foundation for Scientific Research and Development Grant 1084-7.4/2010 (to I.F., S.J.G, and R.S.); Caesarea Edmond Benjamin de Rothschild Foundation Institute for Interdisciplinary Applications of Computer Science (A.F.); National Philanthropic Trust (S.L.); John Templeton Foundation Foundational Questions in Evolutionary Biology Program (S.L.); and NSF Grant IIS-0705822 (to D.I.R).
Footnotes
The authors declare no conflict of interest.
This article contains supporting information online at www.pnas.org/lookup/suppl/doi:10.1073/pnas.1308221110/-/DCSupplemental.
References
- 1.Knack S, Keefer P. Does social capital have an economic payoff? A cross-country investigation. Q J Econ. 1997;112(4):1251–1288. [Google Scholar]
- 2.Dugatkin A. Cooperation Among Animals. Oxford: Oxford Univ Press; 1997. [Google Scholar]
- 3.Wickler W. Mimicry in Plants and Animals. London: World Univ Library; 1968. [Google Scholar]
- 4.Payne RB. Host-Parasite Evolution: General Principles and Avian Models. Oxford: Oxford Univ Press; 1997. [Google Scholar]
- 5.Byrne DE. The Attraction Paradigm. New York: Academic; 1971. [Google Scholar]
- 6.Lakin JL, Chartrand TL. Using nonconscious behavioral mimicry to create affiliation and rapport. Psychol Sci. 2003;14(4):334–339. doi: 10.1111/1467-9280.14481. [DOI] [PubMed] [Google Scholar]
- 7.Chartrand TL, Bargh JA. The chameleon effect: The perception-behavior link and social interaction. J Pers Soc Psychol. 1999;76(6):893–910. doi: 10.1037//0022-3514.76.6.893. [DOI] [PubMed] [Google Scholar]
- 8.Van Baaren RB, Holland RW, Steenaerts B, Van Knippenberg A. Mimicry for money: Behavioral consequences of imitation. J Exp Soc Psychol. 2003;39:393–398. [Google Scholar]
- 9.Cornelis I, Van Hiel A, De Cremer D. Birds of a feather: Leader-follower similarity and procedural fairness effects on cooperation. Eur J Work Organ Psychol. 2011;20(3):388–415. [Google Scholar]
- 10.Fischer I. Friend or foe: Subjective expected relative similarity as a determinant of cooperation. J Exp Psychol Gen. 2009;138(3):341–350. doi: 10.1037/a0016073. [DOI] [PubMed] [Google Scholar]
- 11.Fischer I. Similarity or reciprocity? On the determinants of cooperation in similarity-sensitive games. Psychol Inq. 2012;23:48–54. [Google Scholar]
- 12.Guillaume P. Imitation in Children. Chicago: Univ Chicago Press; 1926/1971. [Google Scholar]
- 13.Piaget J. Play, Dreams and Imitation. London: Routledge; 1951/1967. [Google Scholar]
- 14.Meltzoff AN, Moore MK. Imitation of facial and manual gestures by human neonates. Science. 1977;198(4312):75–78. doi: 10.1126/science.198.4312.75. [DOI] [PubMed] [Google Scholar]
- 15.Whiten A. Imitation of the sequential structure of actions by chimpanzees (Pan troglodytes) J Comp Psychol. 1998;112(3):270–281. doi: 10.1037/0735-7036.112.3.270. [DOI] [PubMed] [Google Scholar]
- 16.Duersch P, Oechssler J, Schipper B. Unbeatable imitation. Games Econ Behav. 2012;76:88–96. [Google Scholar]
- 17.Apesteguia J, Huck S, Oechssler J. Imitation - theory and experimental evidence. J Econ Theory. 2007;136:217–235. [Google Scholar]
- 18.Durrett R, Levin A. Can stable social groups be maintained by homophilous imitation alone? J Econ Behav Organ. 2005;57:267–286. [Google Scholar]
- 19.Axelrod R. The Evolution of Cooperation. New York: Basic; 1984. [Google Scholar]
- 20.Nowak M, Sigmund KA. A strategy of win-stay, lose-shift that outperforms tit-for-tat in the prisoner’s dilemma game. Nature. 1993;364(6432):56–58. doi: 10.1038/364056a0. [DOI] [PubMed] [Google Scholar]
- 21.Miller GA. The magical number seven plus or minus two: Some limits on our capacity for processing information. Psychol Rev. 1956;63(2):81–97. [PubMed] [Google Scholar]
- 22.Skinner BF. Selection by consequences. Science. 1981;213(4507):501–504. doi: 10.1126/science.7244649. [DOI] [PubMed] [Google Scholar]
- 23.Harley CB. Learning the evolutionarily stable strategy. J Theor Biol. 1981;89(4):611–633. doi: 10.1016/0022-5193(81)90032-1. [DOI] [PubMed] [Google Scholar]
- 24.Osborne MJ, Rubinstein A. Games with procedurally rational players. Am Econ Rev. 1998;88(4):834–847. [Google Scholar]
- 25.Chmura T, Goerg SJ, Selten R. Learning in experimental 2x2 games. Games Econ Behav. 2012;76(1):44–73. [Google Scholar]
- 26.Selten R, Abbink K, Cox C. Learning direction theory and the winner’s curse. Exp Econ. 2005;8:5–20. [Google Scholar]
- 27.Brown GW. Iterative solution of games by fictitious play. In: Koopmans TC, editor. Activity Analysis of Production and Allocation. New York: Wiley; 1951. pp. 347–376. [Google Scholar]
- 28.Berger U. Brown’s original fictitious play. J Econ Theory. 2007;135(1):572–578. [Google Scholar]
- 29.Nowak A, Sigmund K. Tit for tat in heterogeneous populations. Nature. 1992;355:250–253. [Google Scholar]
- 30.Press WH, Dyson FJ. Iterated prisoner’s dilemma contains strategies that dominate any evolutionary opponent. Proc Natl Acad Sci USA. 2012;109(26):10409–10413. doi: 10.1073/pnas.1206569109. [DOI] [PMC free article] [PubMed] [Google Scholar]
Associated Data
This section collects any data citations, data availability statements, or supplementary materials included in this article.