Abstract
The pH dependence of the reduction potential E° for a metalloprotein indicates that the protonation state of at least one residue near the redox site changes and may be important for its activity. The responsible residue is usually identified by site-specific mutagenesis, which may be time-consuming. Here, the titration of E° for Chromatium vinosum high-potential iron-sulfur protein is predicted in good agreement with experiment using density functional theory plus Poisson-Boltzmann calculations if only the sole histidine changes protonation. The implementation of this approach into CHARMMing, a user-friendly web-based portal, allows users to identify residues in other proteins causing similar pH dependence.
Keywords: pKa, titration, histidine protonation, computational
Knowing the protonation state of ionizable residues in the active sites of proteins and enzymes is important in understanding their mechanisms. For instance, the protonation states of histidines near the metal redox site of metalloproteins are often important in identifying proton-coupling in electron transfer reactions or transferrable protons in enzymatic mechanisms. Thus, the determination of pKas for residues within a protein has been a major goal for computational methods for many decades,1–6 although with varying success.7 However, often the real question is simply to identify the residue causing an observed pH dependence as opposed to the actual values of the pKa.
For metalloproteins, the reduction potential E° can serve as a microscopic probe of the residues that affect the metal redox site, which is often the functionally important site. Thus, the pH dependence of E°, which can be measured using electrochemical or spectroscopic methods, indicates that the protonation state of one or more residues is affecting the redox site. However, the residue is usually experimentally identified by site-specific mutagenesis and repetition of the titration, which can be time consuming especially without an existing expression system and may lead to other unpredicted changes in the protein. A fast, simple computational procedure to identify the residues that contribute to the pH dependence of E° for a metalloprotein is presented here as an alternative to, or at least a prelude before, mutagenesis studies.
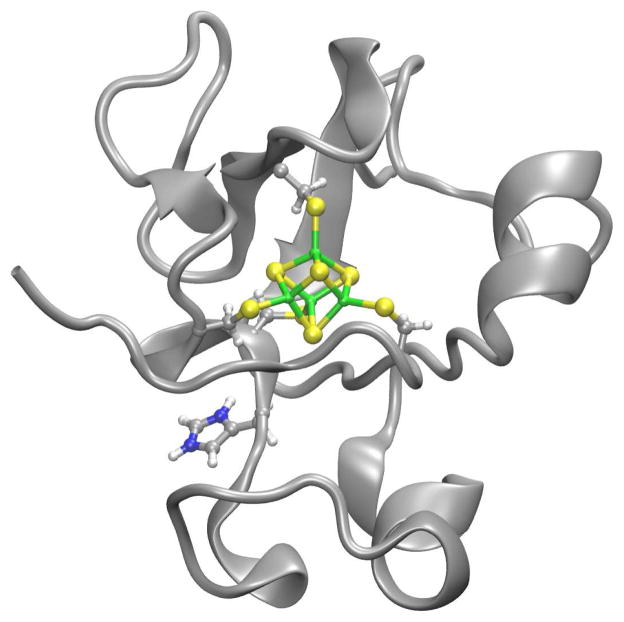
The pH dependence of E° for Chromatium vinosum high potential iron-sulfur protein (CvHiPIP) (Figure 1) is a useful test case. It contains a single histidine at residue 42 and exhibits a pH dependence of E° near pH 6 to 7.8 This histidine has been attributed as the cause since the pH dependence in wild-type (wt) disappears when it is mutated to a glutamine in the H42Q mutant.9 First, we show how well the computational methods used here reproduce the experimental results from CvHiPIP. Next, we demonstrate how the computational procedure using these methods would be used when the residue responsible for the pH dependence is not known, using CvHiPIP as an example.
Figure 1.
Ribbon drawing of Chromatium vinosum high-potential iron-sulfur protein, with the redox site and histi-dine in ball-and-stick.
The computational approach used here will be referred to as DFT+PB, where DFT refers to density functional theory calculations and PB refers to Poisson-Boltzmann continuum electrostatic calculations. The “+” indicates that the two calculations are performed independently, but are linked by using partial charges from the DFT calculations to represent the DFT region in the PB calculation. Recently, we have reported accurate calculations of E° vs. SHE using the DFT+PB approach for [4Fe-4S] proteins,10,11 showing that DFT partial charges give an accurate description of the redox site. In our work, the redox site contribution is from carefully benchmarked DFT calculations of redox site analogs in the gas phase12 and the protein contribution is from PB calculations of the protein in a continuum solvent using crystal structures of the proteins.10 This approach for calculating E° has been implemented into CHARMMing13, a web-based portal for biomolecule calculations. In this implementation, the redox site contribution comes from a library of our DFT results while the protein contribution is calculated using the program APBS14 for protein coordinates chosen by the user. Since only the PB calculations are performed, each E° calculation takes about 15 minutes on the server or a workstation. In addition, since dynamical effects are not included, further investigations by molecular dynamics simulations can be set up using other modules in the CHARMMing portal.
First, the pH dependence of E° for wt and H42Q CvHiPIP are examined to show how well the approach works by comparing to the experimental results. The PB calculations use crystal structures of wt [1CKU] at 1.20 Å resolution15 and H42Q [1B0Y] at 0.93 Å resolution15 from the Protein Data Bank.16 E° was calculated using the DFT+PB approach for three states of the protein: with all ionizable residues protonated, with all ionizable residues with pKa above 4 protonated, and with all ionizable residues with pKa above 8 protonated. pKa were assumed for the ionizable residues: pKa = 3.5 for all as-partates and glutamates, pKa = 6.3 for all histidines, and pKa > 8 for the rest. Then, the E° as a function of pH are estimated assuming that the Henderson-Hasselbach equation determines the relative populations of each type of protonation state (see supporting information).
The predicted results using DFT+PB at pH 7 for wt and H42Q are slightly too positive, by 29 and 34 mV, respectively (Table 1). These result are within the predicted range of error for DFT+PB since a deviation from experiment of about 30 mV was found for structures of this resolution when other proteins were examined.10,11 However, these results also show a systematic deviation for the entire titration curve since the same crystal structure is used for each calculation for the entire titration curve. Although experiment may also give rise to error, the experimental data shown here performed using cyclic voltammetry gave E° = 355 mV at pH 79 in good agreement with a previous study following the absorption spectra, which gave E° = 356 mV at pH 7.8 (More discussion of error is given in supplementary information.) Overall, the agreement indicates that PB electrostatics with DFT redox site partial charges gives a good estimate of the protein contribution, especially since the overall E° is the sum of large and opposing sign contributions, and factors such as dynamics of the protein or changes in the redox site do not appear to be present.
Table 1.
Calculated and Experimental9 E° (mV) for HiPIP
| Protein | E°cal | E°exp |
|---|---|---|
| wt at pH 7 | 384±30 | 355±2 |
| H42Q at pH 7 | 391±30 | 357±2 |
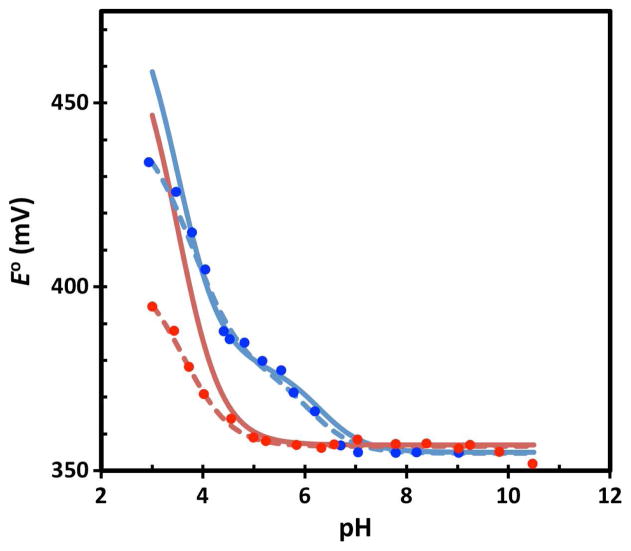
Since the errors are systematic for a given protein, the predicted titration curves for wt and H42Q can be shifted such that they match the respective experimental value at pH 7. These results agree well with the experimental titration data (Figure 2). In particular, the approximately 25 mV increase in E° for wt between pH 8 and 5.5 is in excellent agreement with experiment while no such increase is seen in E° for H42Q for either calculation or experiment. Moreover, these results also help to confirm that the histidine is responsible. Since the nearest atom of the histidine is 6.5 Å from the nearest atom of the [4Fe-4S] redox site, this indicates that PB electrostatics is able to predict even relatively small changes in E° due to residues that may not be close to the redox site.
Figure 2.
pH dependence of the predicted (solid line), experimental data9 (solid circles), and best-fit to experiment9 (dashed line) reduction potentials of wt HiPIP (blue) and its H42Q (red) mutant.
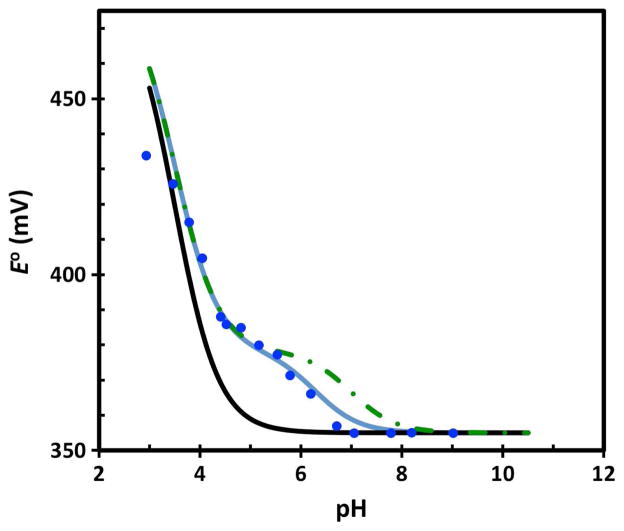
In CvHiPIP, the identity of the residue causing the pH dependence is straightforward since there is only one histidine and the site-specific mutagenesis data is consistent. However, generally the responsible residue is not known and site-specific mutants are not available. In addition, more than one residue may contribute, especially since E° is sensitive to protonation of even relatively distant residues. Thus, we demonstrate how our computational procedure may be used in such cases, again using CvHiPIP as an example. First, the DFT+PB calculated E° should be within 50 mV of the experimental E° as in Table 1 to assure that the approach is appropriate: otherwise, factors such as dynamics of the protein or changes in the redox site may be important. Then, one can focus on the relative E° as in Fig. 2. Good agreement between the calculated (blue solid line in Fig. 2 or 3) and experimental (blue solid circles in Fig. 2 or 3) E° indicates the pH dependence is being reproduced. Next, the residue responsible for the pH dependence can be identified by a procedure similar to experimental site-specific mutagenesis in which the calculation outlined above is repeated but instead of protonating all histidines at pH 6.3, all but one are protonated (i.e., the pKa of that histidine is changed to 3.5). If the curve calculated when the pKa of a specific histidine is shifted to 3.5 has little or no pH dependence near 6 to 7 (black line in Fig. 3), this histidine would be identified as contributing to the pH dependence.
Figure 3.
Predicted with the pKa of H42 equal to 6.3 (blue line), 4 (black line), and 7 (green dot-dashed) and experimental data9 (blue circles) for the reduction potential of wt HiPIP.
In addition, the pKa of the histidine in CvHiPIP should be close to 6.3 since the experimental titration curve (blue circles in Fig. 3) is reproduced well by the curve calculated assuming pKa = 6.3 for histidine (blue line in Fig. 3). However, a deviation of the predicated curve from experiment in the pH 6 to 7 range indicates that the histidine has a pKa shifted from 6.3. In that case, the histidine could be identified computationally and its pKa determined by adjusting the pKa for each histidine. For instance, when the pKa of a particular histidine is set to 7 (green dot-dashed line in Fig. 3), better agreement with experiment would indicate that the pKa of that histidine is 7, which is of course not the case here.
This procedure has been demonstrated for identifying histidine that cause pH changes, but can be used to study other ionizable residues. In addition, only histidines, aspartic acids, and glutamic acids were considered to be ionizable here, but the method can be extended to include other ionizable residues as well.
Supplementary Material
Acknowledgments
Funding Sources
Supported by National Institutes of Health Grant R01-GM045303 and the William G. McGowan Foundation.
We acknowledge computer resources from the Advanced Research Computing center at Georgetown University and the LoBoS cluster at the National Institutes of Health. We also thank Francesco Capozzi for permission to use his experimental data for CvHiPIP.
ABBREVIATIONS
- SHE
standard hydrogen electrode
Footnotes
Author Contributions
The manuscript contained contributions of both authors.
The authors declare no competing financial interests.
Supporting Information. Brief methods including the relationship between E° and the pKa’s and pH and discussion of error with references. This material is available free of charge via the Internet at http://pubs.acs.org.
References
- 1.Yang AS, Gunner MR, Sampogna R, Sharp K, Honig B. Proteins: Struct, Funct, Genet. 1993;15:252–265. doi: 10.1002/prot.340150304. [DOI] [PubMed] [Google Scholar]
- 2.Russell ST, Warshel A. J Mol Biol. 1985;185:389–404. doi: 10.1016/0022-2836(85)90411-5. [DOI] [PubMed] [Google Scholar]
- 3.Warshel A, Sussman F, King G. Biochemistry. 1986;25:8368–8372. doi: 10.1021/bi00374a006. [DOI] [PubMed] [Google Scholar]
- 4.Bashford D, Karplus M. Biochemistry. 1990;29:10219–10225. doi: 10.1021/bi00496a010. [DOI] [PubMed] [Google Scholar]
- 5.Beroza P, Fredkin DR, Okamura MY, Feher G. Proc Natl Acad Sci U S A. 1991;88:5804–5808. doi: 10.1073/pnas.88.13.5804. [DOI] [PMC free article] [PubMed] [Google Scholar]
- 6.Damjanovic A, Brooks BR, Garcia-Moreno E. J Phys Chem A. 2011;115:4042–4053. doi: 10.1021/jp110373f. [DOI] [PMC free article] [PubMed] [Google Scholar]
- 7.Lee AC, Crippen GM. J Chem Inf Model. 2009;49:2013–2033. doi: 10.1021/ci900209w. [DOI] [PubMed] [Google Scholar]
- 8.Mizrah IA, Meyer TE, Cusanovich MA. Biochemistry. 1980;19:4727. doi: 10.1021/bi00562a001. [DOI] [PubMed] [Google Scholar]
- 9.Babini E, Borsari M, Capozzi F. Inorg Chim Acta. 1998;275–276:230–233. [Google Scholar]
- 10.Perrin BS, Jr, Niu S, Ichiye T. J Comput Chem. 2013;34:576–582. doi: 10.1002/jcc.23169. [DOI] [PMC free article] [PubMed] [Google Scholar]
- 11.Perrin BS, Jr, Ichiye T. Proteins: Struct, Funct, Bioinf. 2010;78:2798–2808. doi: 10.1002/prot.22794. [DOI] [PMC free article] [PubMed] [Google Scholar]
- 12.Niu S, Ichiye T. Mol Simul. 2011;37:572–590. [Google Scholar]
- 13.Miller BT, Singh RP, Klauda JB, Hodoscek M, Brooks BR, Woodcock HL., III J Chem Inf Model. 2008;48:1920–1929. doi: 10.1021/ci800133b. [DOI] [PMC free article] [PubMed] [Google Scholar]
- 14.Baker NA, Sept D, Simpson J, Holst MJ, McCammon JA. Proc Natl Acad Sci. 2001;98:10037–10041. doi: 10.1073/pnas.181342398. [DOI] [PMC free article] [PubMed] [Google Scholar]
- 15.Parisini E, Capozzi F, Lubini P, Lamzin V, Luchinat C, Sheldrick G. Acta Crystallographica, Section D. 1999;55:1773–1784. doi: 10.1107/s0907444999009129. [DOI] [PubMed] [Google Scholar]
- 16.Berman HM, Westbrook J, Feng Z, Gilliland G, Bhat TN, Weissig H, Shindyalov IN, Bourne PE. Nucleic Acids Res. 2000;28:235–242. doi: 10.1093/nar/28.1.235. [DOI] [PMC free article] [PubMed] [Google Scholar]
Associated Data
This section collects any data citations, data availability statements, or supplementary materials included in this article.


