Abstract
Carbon-13 NMR spectroscopy in combination with 13C-labeled substrate infusion is a powerful technique to measure a large number of metabolic fluxes non-invasively in vivo. It has been used to quantify glycogen synthesis rates, establish quantitative relationships between energy metabolism and neurotransmission and evaluate the importance of different substrates. All measurements can, in principle, be performed through direct 13C NMR detection or via indirect 1H-[13C] NMR detection of the protons attached to 13C nuclei. The choice for detection scheme and pulse sequence depends on the magnetic field strength, whereas substrate selection depends on the metabolic pathways that are studied. 13C NMR spectroscopy remains a challenging technique that requires several non-standard hardware modifications, infusion of 13C-labeled substrates and sophisticated processing and metabolic modeling. Here the various aspects of direct 13C and indirect 1H-[13C] NMR are reviewed with the aim of providing a practical guide.
Keywords: NMR spectroscopy, direct 13C detection, indirect 1H-[13C] detection, broadband decoupling, RF power deposition, metabolism, metabolic modeling
INTRODUCTION
Knowledge about the relation between neuronal activity and cerebral energy metabolism is essential for the understanding of brain function. It is well known that under normal conditions the oxidation of glucose is the primary mechanism for cerebral energy production (1). Autoradiography (2, 3) and positron emission tomography (4, 5) (PET) have been used to assess regional glucose uptake in animal and human brain, respectively, by measuring the distribution of radioactivity following infusion of radioactive glucose analogues, 2-deoxy-D-glucose (DG) and 2-fluoro-2-deoxy-D-glucose (FDG). The information provided by glucose analogs is limited as they may not accurately reflect glucose metabolism and cannot provide flux information through metabolic pathways, like glycolysis. Furthermore, methods that utilize radioactively labeled glucose cannot distinguish the non-specific radioactivity of glucose and glucose metabolites. Nuclear magnetic resonance (NMR) spectroscopy overcomes these limitations by detecting specific chemical groups of metabolites through the chemical shift. Infusion of stabile 13C-labeled substrates, like [1-13C]-glucose, then allows detection of the appearance of 13C signal in all metabolites (of sufficient concentration) of glucose metabolism.
Previous in vivo 13C NMR spectroscopy in combination with intravenous [1-13C]-glucose infusion has shown abundant labeling of [4-13C]-glutamate and [4-13C]-glutamine, both in animal (6–10) and human (11–14) brain. These experiments, in combination with previous knowledge on compartmentalized glutamate metabolism (15, 16) allowed the development of quantitative, mathematical models of glucose metabolism. These studies have made important contributions to linking neuronal energy production to glutamatergic neurotransmission and establishing the importance of a glutamate–glutamine neurotransmitter cycle between neurons and astroglia.
In general the detection of 13C-label turnover involves a number of practical considerations and decisions that determine the exact information content and sensitivity of the experiment. These considerations include (1) the choice of 13C-labeled substrate, (2) the use of direct 13C-[1H] or indirect 1H-[13C] NMR detection and (3) the exact details of the metabolic model. The nomenclature for the various NMR methods is that the spins of the non-bracketed nucleus, e.g. 1H, give rise to the observed NMR signal, whereas the spins of the bracketed nucleus, e.g. 13C in 1H-[13C], require one or more RF pulses to successfully complete the NMR method. Examples include 1H RF pulses used in concert with 13C RF pulses in 13C-[1H] polarization transfer methods or 13C RF pulses during broadband decoupling in 1H-[13C] methods. Additional considerations are the infusion protocol, RF power deposition, availability of a 13C channel and spectral fitting. This review will discuss the practical aspects of performing 13C NMR experiments in vivo. While the general nature of dynamic 13C NMR allows applications to a wide range of tissues, this review will focus on applications to study cerebral energy metabolism and neurotransmission.
METHODS
General system setup
In order to perform dynamic 13C NMR spectroscopy the MR system must be equipped with several non-standard features like (1) a 13C-[1H] or 1H-[13C] RF coil, (2) 1H and 13C filters and (3) a console capable of handling two frequencies. While there are exceptions to the minimal requirements, as discussed in the section on alternative detection methods, these features are most commonly used for successful 13C NMR spectroscopy.
Perhaps the largest difference between conventional 1H NMR spectroscopy and dynamic 13C NMR spectroscopy is the need for a RF coil that can simultaneously operate at both the 13C as well as the 1H NMR frequency. For direct 13C-[1H] NMR acquisitions, operation at the 1H NMR frequency is necessary for coherence transfer, broadband decoupling, spatial localization, shimming and MR imaging. For indirect 1H-[13C] NMR acquisitions, operation at the 13C NMR frequency is required for coherence transfer and broadband decoupling. Fig. 1 shows the most commonly used design for a 13C-[1H] RF coil as originally described by Adriany and Gruetter (17). The 13C NMR coil is a simple, circular surface coil (14 and 80 mm diameter for rodent and human studies, respectively) that can be placed adjacent to the area of interest for optimal sensitivity. The 1H NMR coil consists of two larger surface coils (21 and 130 mm diameter for rodent and human studies, respectively) placed at an approximate 90° angle relative to each other and driven in quadrature for optimal B2 efficiency. The sensitive volume of the 1H RF coil is always larger than that of the 13C RF coil, such that all spatial positions detected during a 13C-[1H] NMR acquisition can be properly decoupled. For 1H-[13C] NMR studies the two coils are simply reversed. The popularity of the design depicted in Fig. 1 can, besides the extended spatial coverage, also be explained by the reduced amount of coil interaction, high B1 and B2 efficiency and the absence of local hot spots in the B2 field. See (17–19) for additional review and discussion of the RF coil setup.
Figure 1.
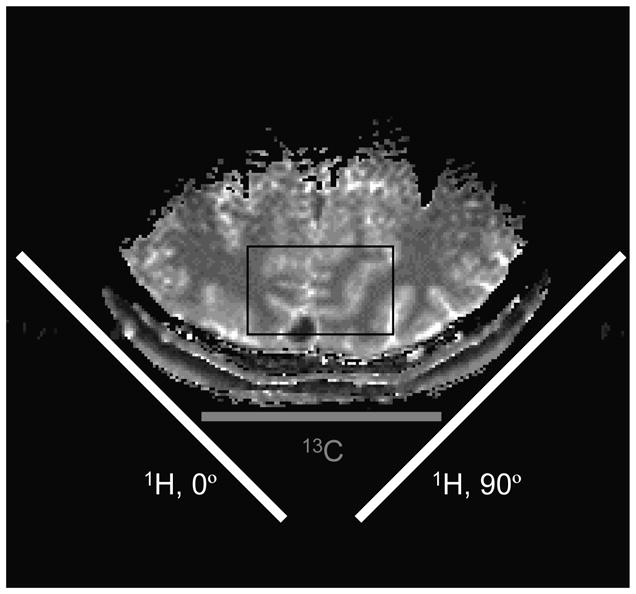
RF coil setup for direct 13C-[1H] NMR on human brain. The 13C RF coil is a single loop surface coil. The two circular 1H RF coils are positioned at a 90° angle and driven in quadrature for improved B2 efficiency. The indicated box is a typical volume size for direct 13C NMR detection.
Despite the reduced interaction of the two coils as a result of the geometric configuration, the interference between the two coils and the connected RF cables is typically strong enough to cause a significant increase in noise level when broadband decoupling is attempted. Even though the 1H and 13C NMR frequencies are well separated, the decoupling channel can carry spurious signals at the observe frequency. As decoupling is always performed during signal acquisition, even small imperfections lead directly to a degradation of the observed signal.
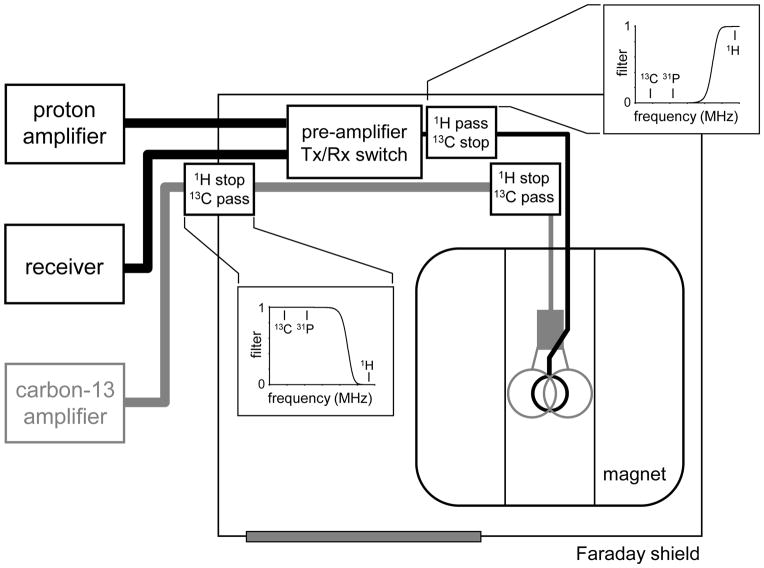
For almost all heteronuclear experiments involving broadband decoupling it is therefore crucial to apply filters on the decoupling channel to filter out the frequencies that lead to noise in the observe channel. A typical setup for 1H-[13C] NMR is shown in Fig. 2. At least one, but often two filters are required on the decoupling 13C channel to remove spurious signal at the 1H frequency. Even though band-pass filters can be used, low-pass filters typically have a better performance in terms of reduced signal loss at the desired frequency. This so-called insertion loss is less than 0.5 dB for good filters. A good low-pass filter achieves at least 60 dB attenuation at the 1H NMR frequency. While somewhat counter-intuitive, a high-pass filter on the observe channel prior to the pre-amplifier often greatly decreases the noise injection during 13C decoupling. This is likely due to non-linear elements in the pre-amplifier-T/R-switch that can multiply spurious signals at the 13C NMR frequency to the observed 1H NMR frequency. For 13C-[1H] NMR the filters should, of course, be reversed with high-pass filters on the decoupling 1H channel and a low-pass filter on the 13C channel. While the exact filter combination and placement is often site-specific, the combination of filters should lead to negligible degradation of the signal-to-noise ratio during decoupling.
Figure 2.
Filter, amplifier and RF coil setup for indirect 1H-[13C] NMR. A 1H stop/13C pass filter is typically placed in the 13C transmit channel at the position of the filter plate (i.e. the Faraday shield). An identical filter is often placed closer to the RF coil for improved performance. For 1H-[13C] NMR a 1H pass/13C stop filter is typically required prior to the preamplifier to prevent 13C-to-1H noise amplification. Exact filter placement is system-specific and must be determined empirically.
In addition to the location and the insertion loss, another important specification of RF filters is the limit on maximum peak and average power. For typical NMR sequences the filter must be able to handle both high peak power RF pulses (several kW for 1–5 ms) and high average power (several 100 W during 100–300 ms) during decoupling. As one of the most common problems with heteronuclear NMR is breakdown of RF filters under high power conditions, it is advised that high-quality RF filters capable of handling a sufficiently large RF power range are used.
Substrates
One of the most important considerations in dynamic heteronuclear in vivo NMR is the choice of substrate as this largely determines the information content that the experiment can provide. The exact 13C label position within the substrate is equally important.
Given that glucose is the primary substrate for cerebral energy metabolism under normal conditions, it is not surprising that glucose has been the most commonly used substrate in dynamic 13C NMR studies. However, in more recent years it is recognized that glucose does not provide information on all metabolic pathways in the brain. In addition, under a variety of conditions the brain also utilizes other substrates, such as β-hydroxybutyrate (BHB) and lactate.
[1-13C]-glucose and [1,6-13C2]-glucose
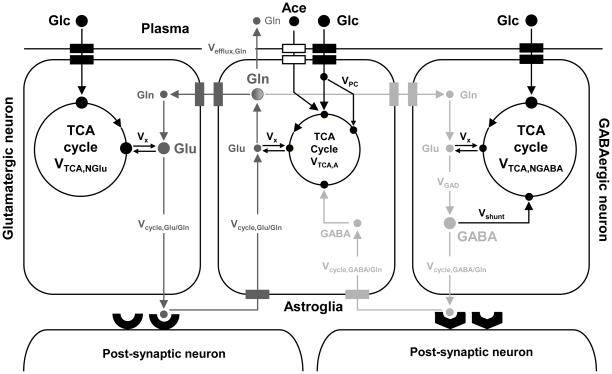
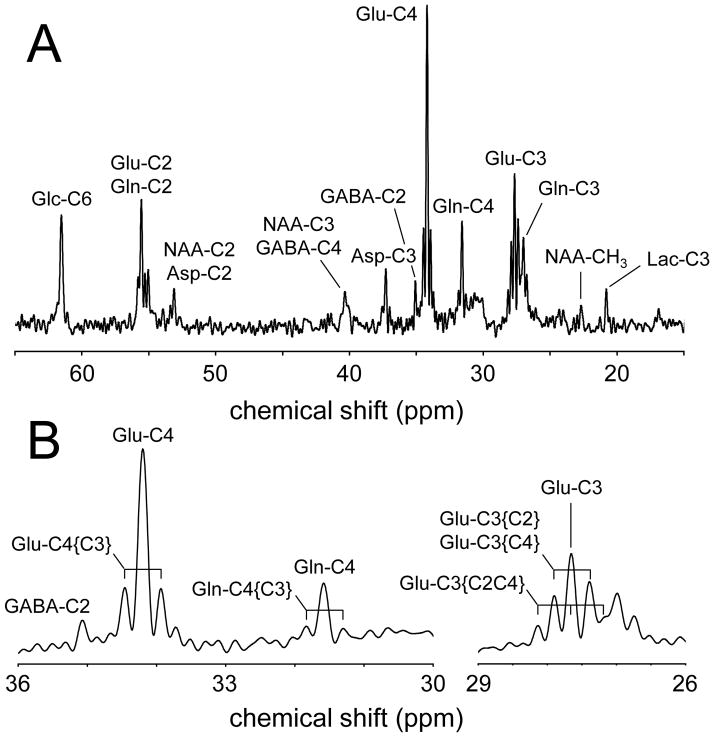
The majority of 13C NMR studies in vivo have used [1-13C]-glucose as the substrate. Besides the economic consideration that [1-13C]-glucose is the least expensive 13C-labeled form of glucose, the choice for [1-13C]-glucose is governed by the fact that the transfer of 13C label to [4-13C]-glutamate is indicative of the most active energy-producing metabolic pathways, namely glycolysis and the neuronal TCA cycle (see Fig. 3). While the labeling pattern of metabolites from [1,6-13C2]-glucose is nearly identical to that from [1-13C]-glucose, the fractional enrichment of pyruvate and hence of all subsequent metabolic pools will be twice as high, leading to an improved detection sensitivity. [1,6-13C2]-glucose is more expensive than [1-13C]-glucose, but this is only a minor consideration when considering the small amounts of material used to study cerebral metabolism in rat brain. For human experiments, [U-13C6]-glucose is a less expensive alternative when performing 1H-[13C]-NMR. For direct 13C NMR detection [U-13C6]-glucose is not recommended as the NMR spectrum will be complicated by the multiple homonuclear 13C-13C scalar couplings, giving rise to isotopomer resonances. Label transfer from [1,6-13C2]-glucose to [4-13C]-glutamate is detectable within minutes following the start of glucose infusion. Provided that the exchange between the mitochondrial 2-oxoglutarate and cytosolic glutamate pools is rapid, the label transfer is indicative of the TCA cycle rate. Note that through simultaneous quantification of [3-13C]-glutamate the TCA cycle rate can be determined even if the mitochondrial/cytosolic exchange rate is slow (13, 20). With a small time lag, label is subsequently transferred from [4-13C]-glutamate to [4-13C]-glutamine. Based on the location of specific enzymes as well as the size of the neuronal glutamate and astroglial glutamine pools, this has been interpreted as reflecting a glutamate–glutamine neurotransmitter cycle, and has subsequently been confirmed in many studies (6–10, 13, 14). Figure 4 shows a typical 13C NMR spectrum acquired from rat brain during the infusion of [1,6-13C2]-glucose. Following 90 minutes of glucose infusion, a wide range of metabolites is labeled, including [n-13C]-glutamate and glutamine (n = 2, 3 or 4), [2-13C]-aspartate, [3-13C]-aspartate, [1,6-13C2]-glucose and [n-13C]-GABA (n = 2, 3 or 4). Besides the singlet 13C NMR resonances, the NMR spectrum also contains several doublet and triplet resonances. These so-called isotopomer resonances are due to homonuclear 13C-13C scalar coupling in molecules where two 13C nuclei are immediately adjacent to each other, like in [3,4-13C2]-glutamate. This situation occurs when [4-13C]-glutamate labeled in the first TCA cycle is labeled again at the C3 position in the second TCA cycle. The chance that this occurs increases with the duration of the infusion. The infusion for regular 13C turnover studies is between 90 and 150 minutes, leading to several isotopomers, in particular [2,3-13C2], [3,4-13C2] and [2,3,4-13C3]-glutamate and glutamine (Fig. 4). However, for much longer infusion times, as required to detect 13C-glycogen turnover (21–23), the 13C NMR spectrum is dominated by isotopomer resonances (24). Analysis of the exact isotopomer patterns can provide complementary information that obtained from dynamic 13C turnover.
Figure 3.
Four-compartment metabolic model compromising the blood, glutamatergic neurons, GABAergic neurons and astroglia. Glucose enters the brain with the aid of glucose transporter in the blood-brain barrier. In the glycolytic pathway, glucose is broken down into two pyruvate molecules which enter the tricarboxylic acid (TCA) cycle. Acetate only enters the astroglial compartment and enters the TCA cycle via acetyl-CoA. One of the TCA cycle intermediates, 2-oxoglutarate, is in rapid exchange with a large glutamate pool that can be observed with NMR. The TCA cycle flux can be obtained from the glutamate turnover and is denoted VTCA. Due to compartmental localization of specific enzymes, the fate of glutamate differs in each of the three cellular compartments. In glutamatergic neurons, glutamate acts as an excitatory neurotransmitter and is released into the synaptic cleft in response to an action potential. Following interaction with post-synaptic receptors, the glutamate is taken up by the astroglia and converted to glutamine. Glutamine is ultimately transported back to the glutamatergic neuron, where it is converted back to glutamate, thereby completing the so-called glutamate-glutamine neurotransmitter cycle. The flux through this cycle, Vcycle, Glu/Gln, can be obtained by following the glutamine turnover. In the GABAergic neuron, the glutamate is first converted to GABA which is the primary inhibitory neurotransmitter. Similar to the glutamatergic neuron, a GABA-glutamine neurotransmitter exists between GABAergic neurons and astroglia. A metabolic pathway specific to astroglia is the carboxylation of pyruvate catalyzed by the astroglia-specific enzyme pyruvate carboxylase. Note that the letter size roughly corresponds to the metabolic pool size of the corresponding metabolite (e.g. a large glutamine pool resides in astroglia). Metabolite abbreviations are given for: Ace, acetate; GABA, γ-aminobutyric acid; Glc, glucose; Gln, glutamine; Glu, glutamate
Figure 4.
(A) 1H-decoupled, 13C NMR spectrum of rat brain in vivo obtained with polarization transfer between 120 and 150 min following the onset of intravenous infusion of [1,6-13C2]-glucose. Besides the singlet resonances, the 13C NMR spectrum is (B) characterized by doublet and triplet resonances arising from isotopomers. In particular glutamate and glutamine exhibit several isotopomers of which the C3-C4 combination is most abundant.
[2-13C]-glucose
In order to determine the rate of the glutamate–glutamine cycle from the glutamine synthesis rate, one must distinguish glutamine labeling via the glutamate–glutamine cycle from other metabolic pathways that may contribute to the flow through glutamine synthetase. The glutamate–glutamine cycle and anaplerosis are the only two pathways that provide carbon skeletons for glutamine synthesis. Glutamine efflux is the primary pathway of nitrogen removal from the brain. Since the glutamine concentration is constant, any loss of glutamine by efflux to the blood must be compensated by synthesis de novo of glutamine through anaplerosis. For synthesis of glutamine de novo by anaplerosis pyruvate derived from glucose is converted to oxaloacetate by carbon dioxide fixation (see Fig. 3), a reaction catalyzed by the astroglial enzyme pyruvate carboxylase. Through the action of the TCA cycle, oxaloacetate is converted to 2-oxoglutarate, which is converted to glutamate. Astroglial glutamate is then converted to glutamine by glutamine synthetase. A limitation of using [1-13C]-glucose as a labeled precursor to measure the glutamate–glutamine cycle flux is that 13C label entering glutamine by this pathway cannot be easily distinguished from 13C label that enters glutamine from the anaplerotic pathway or the astroglial TCA cycle. [1-13C]-glucose labels [4-13C]-glutamate through the action of pyruvate dehydrogenase and labels [2-13C]-glutamate through pyruvate carboxylase. However, the carbon label of [4-13C]-glutamate is quickly transferred to [2-13C]-glutamate in subsequent turns of the overwhelming neuronal TCA cycle, thereby obscuring [2-13C]-glutamate labeling by astroglial anaplerosis. Using [2-13C]-glucose as a label precursor offers a highly sensitive alternative to measuring the fluxes though anaplerosis and the astroglial TCA cycle. [2-13C]-glucose labels astroglial [3-13C]-glutamate/glutamine through pyruvate carboxylase and labels [5-13C]-glutamate/glutamine through the action of pyruvate dehydrogenase. However, the C5 position of the TCA cycle intermediates is ultimately lost as carbon dioxide in subsequent turns of the TCA cycle. Therefore, the accumulation of (astroglial) [3-13C]-glutamine is a direct indication of anaplerotic activity, without contamination by neuronal TCA cycle metabolism. Under most conditions the anaplerotic pathway constitutes only a small fraction of the TCA cycle flux.
[2-13C]-acetate
Since glucose is transported and metabolized in both neurons and astroglia and extensive mixing of the label occurs through the glutamate–glutamine cycle, the TCA cycle fluxes in the neuronal and astroglial compartments are convolved. The formation of [4-13C]-glutamate will be heavily weighted by the neuronal TCA cycle, making the glucose experiment relatively insensitive to the smaller astroglial TCA cycle flux. Neuronal and astroglial metabolism can be more directly distinguished by using acetate as a substrate. It has been shown that acetate is almost exclusively metabolized in astroglia due to a far greater transport capacity (25). Therefore, [2-13C]-acetate will be selectively transported into the astroglial compartment and converted to [2-13C]-acetylCoA, which labels the astroglial TCA cycle intermediates. Next, the small (0.5–1.0 mM) astroglial glutamate pool is labeled after which the 13C label arrives at the large glutamine pool. The large neuronal glutamate pool is subsequently labeled from astroglial [4-13C]-glutamine that is transported to the neuronal compartment as part of the glutamate–glutamine neurotransmitter cycle. [2-13C]-acetate experiments on human and animal brain have confirmed earlier observations made through the use of [1-13C]-glucose and have determined that the astroglial TCA cycle is only a small fraction of the neuronal TCA cycle.
Other substrates
In addition to glucose and acetate there have been a number of reports that have used alternative substrates, such as β-hydroxybutyrate and lactate. It is well-known that under conditions of prolonged fasting, strenuous exercise or ketogenic diets β-hydroxybutyrate can readily be utilized by the brain. Using [2,4-13C2]-β-hydroxybutyrate, Pan et al (26) demonstrated significant 13C label accumulation in [4-13C]-glutamate and glutamine with a pattern closely resembling glucose metabolism. In addition to alternative substrates, it is sometimes also advantageous to use combinations of substrates. Using a co-infusion of [1,6-13C2]-glucose and [1,2-13C2]-acetate, Deelchand et al (27) were able to simultaneously measure neuronal and astroglial metabolism in rat brain through the specific 13C-13C isotopomer resonances.
Infusion protocol
While the description of the infusion protocol will be focused on rodent experiments, the setup is similar for human studies. Noticeable differences will be mentioned wherever applicable. Following the commonly employed preparations (general anesthesia and tracheotomy or intubation) two small lines are placed in the femoral artery and vein or tail vein for periodic sampling of arterial blood and intravenous infusion of substrates, respectively. In human studies, the two lines are typically placed in the antecubital vein of each arm, one of which is often wrapped in a warm water blanket to aid in blood drawing.
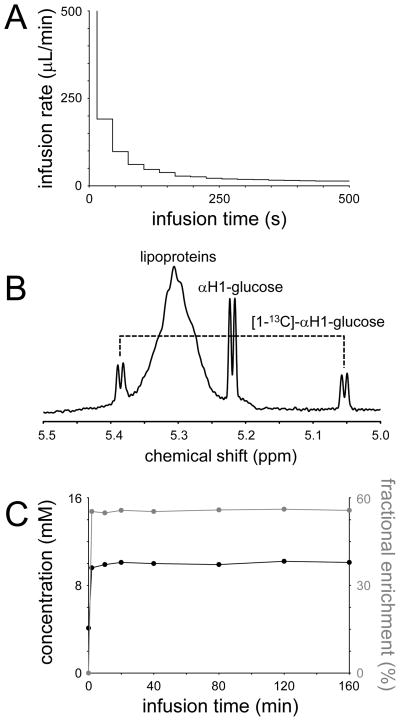
The infusion protocol is typically designed to quickly reach a high and stabile isotopic enrichment of the substrate. Fig. 5A shows a practical glucose infusion protocol for an adult rat that is designed to increase the intravenous glucose concentration from euglycemic levels (circa 4 mM following an overnight fast) to hyperglycemic levels (10 – 12 mM), while reaching a 50–70% fractional enrichment of the glucose within 1 minute. However, exact knowledge of the time course of substrate concentration and isotopic enrichment is critical for a quantitative evaluation of 13C labeling time courses. Without exact knowledge of the input function, the rate of 13C-label appearance in metabolites like glutamate and glutamine cannot be interpreted since the entry rate of labeled 13C substrate is a prerequisite in the metabolic modeling. The substrate concentration and isotopic enrichment time courses can be obtained through periodic sampling of arterial blood followed by quantitative analysis with a combination of methods, like glucosometer analysis, gas chromatography mass spectrometry (GC-MS) and high-resolution NMR spectroscopy. Fig. 5B shows a typical 1H NMR spectrum from a rat blood plasma samples following 90 min of [1-13C]-glucose infusion. The lack of spectral overlap of the αH1-glucose resonance at 5.22 ppm readily allows the calculation of the 13C fractional enrichment as well as the absolute concentration. Fig. 5C shows a summary of typical blood glucose concentration and fractional enrichment time courses. It should be noted that in high-field 1H-[13C] NMR studies (10) the αH1-glucose resonance can be detected directly in vivo, thus eliminating the need for blood plasma analysis.
Figure 5.
(A) Infusion protocol for intravenous administration of a 0.75 M glucose solution in order to raise the blood glucose level to circa 10 mM in an adult rat. (B) In vitro 1H NMR spectrum of unfiltered blood plasma obtained 90 min after the onset of [1,6-13C2]-glucose infusion. The αH1-glucose resonance at 5.22 ppm is readily observable, together with the two satellites for [1-13C]-αH1-glucose. The 13C fractional enrichment for this sample was determined at 43%. (C) Measured blood glucose concentration (black line) and 13C fractional enrichment (gray line) in an adult rat (200 gram) during the infusion protocol shown in (A).
In response to the elevated glucose levels, endogenous insulin is secreted from the pancreas in order to stimulate glucose uptake in the liver. In order to suppress this effect and reduce the experimental costs of the expensive 13C-labeled glucose, the glucose infusion in human studies is frequently combined with an intravenous infusion of somatostatin, a hormone that inhibits insulin release. In order to maintain basal insulin levels, insulin can be co-infused. Experimental costs can be further reduced by switching to 50–70% 13C-enriched substrate once the initial substrate bolus has been given. Human 13C turnover studies can be greatly simplified by oral administration of the substrate (28). While this gives comparable metabolic rates as the studies using administration through intravenous infusion, the uncertainties on the metabolic rates are increased.
Direct 13C NMR methods
The next consideration for successful dynamic 13C NMR is the choice of a NMR pulse sequence, which is largely determined by whether the 13C NMR signals will be detected directly or indirectly through the attached protons. The choice is often determined by balancing the increased sensitivity of 1H NMR detection against the increased spectral resolution of 13C NMR detection. Additional considerations are that 1H NMR also allows the detection of protons attached to 12C (i.e. the total metabolic pools), whereas 13C NMR allows the detection of 13C-13C isotopomers.
Methods for the direct detection of 13C NMR signals generally fall into one of two categories, namely (1) polarization transfer (14, 29–33) or (2) direct excitation (22, 34–36), possibly in combination with nuclear Overhauser enhancement (37, 38). Polarization transfer methods are typically used to detect NMR signal from 13C nuclei that are directly attached to one or more protons, such as the C2, C3 and C4 positions in GABA, glutamate and glutamine. Direct excitation methods are typically chosen for glycogen or for 13C nuclei without directly attached protons, such as the C1 and C5 positions in GABA, glutamate and glutamine.
Direct 13C excitation
The main advantage of direct 13C excitation over polarization transfer is that signal acquisition starts immediately following excitation, thus allowing the detection of compounds with short T2 relaxation times, like glycogen (21–23, 39). In addition, since polarization transfer requires an echo-time in the order of 1/JCH, compounds with very small heteronuclear scalar couplings, like the C1 and C5 positions in GABA, glutamate and glutamine (2JCH = 3.5 – 5.2 Hz), would require very long TE and, therefore, can realistically only be detected through direct excitation.
The main challenges of 13C NMR through direct excitation are limited sensitivity and spatial localization. The low gyromagnetic ratio of 13C NMR equates with a low NMR sensitivity. The primary method to enhance the 13C NMR sensitivity is, besides polarization transfer, through the use of the nuclear Overhauser enhancement. Irradiation of protons that have dipolar coupling with the 13C nuclei of interest will lead to a redistribution of the 13C spin populations and an enhancement of the 13C signal by a factor 1 + (γH/2γC) = 2.988. However, if dipolar relaxation only accounts for a fraction of all relaxation mechanism, the nucleur Overhauser enhancement is proportionally reduced. For in vivo applications, typically enhancements for 13C NMR are 1.3 – 2.9. The enhancement must be empirically determined and it should be considered whether the additional sensitivity sufficiently offsets the need for additional measurements.
Spatial localization for 13C NMR through direct excitation is a challenge because of the large chemical shift dispersion of 13C NMR and the absence of spin- and stimulated-echo-based localization methods. For example, when a frequency selective RF pulse with bandwidth BW and offset ν relative to glutamate-C4 at 34.2 ppm is executed during a magnetic field gradient of amplitude G, a slice of thickness (BW/G) at position (ν/G) is selected. However, for α-glucose-C1 at 92.7 ppm, the frequency offset at 7 Tesla is (92.7 − 34.2) ×75 = 4,388 Hz (= Δν) higher. For α-glucose-C1 the same slice selection thus results in a position offset (ν + Δν)/G, which means that the NMR signal from different resonances originates from different spatial positions. This so-called chemical shift displacement effect increases with field strength. It can only be minimized by using the highest possible gradient strength. In order to maintain the same slice thickness the highest possible RF bandwidth has to be used. Since, for a given pulse length, the RF amplitude scales with the RF bandwidth, a second limiting factor in minimizing the chemical shift displacement artifact, besides limitations in gradient strength, is often the available RF peak power.
Spatial localization for direct 13C NMR is often based on outer volume suppression (OVS), possibly extended by ISIS (image-selected in vivo spectroscopy) localization. The chemical shift displacement is minimized by using high bandwidth adiabatic RF pulses.
Polarization transfer
The main advantage of polarization transfer over direct excitation methods is the consistent signal-to-noise increase and ease of spatial localization. Direct 13C NMR in combination with nuclear Overhauser enhancement requires an empirical determination of the exact enhancement factor. However, the signal enhancement during polarization transfer only depends on the echo-time relative to the known and constant scalar coupling constant and can thus be quantitatively calculated.
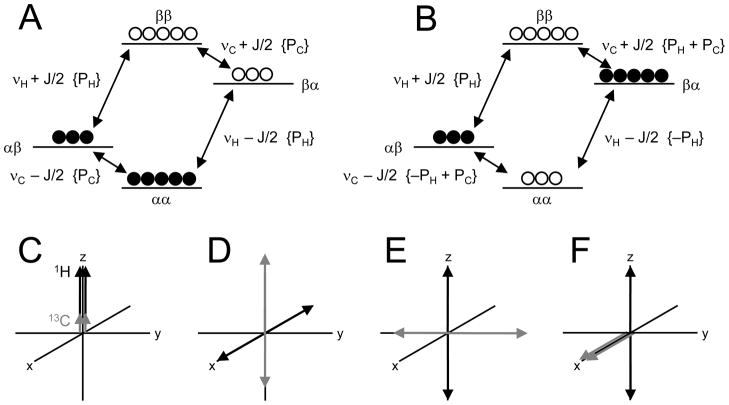
The polarization transfer experiment is readily described and understood with the product operator formalism (40). However, a thorough description of that formalism is outside the scope of this review. Fortunately, the product operator formalism for polarization transfer methods can be readily visualized through vector diagrams and considerations of relative spin populations. The principle of signal enhancement can be explained by considering the selective polarization inversion experiment (41) where a frequency-selective 180° spin inversion is applied to a single NMR transition (i.e. a single resonance line in a multiplet structure like a doublet). Consider a scalar-coupled heteronuclear two-spin system consisting of four energy levels and giving rising to two doublet signals (Fig. 6A). At Boltzmann equilibrium the spin populations of the levels are given by −0.5PH − 0.5PC for the highest energy level (level 1, ββ), −0.5PH + 0.5PC for level 2 (βα), 0.5PH − 0.5PC for level 3 (αβ) and 0.5PH + 0.5PC for the lowest energy level (level 4, αα), where PH and PC are the proton and carbon-13 spin populations. Two of the energy level differences give rise to proton resonances at frequencies νH ± 1JHC/2 with intensity PH, whereas the other two energy level differences give rise to carbon-13 resonances at frequencies νC ± 1JHC/2 with intensity PC. Selective inversion of the populations involved with one of the proton resonances, for example 2 – 4, will lead to a redistribution of the spin populations (Fig. 6B). While the frequencies of all transitions remain the same, the intensities of the carbon-13 transitions, which were not directly affected by the selective 180° inversion, are now −PH + PC and PH + PC, respectively. The changes in signal intensity are thus ±PH/PC which is proportional to ±γH/γC. In other words, selective inversion of a single 1H transition leads to a circa four-fold enhancement of the carbon-13 resonances. Unfortunately, the selective polarization inversion experiment is not generally applicable to achieve uniform signal enhancement over a range of different metabolites. Polarization transfer achieves the same final situation, i.e. selective inversion of a single proton transition, without the use of selective RF pulses. Fig. 7 shows a practical INEPT-based polarization transfer sequences for in vivo NMR applications. Figs. 6C-F show the vector diagrams for the evolution of the proton and carbon-13 magnetization. Following excitation, the proton magnetization starts to evolve under the effects of frequency offsets and scalar couplings. Since the 1H 180° pulse refocuses the effect of frequency offsets, i.e. magnetic field inhomogeneity and chemical shift evolution (Review 1, Comment 4), the magnetization is only affected by scalar coupling at the echo-time TE1. When TE1 = 1/(21JCH) the proton magnetization has evolved into a state of anti-phase coherence in which protons bound to carbon-13 in the α-state have accumulated a 180° phase difference relative to protons bound to carbon-13 in the β-state (Fig. 6D). A second 90° pulse will bring the anti-phase coherence to the longitudinal axis where the same situation has been created as during the selective polarization inversion experiment, i.e. one of the 1H NMR transitions has been selectively inverted (Fig. 6E). Therefore, at that point in time the 13C NMR signal is enhanced by a factor ±γH/γC, which can be revealed by a 13C excitation. Unfortunately, the carbon-13 magnetization appears in a state of anti-phase coherence. Application of broadband decoupling to this state will lead to a collapse of the doublet structure to a singlet of zero intensity. Applying another spin-echo delay TE2 = 1/(21JCH) will evolve the anti-phase signal into an in-phase doublet (Fig. 6F), after which broadband decoupling can be applied for additional signal enhancement and spectral simplification. The sequence shown in Fig. 7 is referred to as ‘refocused INEPT’. For CH2 and CH3 resonances, the echo-time TE2 should be 1/(41JCH) and ~1/(51JCH), respectively, for optimal signal refocusing.
Figure 6.
(A) Energy level diagram and thermal equilibrium populations for a heteronuclear scalar-coupled two-spin-system. Closed and open circles represent a relative abundance and shortage of nuclear spins. The spin populations at thermal equilibrium correspond to +½PH + ½PC (αα), +½PH − ½PC (αβ), − ½PH + ½PC (βα) and − ½PH − ½PC (ββ). The difference between spin populations for a given transition determines the spectral intensity, indicated in parentheses. (B) Following an inversion of proton transition (αα ↔ βα), the intensities of the carbon-13 transition redistribute to {PH + PC} and {−PH + PC} thereby leading to an enhancement of ±γH/γC. Vector diagrams of the 1H and 13C magnetizations at times (C) t = 0, before excitation, (D) t = TE1 = 1/(21JCH) before the second 90° pulse, (E) TE1 after the second 90° pulse and (F) t = TE1 + TE2 are shown. The situation in (F) is achieved after a two-step phase cycle of the second 1H 90° pulse to remove the contribution of directly excited 13C magnetization.
Figure 7.
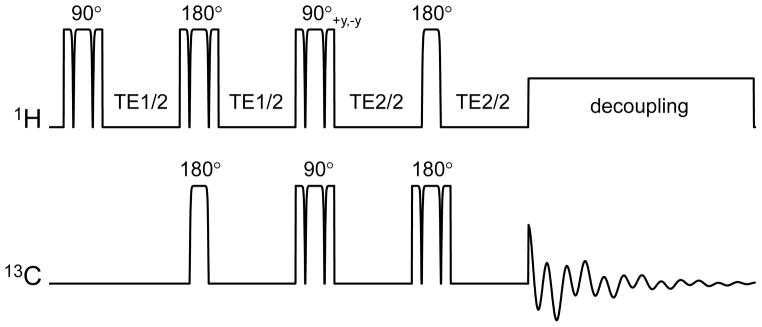
Polarization transfer sequence based on adiabatic AFP and BIR-4 pulses. The acquisition phase should be phase-cycled in concert with the second 1H 90° pulse in order to retain the transferred polarization and cancel the direct 13C magnetization. All RF pulses are executed with BIR-4 waveforms, except for the first 13C and last 1H RF pulses, which are executed as shorter AFP pulses, thereby reducing RF power deposition. WALTZ-16 is often used for broadband decoupling during acquisition.
Whereas the original polarization transfer methods were implemented with hard pulses, this would not be optimal for in vivo NMR applications. Almost all in vivo polarization transfer studies are performed with surface coils for maximum RF power efficiency and the highest receive sensitivity. However, the high RF inhomogeneity associated with surface coils leads to incorrect nutation angles and thus signal loss and artifacts. Executing the sequence with adiabatic RF pulses as shown in Fig. 7 will guarantee a constant nutation angle independent of the applied RF power, above a minimum required RF power level. An explanation of the exact choice for specific RF pulses is outside the scope of this review and interested readers are referred to the original literature (42–44) and reviews on adiabatic RF pulses (19, 45, 46). An additional consideration for in vivo 13C NMR spectroscopy is the need for spatial localization. In many cases the ISIS method is chosen in combination with outer volume suppression. Since the polarization transfer scheme begins on the 1H channel, spatial localization can also be performed on the 1H channel with a correspondingly smaller chemical shift artifact.
Indirect 1H-[13C] NMR methods
Indirect 13C NMR refers to methods that detect protons that are directly attached to 13C nuclei. The main advantage of this approach is that the larger gyromagnetic ratio of protons leads to a significantly higher sensitivity. In addition, 1H NMR detection allows the detection of both the total (12C + 13C) and the 13C fraction of a given metabolite, such that the direct calculation of in vivo 13C fractional enrichments is straightforward.
Indirect 1H-[13C] NMR methods can be broadly divided into single-shot multiple-quantum-coherences-based methods (MQC) (47–50) and J-difference-based methods (10, 51–53). The MQC-based methods selectively detect the 1H NMR signals attached to 13C nuclei by destroying (i.e. dephasing) all other 1H NMR signals in a single scan. However, the removal of all other 1H NMR signals prevents the calculation of 13C fractional enrichments and the monitoring of metabolites without 13C label incorporation. Because of these serious drawbacks only indirect 1H-[13C]-NMR methods based on J-difference editing will be discussed further.
J-difference editing
The principle of J-difference editing is based on different reactions of a scalar-coupled spin-system to non-selective (1H and 13C refocusing) and selective (only 1H refocusing) spin-echo methods. Evolution due to scalar couplings will commence normally during a non-selective spin-echo sequence leading to an inversion of heteronuclear coupled spins relative to uncoupled spins when the echo-time TE equals 1/1JCH (= 7.1 ms for 1JCH = 140 Hz). A non-selective spin-echo typically has 180° RF pulses on both 1H and 13C channels, such that all spins are equally affected. When the 180° RF pulse on the 13C channel is removed, the spin-echo becomes selective for 1H. In this case evolution due to scalar coupling is completely refocused, such that heteronuclear coupled spins are in-phase with uncoupled spins. When the two experiments (non-selective and selective) are performed and stored separately, the difference can be calculated which will display all 1H NMR resonances that are directly coupled to 13C nuclei. All 1H NMR resonances not coupled to 13C nuclei are removed during the subtraction.
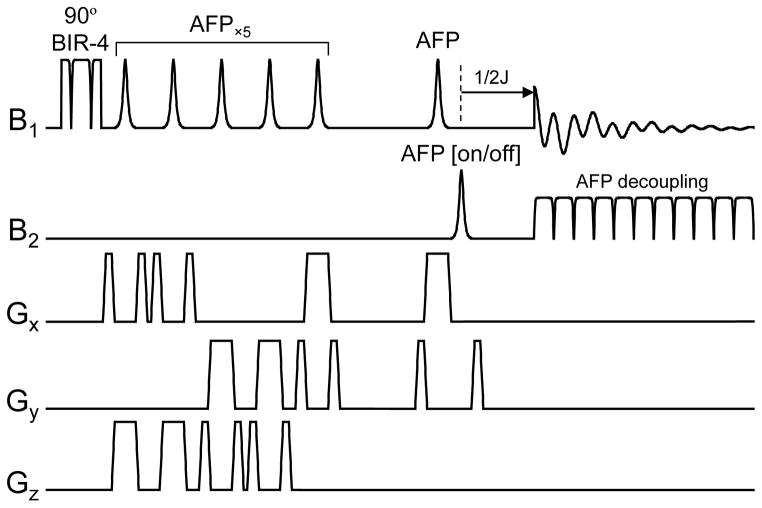
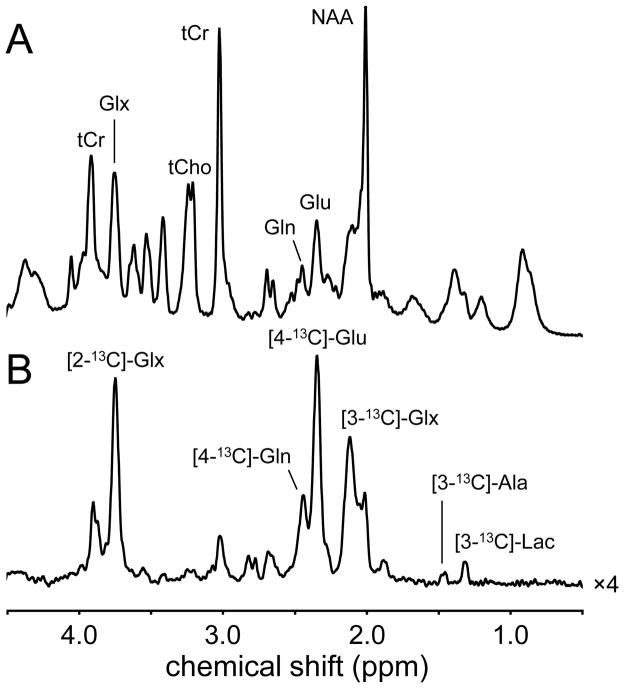
Indirect 1H-[13C]-NMR detection via J-difference editing of course has to deal with all the common challenges of in vivo 1H NMR such as spatial localization and water suppression. The NMR sequence shown in Fig. 8 is one of several possibilities to obtain high-quality 1H-[13C] NMR spectra in vivo. The sequence is based on the LASER localization scheme (54, 55), extended with a 13C inversion pulse that is present during half of the scans when the sequence generates a non-selective spin-echo. Because the first five 180° pulses are selective for 1H in all scans, all heteronuclear scalar coupling evolution is refocused. Therefore only the echo-time around the last 180° pulse is adjusted to TE = 1/1JCH ~7–8 ms. Fig. 9 shows an example of 1H-[13C] NMR spectra of the rat brain following the infusion of [1,6-13C2]-glucose. An additional feature of Fig. 8 is the presence of 13C RF pulses during 1H acquisition to achieve broadband decoupling which will be discussed next.
Figure 8.
Proton-observed, carbon-edited J-difference sequence based on 3D LASER localization with adiabatic full passage (AFP) RF pulses. In order to attain the adiabatic nature of the method, an adiabatic broadband decoupling sequence is used during acquisition.
Figure 9.
(A) 1H and (B) 1H-[13C] NMR spectra acquired from rat brain at 9.4 T in the presence of adiabatic broadband decoupling. The spectra are acquired circa 90 min following the start of [1,6-13C2]-glucose infusion. Similar to the direct 13C NMR spectrum of Fig. 4, the [4-13C]-glutamate resonance is the most intense, reflecting the cerebral TCA cycle activity.
Broadband decoupling
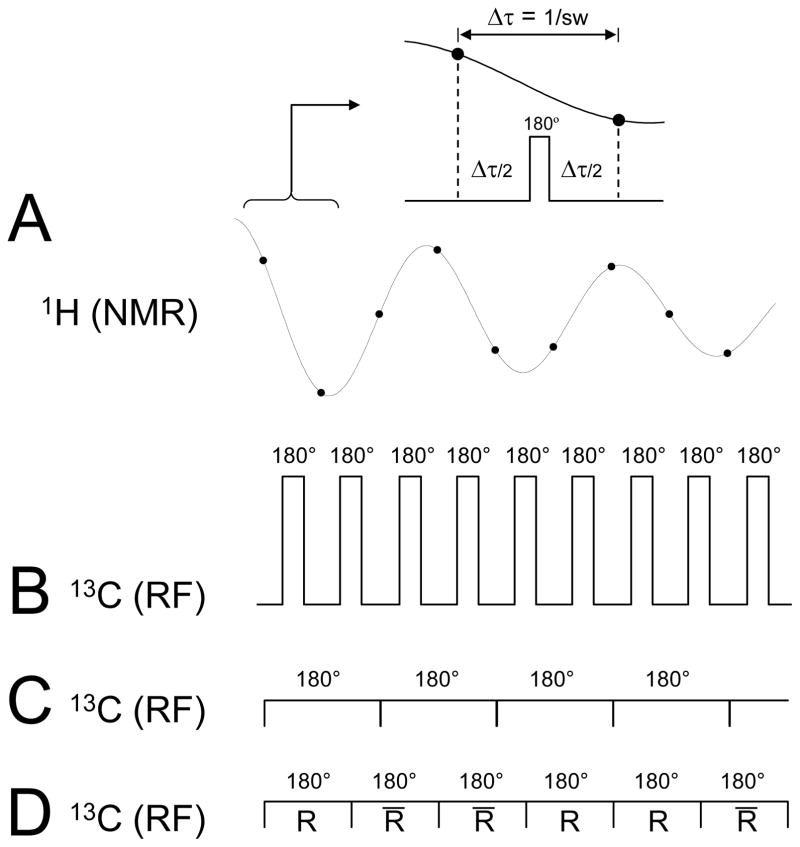
Decoupling aims at removing the splitting of resonances due to heteronuclear 1H-13C scalar coupling in order to enhance the sensitivity and achieve spectral simplification. The principle behind decoupling is relatively simple and is based on the fact that a 180° RF pulse selective for one of the two spins, either 1H or 13C, refocuses scalar coupling evolution over the time period symmetrical around the 180° pulse. This principle is similar to that used in J-difference editing. Therefore, when acquiring 1H NMR signal the application of a short 180° pulse on the 13C channel in the middle of each dwell time would completely refocus heteronuclear scalar coupling at each acquisition point (Fig. 10A/B). Unfortunately, the large number of high-powered 180° pulses would lead to unacceptable sample heating and is never used in reality. The decoupling performance only slightly degrades when the 180° pulse spans a few dwell times. In the case that the delay between 180° pulses becomes zero, the decoupling method is referred to as continuous wave (CW) decoupling (Fig. 10C). Since the 180° pulses are stretched over a longer time with a proportional reduction in peak RF amplitude, CW decoupling is a feasible option for in vivo decoupling as far as RF power deposition and sample heating are concerned. However, the main drawback of CW decoupling is that a 180° rotation is only achieved very close to on-resonance. For selected applications, like 13C glycogen detection, this may be a viable option. However, for the far majority of in vivo applications, multiple metabolites across a range of chemical shifts require simultaneous decoupling. In these cases, on-resonance CW decoupling is inadequate and broadband decoupling methods must be employed.
Figure 10.
Principle of heteronuclear decoupling during 1H-[13C]-NMR. (A) A continuous 1H time domain signal is sampled at discrete points separated by the dwell-time Δ τ. (B) The application of short 180° pulses on the 13C channel in the middle of each dwell-time would lead to complete refocusing of heteronuclear scalar coupling evolution at each data acquisition point and to perfect decoupling. (C) RF power restrictions necessitate lengthening of the 180° 13C RF pulses over several dwell times, which would lead in the extreme case to continuous wave decoupling. (D) In order to improve the off-resonance performance, the regular 180° pulses are typically substituted with pulse combinations, composite or adiabatic RF pulses (denoted R, where the overbar represents a 180° phase inversion) and combined to form so-called decoupling super cycles.
Broadband decoupling methods make optimal use of the flexibility to stretch a 180° pulse beyond a single dwell-time by executing longer and more complicated RF pulses with inherent compensation towards imperfections (Fig. 10D). Traditionally the most popular decoupling sequences are MLEV-16 (56–58) and WALTZ-16 (59–61). The basic building block for MLEV and WALTZ decoupling are the composite pulses 90°(+x)180°(+y)90°(−x) and 90°(+x)180°(−x)270°(+x), respectively. Composite RF pulses are a collection of square RF pulses that achieve the same on-resonance rotation as a single square pulses but with compensation towards off-resonance effects and RF inhomogeneity. Fig. 11 shows the performance of square, MLEV and WALTZ RF pulses as a function of RF amplitude and frequency offset. Whereas the sensitivity of WALTZ towards RF inhomogeneity is identical to that of a square RF pulses, MLEV also has an increased insensitivity towards incorrect RF power settings (Fig. 11A). Even though MLEV and WALTZ RF pulses are significantly longer than a square pulse for the same on-resonance 180° rotation, they achieve a much wider inversion bandwidth (Fig. 11B). Since typical acquisition times are in the order of 100–300 ms, many composite RF pulses are required. The performance of these pulses is very poor when executed as a continuous train for the entire duration of the acquisition window. The poor performance can be traced back to the fact that the inversion frequency profile for individual composite RF pulses, while better than a square RF pulse, has significant imperfections (Fig. 11). These imperfections propagate through a decoupling pulse train, giving rise to large accumulative errors in the final frequency profile. Since minor imperfections are unavoidable, specific pulse phase schemes have been designed to minimize error propagation throughout decoupling sequences. These so-called decoupling sequences are essential to broadband decoupling. The specific 16-step decoupling super cycle that is used in combination with WALTZ composite RF pulses gives rise to the so-called WALTZ-16 decoupling scheme (59–61), demonstrating greatly enhanced performance over the frequency profile. Shorter, but less effective cycles are used in WALTZ-4 and WALTZ-8 decoupling.
Figure 11.

(A) RF amplitude and (B) frequency dependence of square, MLEV and WALTZ inversion pulses. The RF amplitude of square and WALTZ pulses are identical, whereas MLEV pulses have a decreased sensitivity towards the RF amplitude for inversions. The off-resonance performance of both MLEV and WALTZ pulses is significantly better than that of a square pulse.
Up to this point, the fact that decoupling pulses are allowed to run over several dwell-times has been ignored, given that the scalar coupling evolution is a relatively slow process compared to the data acquisition rate. However, restrictions on RF power deposition limit the available RF amplitude, typically leading to a lengthening of the RF pulse duration. For example, the RF amplitude for decoupling in the human brain at 4 T may be limited to 500 Hz, making an individual WALTZ element 3.0 ms in duration. During this relatively long pulse, the coherences will evolve under the effects of heteronuclear scalar coupling giving rise to small signal oscillations in the detected NMR signal, which in turn lead to so-called decoupling or cycling sidebands in the NMR spectrum (Fig. 12). The decoupling sidebands have two undesirable effects on the appearance of the NMR spectrum. Firstly, the multiple decoupling sidebands increase the effective noise level, leading to a reduced signal-to-noise ratio. Secondly, the intensity of the main resonance is redistributed across multiple smaller decoupling sidebands, leading to a reduction in the main decoupled signal. It is therefore desirable to minimize the decoupling sidebands and maximize the main decoupled resonance. Besides these two parameters, other often conflicting considerations include the minimum decoupling bandwidth, the allowable RF power deposition, the maximum available RF peak power and the sensitivity towards experimental imperfections like RF inhomogeneity. These parameters can be optimized and/or balanced with four basic variables, namely length, amplitude and shape of the decoupling pulse and the decoupling scheme. A rigorous comparison and evaluation of decoupling methods most commonly used for in vivo NMR has been given by de Graaf (62). Most noticeable, for RF amplitudes suitable for human applications at 4 Tesla (i.e. B2max = 500 Hz), the classic MLEV-16 and WALTZ-16 provide the best performance with an effective decoupling bandwidth of circa 1.7B2max for a 90% decoupling efficiency (i.e. the main decoupled resonance is at least 90% of a perfectly decoupled resonance). Furthermore, at higher RF amplitudes suitable for animal applications, many other decoupling methods involving adiabatic RF pulses become available (62).
Figure 12.
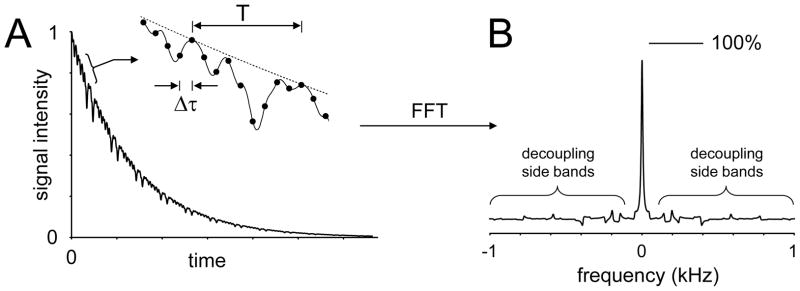
Time and frequency domain features of broadband decoupling. (A) In most realistic cases the length of the decoupling RF pulses span several dwell times Δ τ, such that the effects of heteronuclear scalar coupling evolution are not refocused until the end of the pulse. As a result part of the scalar coupling evolution is captured by the data acquisition points covering the length of the RF pulse. (B) These small modulations give rise to so-called decoupling or modulation side bands following Fourier transformation, potentially obscuring other, smaller resonances. The decoupling sidebands necessarily also lead to a reduction in the peak height of the main decoupled resonance (100% represents the maximum intensity in the case of perfect on-resonance CW decoupling).
Specific Absorption Rate (SAR)
Electrical fields associated with the RF probe during pulse transmission induce local currents in conductive media, such as human or animal tissues. In the presence of electrical resistance these circulating currents lead to power loss and subsequently to so-called ohmic or induction heating of the local tissue.
The amount of RF power deposition in tissues, expressed as the specific absorption rate (SAR), is limited by guidelines imposed by several government institutions, like the US Food and Drug Administration (FDA). Current guidelines state that the RF power deposition should not exceed 4 W/kg averaged over 15 min over the entire body which are relaxed to 12 W/kg averaged over 5 min for the extremities. For the head the guidelines are somewhat stricter with a maximum RF power deposition of 3 W/kg averaged over 10 min over the entire head and 8 W/kg in any gram of tissue averaged over 5 min. The average SAR is relatively easy to obtain by monitoring the total amplifier RF power output and determining the total tissue volume in which the RF power is deposited. RF power losses along the cables, filters and T/R switches do not reach the RF probe and should be subtracted from the total RF power seen by the RF probe. Furthermore, the coil is not 100% efficient in transferring the RF power to the subject. This efficiency can be measured by measuring the loaded and unloaded coil Q values (17). Other factors that affect the RF power delivery are power reflection and radiation losses. However, to attain the highest level of subject safety it is often best to be conservative and assume that all RF power from the amplifier, minus the losses over cables, filters and T/R switches, reaches the subject. The local SAR levels are much more difficult to obtain, since the electrical fields responsible for tissue heating cannot be readily measured in vivo. Especially the last criterion is most difficult to comply with due to local ‘hotspots’.
There are two kinds of electrical fields associated with an RF probe, namely a coil-specific, conservative field which arises from the charge distribution of the RF coil (i.e. the geometry of the RF probe) and sample-specific, non-conservative or induced fields which arise from the time-varying magnetic B1 field within the sample. The conservative electrical field can and should be minimized through proper RF probe design (e.g. distributed capacitance). The inductive electrical E1 field is closely associated with the magnetic B1 field that is essential for NMR and can therefore not be eliminated. Whereas the exact distribution of the magnetic B1 field can be readily mapped through MRI methods (19), the distribution of the electrical field depends on a number of parameters, like conductivity, and is not readily accessible in vivo. Furthermore, the relationship between B1 and E1 is complex at high magnetic fields which, together with the fact that the remaining conservative electrical E1 field is typically unknown, leads to the experimental realization that electrical E1 fields are not readily mapped in vivo. As a result, local SAR values must be obtained through finite difference time domain (FDTD) numerical methods for electromagnetism (63, 64).
Whereas the local temperature elevation is ultimately related to patient safety, guidelines have been established for SAR as non-invasive temperature mapping is for many techniques even more complicated. However, the chemical shift of the water resonance has a temperature sensitivity of −0.01 ppm/°C and has been used to perform non-invasive MRI-based temperature mapping of tissues in vivo (65).
Alternative detection methods
1H NMR without 13C pulses or decoupling
Many clinical MR platforms are limited to a single proton channel and do not routinely provide access to a decoupling channel. However, this has not prevented some groups from performing 1H-[13C] NMR spectroscopy without decoupling (66). In the absence of broadband decoupling, the 1H NMR spectral signature of 13C-labeled compounds is different from that of the non-labeled compounds due to the heteronuclear scalar coupling. Therefore, during the infusion of 13C-labeled substrates, e.g. [1-13C]-glucose, the glutamate and glutamine metabolic pools are slowly replaced with 13C-labeled glutamate and glutamine. Through the use of advanced spectral fitting procedures, like LCModel, it is possible to separate the 13C labeled and unlabelled compounds based on their spectral pattern. The absence of broadband decoupling necessarily leads to a reduced sensitivity and increased spectral complexity, as all resonances are now split into doublets by the heteronuclear scalar coupling.
13C NMR without or with low-power 1H decoupling
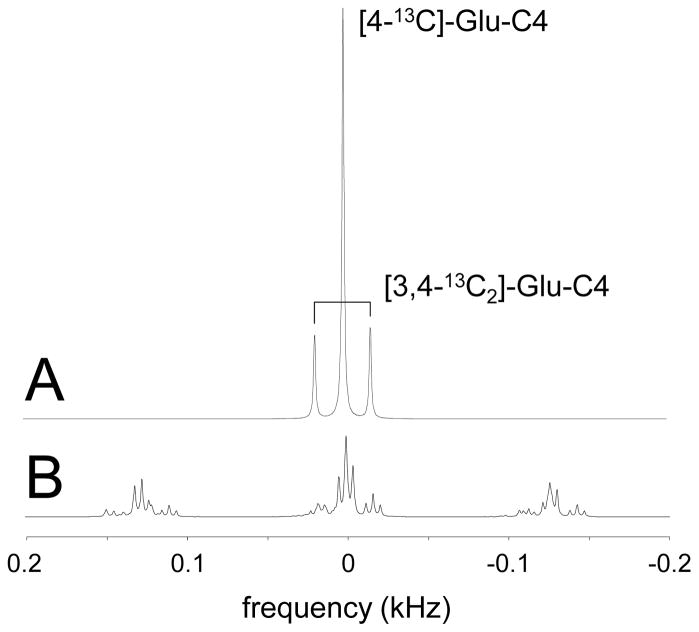
Recently several reports have appeared that performed 13C NMR without (67) or with low-power 1H decoupling (35, 36). The absence of broadband decoupling in 13C NMR typically comes with a stronger penalty in spectral complexity and sensitivity than for 1H NMR. This is because, whereas protons are always connected to a single 13C nucleus and thus forming a doublet signal, 13C nuclei are often connected to multiple protons. This leads to significantly more complicated spectral patterns (triplets, quartets, doublet of doublets) and a subsequent larger reduction in sensitivity. Fig. 13 shows an example of decoupled and non-decoupled 13C NMR spectra of [4-13C]-glutamate and [3,4-13C2]-glutamate. It is apparent that the absence of decoupling leads to greater spectral complexity and reduced peak intensity (Fig. 13B). Nevertheless, with accurate knowledge of one, two and three-bond heteronuclear scalar couplings (19, 67) and least-squares-based spectral fitting it has been shown that 13C NMR in the absence of decoupling can be quantified, albeit with a reduced sensitivity (67).
Figure 13.
13C NMR spectra of [4-13C]-glutamate and [3,4-13C2]-glutamate in (A) the presence and (B) the absence of broadband decoupling. 1H decoupling in (A) removed all splitting except the 13C-13C isotopomer splitting. In the absence of decoupling the 13C NMR spectrum becomes much more complicated with many low-intensity resonances, but can still be quantitatively described if all scalar coupling constants are known.
An alternative strategy that eliminates the spectral complexity obtained without decoupling while minimizing the RF power deposition from decoupling is to observe only 13C NMR signals from 13C nuclei without directly coupled protons, like [1-13C]- and [5-13C]-glutamate. As detailed earlier the RF power requirements of broadband decoupling are high because the 180° pulses must be short relatively to the heteronuclear scalar coupling evolution (~ 1/1JCH). Because 1JCH is very large for 13C nuclei with directly coupled protons (1JCH = 120 – 170 Hz), the 180° pulses must be in the order of 1 – 5 ms at a correspondingly high RF power. The heteronuclear scalar coupling between 13C nuclei and protons attached to the adjacent carbon nucleus is much smaller (2JCH = 3 – 5 Hz), such that the pulse length conditions during decoupling can be greatly relaxed. In these cases low-power ‘noise’ decoupling has been used to remove the small long-range splitting and obtain high-quality 13C NMR spectra. Using [2-13C]-glucose as a substrate provides identical information on TCA cycle activity as the more conventional [1-13C]-glucose. The primary disadvantage of the outlined technique is that signal enhancement techniques, like polarization transfer, cannot be employed such that the overall sensitivity is lower than that achievable through polarization transfer methods.
Sensitivity and resolution
The choice for direct 13C-[1H] or indirect 1H-[13C] NMR is ultimately determined by a number of factors of which spectral sensitivity and resolution are often the most important. When factors arising from relaxation, nuclear Overhauser enhancement, and polarization transfer are ignored, 1H NMR detection provides a 16 times (= (γH/γC)2) higher signal-to-noise ratio (SNR) than 13C NMR detection for equal number of spins (19). However, 13C NMR detection is often enhanced by polarization transfer which together with relaxation parameters reduces the SNR advantage of 1H NMR detection to 3–4 fold. For more complicated spin systems, like CH2 and CH3 groups, the polarization transfer efficiency decreases whereas the 1H NMR detection efficiency increases linearly. The sensitivity enhancement of 1H over 13C NMR detection is thus dependent on many variables and may be difficult to determine exactly. However, it is safe to state that indirect 1H-[13C] NMR detection provides several fold higher SNR. Of course, the accuracy of the detected metabolites is not only determined by the noise level, but also by the frequency separation of resonances. Since 1H NMR has a spectral dispersion of less than 5 ppm, overlap of resonances is the rule, especially at lower magnetic fields. 13C NMR on the other hand has a spectral dispersion of >100 ppm, which gives adequate separation of resonances even at low magnetic fields. For dynamic 13C NMR studies a crucial factor for the decision may be the separation of [4-13C]-glutamate from [4-13C]-glutamine. The H4 resonances of glutamate and glutamine essentially overlap in 1H NMR spectra at 4 T and lower making indirect 1H-[13C] NMR less desirable. However, at 7 T and higher these resonances become resolved such that indirect detection may become preferable over direct 13C NMR detection.
Hyperpolarized 13C NMR
As mentioned in the previous section, the sensitivity of 13C NMR is ultimately limited by the low nuclear polarization obtained at thermal equilibrium. Whereas indirect 1H-[13C] NMR can improve this several-fold, the thermal equilibrium nuclear polarization at currently available magnetic field strengths represents less than 0.01% of the potential, complete polarization. A number of methods have been proposed to enhance the nuclear polarization of spins to a significant fraction of unity. These methods, which are collectively referred to as hyperpolarization techniques, have recently begun to show potential for in vivo applications. The two techniques that show the greatest promise to study in vivo metabolism are para-hydrogen-induced polarization (68, 69) and dynamic nuclear polarization (70, 71). Since great detail about these methods can be found in many of the other articles in this special issue of NMR in Biomedicine, discussion of these methods is outside the scope of this review. However, it is informative to highlight some of the differences between the conventional and hyperpolarized 13C NMR methods.
As soon as the large 13C spin polarization is exposed to thermal equilibrium conditions the polarization will decay through T1 relaxation. At the current state of compound and technique development the longest T1 relaxation times are in the order of minutes. This means that a slow infusion protocol as depicted in Fig. 5A to build up a steady-state concentration of substrate in the blood is not feasible. Instead, all hyperpolarized compounds are currently administered as a high-concentration bolus. The substrate signal, of course, continues to decay as it travels through the vasculature and enters the various tissues. Similar to conventional 13C NMR the substrate is then converted to a range of products. In the case of [1-13C]-pyruvate typical products include [1-13C]-lactate and [1-13C]-alanine. At the current state of technique development products further downstream, e.g. glutamate, have not been detected, presumably because of signal loss due to T1 decay. Studying cerebral metabolism through hyperpolarized 13C NMR has proved difficult, possibly due to the slow blood-to-brain transport across the blood-brain barrier.
Since protons directly attached to a carbon-13 nucleus typically reduce the 13C T1 relaxation, the substrates studied to date, like [1-13C]-pyruvate, are hyperpolarized in the proton-free carbon position. This choice significantly simplifies NMR sequences as broadband decoupling is no longer required. Since the greatly increased sensitivity allows a much higher spatial resolution, signal localization is almost always performed in a spatially resolved manner, such as 13C MR spectroscopic imaging. However, since the hyperpolarized 13C NMR signal does not recover via T1 relaxation following excitation, special care in sequence development much be taken to optimally utilize the available 13C polarization. Typical solutions involve using low-angle excitation pulses or single-shot localization methods like echo-planar imaging (EPI).
Hyperpolarized 13C NMR is only in its infancy when compared to conventional 13C NMR. It has already displayed excellent spatial resolution and spectral dynamics in a number of applications. And while the quantitative aspects of hyperpolarized 13C NMR, which will have to include T1 relaxation, are currently unresolved, there is no doubt that it will provide unique new information about fast metabolic processes.
Metabolic modeling
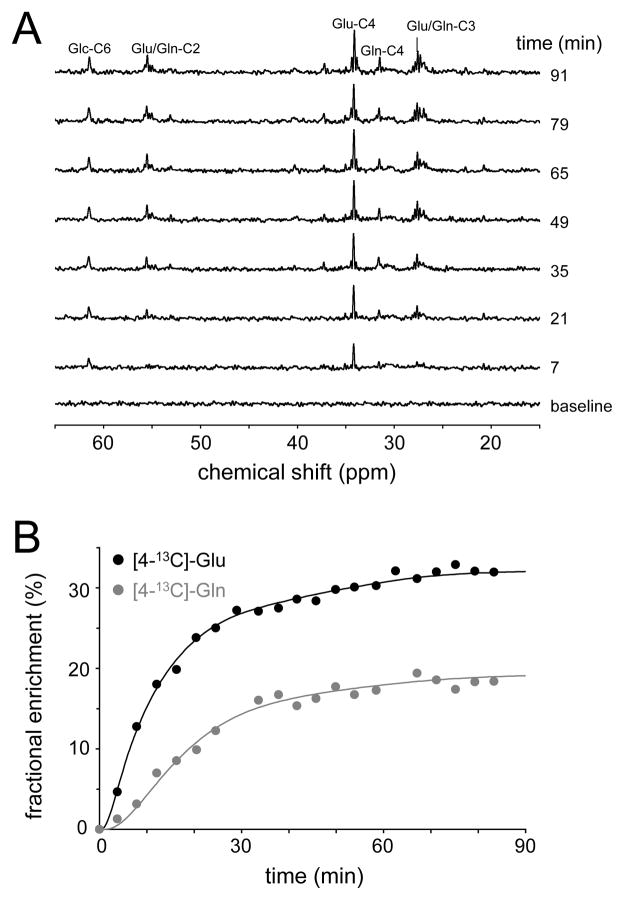
Following the repeated acquisition of NMR spectra (averaged over 5–10 min) during the 13C-labeled substrate infusion one ends up with a series of spectra displaying the dynamic incorporation of 13C label in various products (Fig. 14A). In order to obtain absolute metabolic fluxes through the various pathways one has to quantify the NMR spectra in terms of total and 13C-labeled metabolite concentrations. This can be done with any of the publicly or commercially available spectral fitting software programs, such as jMRUI (72) and LCModel (73). The dynamical changes of 13C-labeled metabolite levels then form the input for metabolic modeling. Metabolic modeling refers to a set of procedures which express a collection of metabolic pathways as mathematical differential equations in order to obtain absolute fluxes through these pathways. Fig. 3 schematically shows the metabolic pathways involved in cerebral glucose metabolism and glutamatergic and GABAergic neurotransmitter cycling. The time dependence of each metabolic pool is given by a differential equation describing the flow in and out of that pool. For example, the time dependence of the neuronal glutamate [GluN] pool is given by
Figure 14.
(A) Time resolved 1H-decoupled, 13C NMR spectra from rat brain in vivo following the intravenous infusion of [1,6-13C2]-glucose. Spectra are acquired with an adiabatic INEPT sequence (TR = 4000 ms, 200 uL) at 7.05 T. (B) Turnover curves of [4-13C]-glutamate and [4-13C]-glutamine. Dots represent measured fractional enrichments as obtained through spectral quantification of the data shown in (A), whereas the solid line represents the best mathematical fit to a three-compartment (blood, glutamatergic neurons and astroglia) metabolic model.
| [1] |
whereby the first two terms are metabolic flows into the glutamate pool from glutamine and 2-oxoglutarate, respectively. The last two terms represent the metabolic flows out of the glutamate pool. The differential equation [1] is equal to zero because the total neuronal glutamate pool does not change over time, i.e. the neuronal glutamate pool is at metabolic steady-state. Eq. [1] is a so-called mass-balance equation as it describes the flow of all mass (12C or 13C) to and from the neuronal glutamate pool. While Eq. [1] is trivial for the steady-state case, there are conditions where the metabolite levels are not constant over time. In those cases the mass-balance equations provide a quantitative description of the temporal dynamics of metabolite levels. For a complete description of the experiment, one also needs to track the flow of 13C isotope, which is done with isotope-balance equations. These equations are specific to the position of the carbon atom within a molecule, since different carbon positions will label at different rates depending on the substrate and metabolic pathways. The isotope-balance equation for the C4 position of neuronal glutamate [GluN4*] is given by
| [2] |
Mass and isotope balance equations similar to Eqs. [1]– [2] can be constructed for all metabolic pools, thereby making up the metabolic model. The model describing the metabolic pathways shown in Fig. 3 is referred to as a four compartment model, as it is composed of a blood compartment, and compartments for the glutamatergic neuron, GABAergic neuron and astroglia. Using the blood or brain glucose levels and fractional enrichments, the metabolic pool sizes and the measured fractional enrichment curves allow the calculation, through non-linear least-squares optimization, of a number of important fluxes like the neuronal and astroglial TCA cycles and the glutamate-glutamine and GABA-glutamine neurotransmitter cycles (Fig. 14B). For more details on cerebral metabolic models and turnover data analysis the reader is referred to the literature (9, 13, 74–76).
Acknowledgments
Research funding was provided by NIH grants P30-NS052519, R01-EB000473, R01-DK027121. We thank Dr Christoph Juchem for careful reading of the manuscript and for helpful suggestions.
Abbreviations used
- Ace
acetate
- AFP
adiabatic full passage
- BHB
β-hydroxybutyrate
- BIR-4
B1 independent rotation using 4 segments
- BW
bandwidth
- CW
continuous wave
- DG
2-deoxy-D-glucose
- FDG
2-fluoro-2-deoxy-D-glucose
- GABA
γ-aminobutyric acid
- GC-MS
gas chromatography-mass spectrometry
- Glc
glucose
- Gln
glutamine
- Glu
glutamate
- INEPT
insensitive nuclei enhanced by polarization transfer
- ISIS
image-selected in vivo spectroscopy
- PET
positron emission tomography
- LASER
localization by adiabatic spin-echo refocusing
- MQC
multiple-quantum-coherences
- OVS
outer volume suppression
- SAR
specific absorption rate
- SNR
signal-to-noise ratio
- TCA
tricarboxylic acid
- T/R
transmission/reception
References
- 1.Siesjo B. Brain energy metabolism. John Wiley; New York: 1978. [Google Scholar]
- 2.Raichle ME, Larson KB, Phelps ME, Grubb RL, Jr, Welch MJ, Ter-Pogossian MM. In vivo measurement of brain glucose transport and metabolism employing glucose-11C. Am J Physiol. 1975;228:1936–1948. doi: 10.1152/ajplegacy.1975.228.6.1936. [DOI] [PubMed] [Google Scholar]
- 3.Sokoloff L, Reivich M, Kennedy C, Des Rosiers MH, Patlak CS, Pettigrew KD, Sakurada O, Shinohara M. The [14C]deoxyglucose method for the measurement of local cerebral glucose utilization: theory, procedure, and normal values in the conscious and anesthetized albino rat. J Neurochem. 1977;28:897–916. doi: 10.1111/j.1471-4159.1977.tb10649.x. [DOI] [PubMed] [Google Scholar]
- 4.Phelps ME, Huang SC, Hoffman EJ, Selin C, Sokoloff L, Kuhl DE. Tomographic measurement of local cerebral glucose metabolic rate in humans with 18F-2-fluoro-2-deoxy-D-glucose: validation of method. Ann Neurol. 1979;6:371–388. doi: 10.1002/ana.410060502. [DOI] [PubMed] [Google Scholar]
- 5.Reivich M, Kuhl D, Wolf A, Greenberg J, Phelps M, Ido T, Casella V, Fowler J, Hoffman E, Alavi A, Som P, Sokoloff L. The [18F]fluorodeoxyglucose method for the measurement of local cerebral glucose utilization in man. Circ Res. 1979;44:127–137. doi: 10.1161/01.res.44.1.127. [DOI] [PubMed] [Google Scholar]
- 6.Sibson NR, Dhankhar A, Mason GF, Rothman DL, Behar KL, Shulman RG. Stoichiometric coupling of brain glucose metabolism and glutamatergic neuronal activity. Proc Natl Acad Sci USA. 1998;95:316–321. doi: 10.1073/pnas.95.1.316. [DOI] [PMC free article] [PubMed] [Google Scholar]
- 7.Sibson NR, Dhankhar A, Mason GF, Behar KL, Rothman DL, Shulman RG. In vivo 13C NMR measurements of cerebral glutamine synthesis as evidence for glutamate-glutamine cycling. Proc Natl Acad Sci USA. 1997;94:2699–2704. doi: 10.1073/pnas.94.6.2699. [DOI] [PMC free article] [PubMed] [Google Scholar]
- 8.Patel AB, de Graaf RA, Mason GF, Kanamatsu T, Rothman DL, Shulman RG, Behar KL. Glutamatergic neurotransmission and neuronal glucose oxidation are coupled during intense neuronal activation. J Cereb Blood Flow Metab. 2004;24:972–985. doi: 10.1097/01.WCB.0000126234.16188.71. [DOI] [PubMed] [Google Scholar]
- 9.Patel AB, de Graaf RA, Mason GF, Rothman DL, Shulman RG, Behar KL. The contribution of GABA to glutamate/glutamine cycling and energy metabolism in the rat cortex in vivo. Proc Natl Acad Sci USA. 2005;102:5588–5593. doi: 10.1073/pnas.0501703102. [DOI] [PMC free article] [PubMed] [Google Scholar]
- 10.van Eijsden P, Behar KL, Mason GF, Braun KP, de Graaf RA. In vivo neurochemical profiling of rat brain by 1H-[13C] NMR spectroscopy: cerebral energetics and glutamatergic/GABAergic neurotransmission. J Neurochem. 2010;112:24–33. doi: 10.1111/j.1471-4159.2009.06428.x. [DOI] [PMC free article] [PubMed] [Google Scholar]
- 11.Beckmann N, Turkalj I, Seelig J, Keller U. 13C NMR for the assessment of human brain glucose metabolism in vivo. Biochemistry. 1991;30:6362–6366. doi: 10.1021/bi00240a002. [DOI] [PubMed] [Google Scholar]
- 12.Gruetter R, Novotny EJ, Boulware SD, Mason GF, Rothman DL, Shulman GI, Prichard JW, Shulman RG. Localized 13C NMR spectroscopy in the human brain of amino acid labeling from D-[1-13C]glucose. J Neurochem. 1994;63:1377–1385. doi: 10.1046/j.1471-4159.1994.63041377.x. [DOI] [PubMed] [Google Scholar]
- 13.Gruetter R, Seaquist ER, Ugurbil K. A mathematical model of compartmentalized neurotransmitter metabolism in the human brain. Am J Physiol Endocrinol Metab. 2001;281:E100–E112. doi: 10.1152/ajpendo.2001.281.1.E100. [DOI] [PubMed] [Google Scholar]
- 14.Shen J, Petersen KF, Behar KL, Brown P, Nixon TW, Mason GF, Petroff OA, Shulman GI, Shulman RG, Rothman DL. Determination of the rate of the glutamate/glutamine cycle in the human brain by in vivo13C NMR. Proc Natl Acad Sci USA. 1999;96:8235–8240. doi: 10.1073/pnas.96.14.8235. [DOI] [PMC free article] [PubMed] [Google Scholar]
- 15.Van den Berg CJ, Krzalic L, Mela P, Waelsch H. Compartmentation of glutamate metabolism in brain. Evidence for the existence of two different tricarboxylic acid cycles in brain. Biochem J. 1969;113:281–90. doi: 10.1042/bj1130281. [DOI] [PMC free article] [PubMed] [Google Scholar]
- 16.Berl S, Nicklas WJ, Clarke DD. Compartmentation of citric acid cycle metabolism in brain: labelling of glutamate, glutamine, aspartate and GABA by several radioactive tracer metabolites. J Neurochem. 1970;17:1009–1015. doi: 10.1111/j.1471-4159.1970.tb02254.x. [DOI] [PubMed] [Google Scholar]
- 17.Adriany G, Gruetter R. A half-volume coil for efficient proton decoupling in humans at 4 Tesla. J Magn Reson. 1997;125:178–184. doi: 10.1006/jmre.1997.1113. [DOI] [PubMed] [Google Scholar]
- 18.Gruetter R, Adriany G, Choi IY, Henry PG, Lei H, Oz G. Localized in vivo 13C NMR spectroscopy of the brain. NMR Biomed. 2003;16:313–338. doi: 10.1002/nbm.841. [DOI] [PMC free article] [PubMed] [Google Scholar]
- 19.de Graaf RA. Principles and Techniques. 2. John Wiley; Chichester: 2007. In Vivo NMR Spectroscopy. [Google Scholar]
- 20.de Graaf RA, Mason GF, Patel AB, Rothman DL, Behar KL. Regional glucose metabolism and glutamatergic neurotransmission in rat brain in vivo. Proc Natl Acad Sci USA. 2004;101:12700–12705. doi: 10.1073/pnas.0405065101. [DOI] [PMC free article] [PubMed] [Google Scholar]
- 21.Choi IY, Gruetter R. In vivo 13C NMR assessment of brain glycogen concentration and turnover in the awake rat. Neurochem Int. 2003;43:317–322. doi: 10.1016/s0197-0186(03)00018-4. [DOI] [PubMed] [Google Scholar]
- 22.Choi IY, Tkac I, Ugurbil K, Gruetter R. Noninvasive measurements of [1-13C]glycogen concentrations and metabolism in rat brain in vivo. J Neurochem. 1999;73:1300–1308. doi: 10.1046/j.1471-4159.1999.0731300.x. [DOI] [PubMed] [Google Scholar]
- 23.Oz G, Henry PG, Seaquist ER, Gruetter R. Direct, noninvasive measurement of brain glycogen metabolism in humans. Neurochem Int. 2003;43:323–329. doi: 10.1016/s0197-0186(03)00019-6. [DOI] [PubMed] [Google Scholar]
- 24.Henry PG, Oz G, Provencher S, Gruetter R. Toward dynamic isotopomer analysis in the rat brain in vivo: automatic quantitation of 13C NMR spectra using LCModel. NMR Biomed. 2003;16:400–412. doi: 10.1002/nbm.840. [DOI] [PubMed] [Google Scholar]
- 25.Waniewski RA, Martin DL. Preferential utilization of acetate by astrocytes is attributable to transport. J Neurosci. 1998;18:5225–5233. doi: 10.1523/JNEUROSCI.18-14-05225.1998. [DOI] [PMC free article] [PubMed] [Google Scholar]
- 26.Pan JW, de Graaf RA, Petersen KF, Shulman GI, Hetherington HP, Rothman DL. [2,4-13C2]-beta-hydroxybutyrate metabolism in human brain. J Cereb Blood Flow Metab. 2002;22:890–898. doi: 10.1097/00004647-200207000-00014. [DOI] [PMC free article] [PubMed] [Google Scholar]
- 27.Deelchand DK, Nelson C, Shestov AA, Ugurbil K, Henry PG. Simultaneous measurement of neuronal and glial metabolism in rat brain in vivo using co-infusion of [1,6-13C2]glucose and [1,2-13C2]acetate. J Magn Reson. 2009;196:157–163. doi: 10.1016/j.jmr.2008.11.001. [DOI] [PMC free article] [PubMed] [Google Scholar]
- 28.Mason GF, Falk Petersen K, de Graaf RA, Kanamatsu T, Otsuki T, Rothman DL. A comparison of 13C NMR measurements of the rates of glutamine synthesis and the tricarboxylic acid cycle during oral and intravenous administration of [1-13C]-glucose. Brain Res Brain Res Protoc. 2003;10:181–190. doi: 10.1016/s1385-299x(02)00217-9. [DOI] [PubMed] [Google Scholar]
- 29.Morris GA, Freeman R. Enhancement of nuclear magnetic resonance signals by polarization transfer. J Amer Chem Soc. 1979;101:760–762. [Google Scholar]
- 30.Burum DP, Ernst RR. Net polarization transfer via a J-ordered state for signal enhancement of low-sensitivity nuclei. J Magn Reson. 1980;39:163–168. [Google Scholar]
- 31.Doddrell DM, Pegg DT, Bendall MR. Distortionless enhancement of NMR signals by polarization transfer. J Magn Reson. 1982;48:323–327. [Google Scholar]
- 32.Sorensen OW, Ernst RR. Elimination of spectral distortion in polarization transfer experiments. Improvements and comparison of techniques. J Magn Reson. 1983;51:477–489. [Google Scholar]
- 33.Gruetter R, Adriany G, Merkle H, Andersen PM. Broadband decoupled, 1H-localized 13C MRS of the human brain at 4 Tesla. Magn Reson Med. 1996;36:659–664. doi: 10.1002/mrm.1910360503. [DOI] [PubMed] [Google Scholar]
- 34.Choi IY, Tkac I, Gruetter R. Single-shot, three-dimensional “non-echo” localization method for in vivo NMR spectroscopy. Magn Reson Med. 2000;44:387–394. doi: 10.1002/1522-2594(200009)44:3<387::aid-mrm8>3.0.co;2-3. [DOI] [PubMed] [Google Scholar]
- 35.Li S, Yang J, Shen J. Novel strategy for cerebral 13C MRS using very low RF power for proton decoupling. Magn Reson Med. 2007;57:265–271. doi: 10.1002/mrm.21148. [DOI] [PubMed] [Google Scholar]
- 36.Li S, Zhang Y, Wang S, Araneta MF, Johnson CS, Xiang Y, Innis RB, Shen J. 13C MRS of occipital and frontal lobes at 3 T using a volume coil for stochastic proton decoupling. NMR Biomed. 2010;23:977–985. doi: 10.1002/nbm.1524. [DOI] [PMC free article] [PubMed] [Google Scholar]
- 37.Overhauser AW. Paramagnetic relaxation in metals. Phys Rev. 1953;89:689–700. [Google Scholar]
- 38.Overhauser AW. Polarization of nuclei in metals. Phys Rev. 1953;92:411–415. [Google Scholar]
- 39.Choi IY, Seaquist ER, Gruetter R. Effect of hypoglycemia on brain glycogen metabolism in vivo. J Neurosci Res. 2003;72:25–32. doi: 10.1002/jnr.10574. [DOI] [PMC free article] [PubMed] [Google Scholar]
- 40.Sorensen OW, Eich GW, Levitt MH, Bodenhausen G, Ernst RR. Product operator formalism for the description of NMR pulse experiments. Prog NMR Spectroscopy. 1983;16:163–192. [Google Scholar]
- 41.Pachler KGR, Wessels PL. Selective population inversion (SPI). A pulsed double resonance method in FT NMR spectroscopy equivalent to INDOR. J Magn Reson. 1973;12:337–339. [Google Scholar]
- 42.Silver MS, Joseph RI, Hoult DI. Highly selective π/2 and π pulse generation. J Magn Reson. 1984;59:347–351. [Google Scholar]
- 43.Garwood M, Ke Y. Symmetric pulses to induce arbitrary flip angles with compensation for RF inhomogeneity and resonance offsets. J Magn Reson. 1991;94:511–525. [Google Scholar]
- 44.Tannus A, Garwood M. Improved performance of frequency-swept pulses using offset-independent adiabaticity. J Magn Reson A. 1996;120:133–137. [Google Scholar]
- 45.Garwood M, Ugurbil K. B1 Insensitive Adiabatic RF Pulses. In: Diehl P, Fluck E, Gunther H, Kosfeld R, Seelig J, editors. NMR Basic Principles and Progress. Vol. 27. Springer-Verlag; Berlin: 1992. pp. 109–147. [Google Scholar]
- 46.de Graaf RA, Nicolay K. Adiabatic RF pulses: Applications to in vivo NMR. Concepts Magn Reson. 1997;9:247–268. [Google Scholar]
- 47.Hurd RE, John BK. Gradient-enhanced, proton-detected heteronuclear multiple-quantum coherence spectroscopy. J Magn Reson. 1991;91:648–653. [Google Scholar]
- 48.Vuister GW, Ruiz-Cabello J, van Zijl PCM. Gradient-enhanced multiple-quantum filter (ge-MQF). A simple way to obtain single-scan phase-sensitive HMQC spectra. J Magn Reson. 1992;100:215–220. [Google Scholar]
- 49.van Zijl PC, Chesnick AS, DesPres D, Moonen CT, Ruiz-Cabello J, van Gelderen P. In vivo proton spectroscopy and spectroscopic imaging of [1-13C]-glucose and its metabolic products. Magn Reson Med. 1993;30:544–551. doi: 10.1002/mrm.1910300504. [DOI] [PubMed] [Google Scholar]
- 50.Kanamori K, Ross BD, Tropp J. Selective, in vivo observation of [5-15N] glutamine amide protons in rat brain by 1H-15N heteronuclear multiple-quantum-coherence transfer NMR. J Magn Reson B. 1995;107:107–115. doi: 10.1006/jmrb.1995.1066. [DOI] [PubMed] [Google Scholar]
- 51.Rothman DL, Behar KL, Hetherington HP, den Hollander JA, Bendall MR, Petroff OA, Shulman RG. 1H-Observe/13C-decouple spectroscopic measurements of lactate and glutamate in the rat brain in vivo. Proc Natl Acad Sci USA. 1985;82:1633–1637. doi: 10.1073/pnas.82.6.1633. [DOI] [PMC free article] [PubMed] [Google Scholar]
- 52.de Graaf RA, Brown PB, Mason GF, Rothman DL, Behar KL. Detection of [1,6-13C2]-glucose metabolism in rat brain by in vivo 1H-[13C]-NMR spectroscopy. Magn Reson Med. 2003;49:37–46. doi: 10.1002/mrm.10348. [DOI] [PubMed] [Google Scholar]
- 53.Pfeuffer J, Tkac I, Choi IY, Merkle H, Ugurbil K, Garwood M, Gruetter R. Localized in vivo 1H NMR detection of neurotransmitter labeling in rat brain during infusion of [1-13C] D-glucose. Magn Reson Med. 1999;41:1077–1083. doi: 10.1002/(sici)1522-2594(199906)41:6<1077::aid-mrm1>3.0.co;2-#. [DOI] [PubMed] [Google Scholar]
- 54.Slotboom J, Mehlkopf AF, Bovee WM. A single-shot localization pulse sequence suited for coils with inhomogneous RF fields using adiabatic slice-selective RF pulses. J Magn Reson. 1991;95:396–404. [Google Scholar]
- 55.Garwood M, DelaBarre L. The return of the frequency sweep: designing adiabatic pulses for contemporary NMR. J Magn Reson. 2001;153:155–177. doi: 10.1006/jmre.2001.2340. [DOI] [PubMed] [Google Scholar]
- 56.Levitt MH, Freeman R. Composite pulse decoupling. J Magn Reson. 1981;43:502–507. [Google Scholar]
- 57.Levitt MH. Symmetrical composite pulse sequences for NMR population inversion. I. Compensation of radiofrequency field inhomogeneity. J Magn Reson. 1982;48:234–264. [Google Scholar]
- 58.Levitt MH. Symmetrical composite pulse sequences for NMR population inversion. II. Compensation for resonance offset. J Magn Reson. 1982;50:95–110. [Google Scholar]
- 59.Shaka AJ, Keeler J, Freeman R. Evaluation of a new broadband decoupling sequence: WALTZ-16. J Magn Reson. 1983;53:313–340. [Google Scholar]
- 60.Shaka AJ, Keeler J, Frenkiel T, Freeman R. An improved sequence for broadband decoupling: WALTZ-16. J Magn Reson. 1983;52:335–338. [Google Scholar]
- 61.Shaka AJ, Keeler J. Broadband spin decoupling in isotropic liquids. Prog NMR spectroscopy. 1987;19:47–129. [Google Scholar]
- 62.de Graaf RA. Theoretical and experimental evaluation of broadband decoupling techniques for in vivo NMR spectroscopy. Magn Reson Med. 2005;53:1297–1306. doi: 10.1002/mrm.20507. [DOI] [PubMed] [Google Scholar]
- 63.Collins CM, Li S, Smith MB. SAR and B1 field distributions in a heterogeneous human head model within a birdcage coil. Magn Reson Med. 1998;40:847–856. doi: 10.1002/mrm.1910400610. [DOI] [PubMed] [Google Scholar]
- 64.Collins CM, Liu W, Wang J, Gruetter R, Vaughan JT, Ugurbil K, Smith MB. Temperature and SAR calculations for a human head within volume and surface coils at 64 and 300 MHz. J Magn Reson Imaging. 2004;19:650–656. doi: 10.1002/jmri.20041. [DOI] [PubMed] [Google Scholar]
- 65.Rieke V, Butts Pauly K. MR thermometry. J Magn Reson Imaging. 2008;27:376–390. doi: 10.1002/jmri.21265. [DOI] [PMC free article] [PubMed] [Google Scholar]
- 66.Boumezbeur F, Besret L, Valette J, Vaufrey F, Henry PG, Slavov V, Giacomini E, Hantraye P, Bloch G, Lebon V. NMR measurement of brain oxidative metabolism in monkeys using 13C-labeled glucose without a 13C radiofrequency channel. Magn Reson Med. 2004;52:33–40. doi: 10.1002/mrm.20129. [DOI] [PubMed] [Google Scholar]
- 67.Deelchand DK, Ugurbil K, Henry PG. Investigating brain metabolism at high fields using localized 13C NMR spectroscopy without 1H decoupling. Magn Reson Med. 2006;55:279–286. doi: 10.1002/mrm.20756. [DOI] [PubMed] [Google Scholar]
- 68.Bowers CR, Weitekamp DP. Transformation of symmetrization order to nuclear-spin magnetization by chemical reaction and nuclear magnetic resonance. Phys Rev Lett. 1986;57:2645–2648. doi: 10.1103/PhysRevLett.57.2645. [DOI] [PubMed] [Google Scholar]
- 69.Bowers CR, Weitekamp DP. Parahydrogen and synthesis allow dramatically enhanced nuclear alignment. J Am Chem Soc. 1987;109:5541. [Google Scholar]
- 70.Abragam A, Goldman M. Principles of dynamic nuclear polarization. Rep Prog Phys. 1978;41:395–467. [Google Scholar]
- 71.Ardenkjaer-Larsen JH, Fridlund B, Gram A, Hansson G, Hansson L, Lerche MH, Servin R, Thaning M, Golman K. Increase in signal-to-noise ratio of > 10,000 times in liquid-state NMR. Proc Natl Acad Sci USA. 2003;100:10158–63. doi: 10.1073/pnas.1733835100. [DOI] [PMC free article] [PubMed] [Google Scholar]
- 72.Naressi A, Couturier C, Castang I, de Beer R, Graveron-Demilly D. Java-based graphical user interface for MRUI, a software package for quantitation of in vivo/medical magnetic resonance spectroscopy signals. Comput Biol Med. 2001;31:269–286. doi: 10.1016/s0010-4825(01)00006-3. [DOI] [PubMed] [Google Scholar]
- 73.Provencher SW. Estimation of metabolite concentrations from localized in vivo proton NMR spectra. Magn Reson Med. 1993;30:672–679. doi: 10.1002/mrm.1910300604. [DOI] [PubMed] [Google Scholar]
- 74.Mason GF, Gruetter R, Rothman DL, Behar KL, Shulman RG, Novotny EJ. Simultaneous determination of the rates of the TCA cycle, glucose utilization, alpha-ketoglutarate/glutamate exchange, and glutamine synthesis in human brain by NMR. J Cereb Blood Flow Metab. 1995;15:12–25. doi: 10.1038/jcbfm.1995.2. [DOI] [PubMed] [Google Scholar]
- 75.Mason GF, Rothman DL, Behar KL, Shulman RG. NMR determination of the TCA cycle rate and alpha-ketoglutarate/glutamate exchange rate in rat brain. J Cereb Blood Flow Metab. 1992;12:434–447. doi: 10.1038/jcbfm.1992.61. [DOI] [PubMed] [Google Scholar]
- 76.Mason GF. Metabolic modeling analysis of brain metabolism. In: Shulman RG, Rothman DL, editors. Brain energetics and neuronal activity. Wiley; Chichester: 2004. pp. 53–72. [Google Scholar]


