Abstract
The goal of this work was to create a finite element micromechanical model of the myotendinous junction (MTJ) to examine how the structure and mechanics of the MTJ affect the local micro-scale strains experienced by muscle fibers. We validated the model through comparisons with histological longitudinal sections of muscles fixed in slack and stretched positions. The model predicted deformations of the A-bands within the fiber near the MTJ that were similar to those measured from the histological sections. We then used the model to predict the dependence of local fiber strains on activation and the mechanical properties of the endomysium. The model predicted that peak micro-scale strains increase with activation and as the compliance of the endomysium decreases. Analysis of the models revealed that, in passive stretch, local fiber strains are governed by the difference of the mechanical properties between the fibers and the endomysium. In active stretch, strain distributions are governed by the difference in cross-sectional area along the length of the tapered region of the fiber near the MTJ. The endomysium provides passive resistance that balances the active forces and prevents the tapered region of the fiber from undergoing excessive strain. These model predictions lead to the following hypotheses: (i) the increased likelihood of injury during active lengthening of muscle fibers may be due to the increase in peak strain with activation and (ii) endomysium may play a role in protecting fibers from injury by reducing the strains within the fiber at the MTJ.
Keywords: Myotendinous junction, Injury, Strain, Muscle mechanics, Micromechanics, Finite element modeling, Muscle microstructure
1. Introduction
The myotendinous junction (MTJ) is a common location of injury in skeletal muscles. In vivo imaging studies in humans (De Smet and Best, 2000; Garrett et al., 1989; Silder et al., 2008) and animal models of injury (e.g. Nikolaou et al., 1987) have shown macroscopic damage resulting from acute injury to be most commonly located near the MTJ. Similarly, microscopic damage associated with contraction-induced injury is thought to initiate near the MTJ (Lieber and Friden, 2002; Noonan and Garrett, 1992).
The relationship between the complex structure of the MTJ and the propensity for injury is poorly understood. Muscle fibers often taper as they approach the tendon (e.g. Barrett, 1962; Eisenberg and Milton, 1984) and the surrounding endomysium merges with the tendon. It has been suggested that stress concentration at the tapered ends of fibers increases the likelihood of injury at the MTJ (Lieber et al., 1991). The attachment of fibers to the endomysium is thought to play a critical role in protecting fibers from injury (Ibraghimov-Beskrovnaya et al., 1992; Lynch et al., 2000). However, a clear relationship between the morphology of the MTJ, the mechanical properties of the endomysium, and the occurrence of injury has not been established.
Excessive sarcomere strain is thought to be the cause of injury (Lieber and Friden, 2002; Macpherson et al., 1997; Morgan and Allen, 1999). Previous experiments have indicated that muscles are most prone to injury during active lengthening (Armstrong et al., 1983; Newham et al., 1983; Schwane and Armstrong, 1983). Therefore, a computational model that can predict local micro-scale strains near the MTJ during active lengthening would enable us to relate MTJ morphology, mechanical properties, and injury susceptibility. Current computational models of muscle (e.g. Rehorn and Blemker, 2010) represent the MTJ as an abrupt interface between muscle and tendon and are therefore unable to predict micro-scale strains within the fiber near the MTJ. Due to the heterogeneity of the mechanical properties of tendon, endomysium, and muscle fibers (e.g. Lieber et al., 2003; Zajac, 1989), the micro-scale strains within fibers are likely to be higher than macro-scale or tissue-level strains (e.g. Dvorak and Benveniste, 1992). In order to explore the structure and function of the MTJ, a micromechanical model that explicitly represents the morphology and mechanical properties of fibers and endomysium is needed.
The goals of this work were to (i) create a micromechanical finite element (FE) model of the MTJ, (ii) validate the model through comparisons with histological longitudinal sections of muscles fixed in slack and stretched positions, and (iii) use the model to predict the dependence of micro-scale strains within fibers on activation and the mechanical properties of the endomysium.
2. Methods
2.1. Histological longitudinal sections of slack and stretched muscles
Pairs of flexor carpi radialis, extensor carpi ulnaris, and palmatis longus muscles were dissected from 58 week-old male mice, in accordance with a protocol approved by the Animal Care and Use Committee at the University of Virginia. These muscles were chosen for their similarity in architecture and function. To fix the muscles in slack and stretched positions, we used four muscle culture systems (Scientific Instruments Heidelberg GmbH, Heidelberg, Germany), each comprised of a muscle bath and a measurement and control module (Janssen et al., 1998). Each muscle was secured through its aponeurosis of origin and tendon of insertion by stainless steel hooks (Fig. 1) submerged in a chamber filled with 30 mM 2,3-butanedione monoxime (BDM) to prevent cross-bridge binding. One hook was attached to a force transducer (Fig. 1) and the other to a servomotor. Both hooks were attached to micrometers used to manually adjust the distance between the two. To set the slack position, muscle–tendon units were first hung visibly slack and then slowly stretched using the servomotor micrometer until the passive force measured by the force transducer began to increase. The muscle was then unstretched to the nearest 0.05 mm setting on the micrometer. One of each pair of muscle–tendon units was stretched by 30% of its slack length. After 5 min, the BDM solution was exchanged with a 4% formaldehyde solution diluted with phosphate buffered saline. The muscles remained in the fixative for 72 h (with a solution change at 36 h).
Fig. 1.
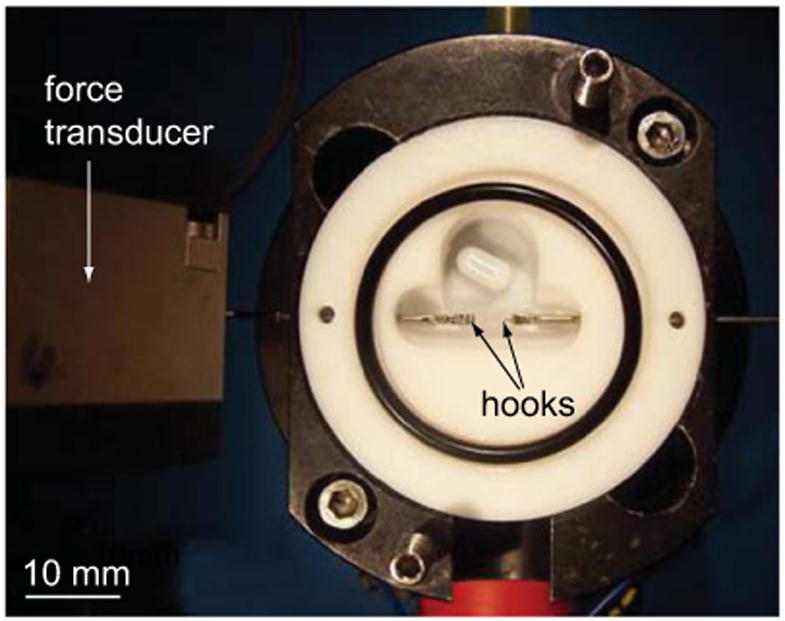
Experimental apparatus. Each muscle was secured to the hooks through its aponeurosis of origin at one end and tendon of insertion at the other end. Micrometers attached to each hook were used to adjust muscle–tendon length. Slack length was set based on the readout from the force transducer, which was capable of receiving output in the linear range of 0–50 mN (resolution at 0.9 kHz; 15 μN).
Fixed muscles were trimmed and embedded in paraffin wax. Longitudinal sections were cut 5 μm thick and stained with hematoxylin and eosin. The sections were imaged at a magnification of 40 × and concatenated to create images of one or more fibers. From these images, eight slack and seven stretched fibers were chosen for analysis, based on the following criteria: (i) the fiber's insertion into the tendon was visible, (ii) the fiber remained in the plane of sectioning, and (iii) the fiber did not appear to have undergone extensive damage from the sectioning process. For each fiber, the image in which its width was the largest was chosen and assumed to be a section through the middle of the fiber.
Sarcomere lengths were measured manually from the histological images using ImageJ (US National Institutes of Health, Bethesda, MD) to determine the average along-fiber strain to input into the model. We measured an average sarcomere length of 2.06 ± 0.12 μm for slack fibers and 2.55 ± 0.11 μm for stretched fibers. Based on these lengths we calculated an average along-fiber strain of 0.24 for the stretched fibers relative to the slack fibers. The angle between the slack fibers and the tendon was measured as 37° ± 7° and was used as the pennation angle in the model.
To quantify fiber deformations, we measured the deflections of A-bands visible in the histological sections (Fig. 2). A-bands were manually traced in each image using Osirix imaging software (www.osirix-viewer.com). Deflection at each point along the A-band was defined as the distance between that point and the straight line connecting the two ends of the A-band. The A-band deflections were negligible for the slack fibers. Therefore the A-band deflections in the stretched fibers provide a measure of the deformation of the fiber relative to the slack position. Straight A-bands orthogonal to the fiber indicate that strains are uniform across the diameter of the fiber and the absence of shear strain. Deviation from straight orthogonal lines indicates the presence of shear deformation, and curved A-bands occur if strain is nonuniformly distributed across fiber diameter. Based on the traces, we calculated the peak deflection, δ, as a function of l, the distance along the fiber from the fiber tip (Fig. 2). Both δ and l were normalized by the fiber diameter d to enable comparison between different fibers.
Fig. 2.
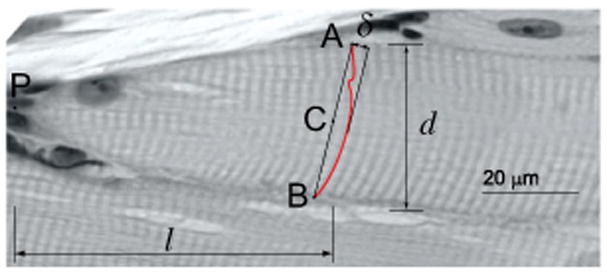
Measurement of deformation from histological cross-sections; δ is the peak deflection of the A-band from a straight line connecting its two endpoints (line AB). We used OsiriX to trace A-bands along the fiber with cubic splines to allow the measurement of δ; l is the distance along the fiber between the fiber tip (point P) and the midpoint of the straight line (point C). Both δ and l were normalized by the diameter of the stretched fiber, d, to enable comparison between different fibers.
2.2. Finite element model geometry
We created an idealized FE model geometry that was based on the general shape of the histological sections obtained from slack muscles (Fig. 3A). We used a planar finite element model to represent a section through the middle of the fiber. The tapered part of the fiber was modeled as an ellipse. The major axis of the ellipse, which determines the amount of tapering, was chosen to maximize agreement between the model and the experimental measurements. To justify the use of the planar model, we compared the strains predicted by this model to a cylindrical three-dimensional model of the fiber, where the tapering was modeled as an ellipsoid. The strains predicted by the three-dimensional model on the plane of symmetry were identical to those predicted by the planar model. Therefore, the planar model was chosen over the three-dimensional model as it contained fewer elements (8164 elements compared to 32,480).
Fig. 3.
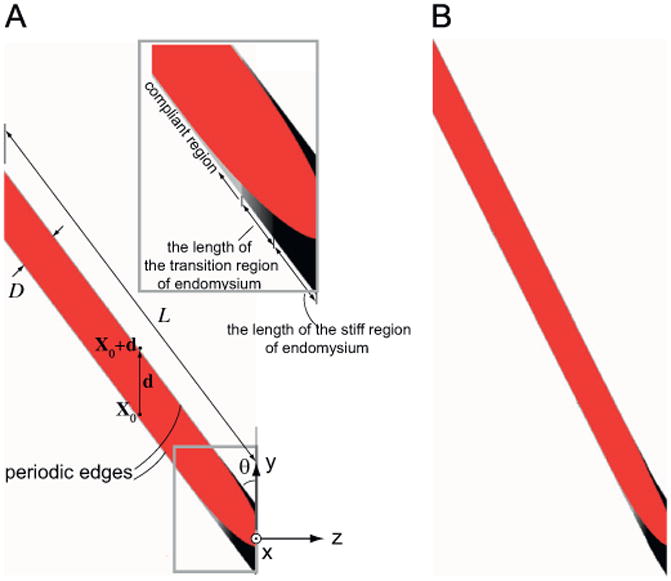
Model geometry in undeformed (A) and deformed (B) configurations. The tapering end of the fiber is attached to a tendon that runs in the y direction. The pennation angle, θ, is 37°. We have assumed that the microstructure geometry of muscle is periodic, in that each fiber is surrounded by many fibers with the exact same geometry. This idealization allows us to apply periodic boundary conditions to simulate the effect of the presence of the neighboring fibers on the fiber that is modeled (Appendix A). The two periodic edges of the model are constrained via periodic boundary conditions (Eq. (A.3)) to maintain the same shape throughout the deformation, while homogeneous boundary conditions are imposed on the two ends (Eq. (A.4)). The ratio of fiber length to fiber diameter, L/D, needs to be reasonably large so as not to affect strain concentrations within the tapered part of the fiber. A ratio of L/D=10 was chosen. The stiffer region of the endomysium is shown in black, the most compliant region is represented with light gray, while the region with gradually changing stiffness is shown in gradually changing shades of gray (A inset).
The planar model is one element thick in the direction orthogonal to the plane of the fiber (x direction). The fiber makes a 37° angle with the direction of the tendon (y direction Fig. 3A). We have assumed that the microstructure geometry of muscle is periodic, in that each fiber is surrounded by many fibers with the same geometry. This idealization allows us to apply periodic boundary conditions to simulate the presence of neighboring fibers (Appendix A). Hexahedral meshes were created based on this geometry using the FE mesh generator TrueGrid (XYZ Scientific Applications, Livermore, CA).
Periodic boundary conditions were imposed to simulate stretching of the muscle-tendon unit along the tendon direction (direction y in Fig. 3). The boundary conditions (Appendix A) result in an overall lengthening and shear deformation in the plane of the fiber (y-z in Fig. 3).
2.3. Constitutive model for the fiber and the endomysium
We used a hyperelastic, nearly incompressible, transversely isotropic constitutive model to represent the behavior of the fiber and the endomysium (Blemker et al., 2005):
| (2.1) |
where λ is along-fiber stretch, ψ is along-fiber shear, β is cross-fiber shear, and J is the relative change in volume. The “fiber” direction in the constitutive model is the axis of transverse isotropy for the muscle fiber and the endomysium, which we have assumed is collinear with the direction of the muscle fiber.
The functional forms adopted for Wψ and Wβ were chosen to represent nonlinear stiffening behavior while remaining consistent with allowable forms for these terms (Criscione et al., 2001):
| (2.2) |
The contribution of volume strain is defined as WJ =(K/2)lnJ2(Blemker et al., 2005). The contribution of along-fiber stretch, Wλ(λ),is defined such that
| (2.3) |
where σtotal is the along-fiber Cauchy stress:
| (2.4) |
The expressions for σactive and σpassive are defined in Table 1 (Blemker et al., 2005) and the values of the relevant material constants are given in Table 2. The along-fiber tensile material constants for passive and active muscle fibers were defined based on previously published data (Friden and Lieber, 2003; Gollapudi and Lin, 2009). The along-fiber shear material constants for the fiber and the endomysium and the along-fiber tensile material constants for the endomysium were chosen to maximize agreement between the model and the experimental measurements.
Table 1.
Constitutive model equations (Eq. (2.4)).
| Passive stress | ||
|
|
||
| Active stress in muscle fibers (σiso=0 for the connective tissues)a | ||
|
|
λ ≤ 0.6 λ ofl | |
|
|
0.6 λofl ≤ λ ≤ 1.4λofl | |
|
|
λ ≥ 0.6λofl | |
σiso is the peak isometric stress, 0 ≤ α ≤ 1 is activation level, and λofl is the optimal sarcomere length normalized by slack sarcomere length.
Table 2.
Material constants.
| Muscle fiber | Compliant region of endomysium | Stiff region of endomysium | |||
|---|---|---|---|---|---|
| Along-fiber stretch constants (Table 1) | |||||
| C1 (Pa) | 3.75E3 | C1 (Pa) | 3.75E2 | C1 (Pa) | 3E4 |
| C2(dimensionless) | 6.6 | C2(dimensionless) | 6.6 | C2(dimensionless) | 6.6 |
| σiso (Pa) | 3E5 | ||||
| λofl (dimensionless) | 1.22 | ||||
| Along-fiber shear constants (Eq. (2.2)) | |||||
| Gψ (Pa) | 1.25E3 | Gψ (Pa) | 1.25E2 | Gψ (Pa) | 1.25E3 |
| Aψ (dimensionless) | 2.0 | Aψ (dimensionless) | 2.0 | Aψ (dimensionless) | 2.0 |
| Cross-fiber shear constants (Eq. (2.2)) | |||||
| Gβ (Pa) | 1.25E3 | Gβ (Pa) | 1.25E2 | Gβ (Pa) | 1.25E3 |
| Aβ (dimensionless) | 2.0 | Aβ (dimensionless) | 2.0 | Aβ (dimensionless) | 2.0 |
| Volume constants (bulk modulus) | |||||
| K (Pa) | 2.5E7 | K (Pa) | 2.5E6 | K (Pa) | 2.5E7 |
The endomysium was assumed to have varying moduli along the length of the fiber. As such, we defined three regions on the endomysium: a “stiff” region, a “compliant” region, and a “transition” region (Fig. 3A inset, Table 2). The stiff region surrounds the fiber at the tendon, and was assigned the stiffest properties. The compliant region surrounds most of the length of fiber not immediately adjacent to the tendon, and was assigned the most compliant properties. The transition region was located in between the stiff and compliant regions and had material constants that were determined by linearly interpolating between the material constants of the stiff region and those of the compliant region. The lengths of the stiff and transition regions were chosen to maximize agreement between the model and the experimental measurements.
2.4. Model simulations
To simulate passive stretch, the boundary conditions (Appendix A) were implemented in NIKE3D (Puso, 2006). For active stretch the same boundary conditions were imposed along with applying an activation level that increased incrementally from 0 to 1 (Table 1). To compare the deformations predicted by the model with those measured experimentally, we performed a set of simulations of 24% passive (α = 0) stretch (macroscopic tensile strain Λ−1 = 0.24 in Appendix A). The along-fiber shear and stretch material constants of the endomysium and the shear material constants of the fiber were adjusted such that the A-band deformations predicted by the model most closely predicted the experimental measurements. Once these constants were determined, we ran a set of passive (α = 0) and active (100% activation, α = 1) simulations of 10% lengthening (macroscopic tensile strain Λ−1 = 0.1 in Appendix A), while scaling the shear and tensile moduli of all the regions of endomysium (C1, Gψ, Gβ, and K in Table 1 and Eq. (2.2)) with respect to the values given in Table 2. We used these simulations to analyze the relationship between the effects of activation and endomysium properties on local microscale tensile strains.
2.5. Comparison between experimental measurements and model predictions
To compare the deformations predicted by the model and A-band deflection measurements taken from the histological cross-sections, we calculated the deformation of regularly spaced lines in the FE model. Each line consisted of 21 points and was perpendicular to the fiber direction in the undeformed configuration (consistent with the geometry of A-bands in slack fiber images). The displacements of these points were tracked throughout the simulation. Peak deflections were measured as a function of distance along the fiber for the deformed model using the same method as described for the experiment.
3. Results
In all of the experimentally stretched fibers, the A-bands formed similar curves (Fig. 4B). The experimentally measured normalized peak A-band deflection (δ/d) initially rose with normalized distance from the tip of the fiber (l/d), after which it gradually decayed to zero (Fig. 5B). This trend indicates that strain nonuniformity is concentrated near the MTJ. The passively stretched model was able to reproduce the experimentally observed trend of the A-band deflections (Fig. 5B). In order for the model to predict this trend, it had to include (i) fiber tapering, (ii) a compliant region of the endomysium that was less stiff than the fiber (Fig. 3A inset, Table 2), and (iii) a transition region. A detailed description of how the geometric and material parameters affected the shape of the peak A-band deflection curve predicted by the model is provided in the Supplementary material.
Fig. 4.
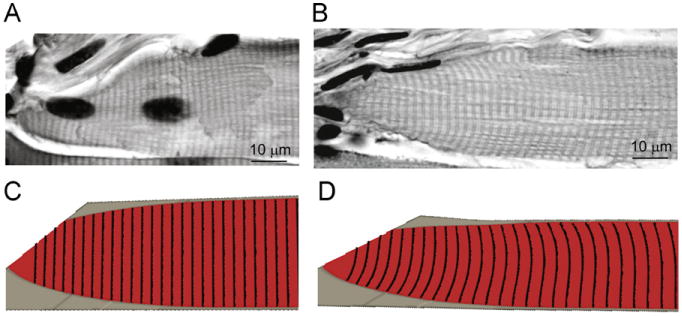
Qualitative comparison between the shapes of the A-bands observed in the longitudinal sections with those predicted by the model. The A-bands are seen as dark lines in the longitudinal sections of fibers from muscles fixed in the slack (A) and stretched (B) positions. The FE model assumed that the A-bands are initially flat lines perpendicular to the fiber (C). The deformation of the lines was tracked through the simulation and shown in the final configuration of the model (D).
Fig. 5.
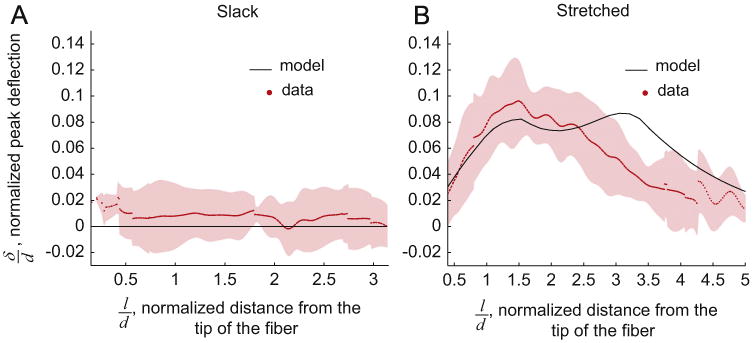
Peak A-band deflection, δ/d, as a function of normalized distance from the fiber tip, l/d, δ/d was measured at discrete values along the l/d axis for each fiber and these l/d values were not the same for all fibers; therefore cubic splines were used to interpolate the data points and the average (dots) and standard deviation (shaded region) were calculated based on the cubic spline fits. Some of the fibers were shorter, or the region in which the A-bands were traced was smaller than other fibers. Therefore all the individual curves did not span the entire range of l/d, resulting in the discontinuity of the data. For the slack fiber images (n = 8) the deflections were negligible (A). Similarly, the model assumed flat A-bands in the slack position (A). The model was able to predict the trend in measured δ/l based on the images of the stretched fibers (n = 7) (B).
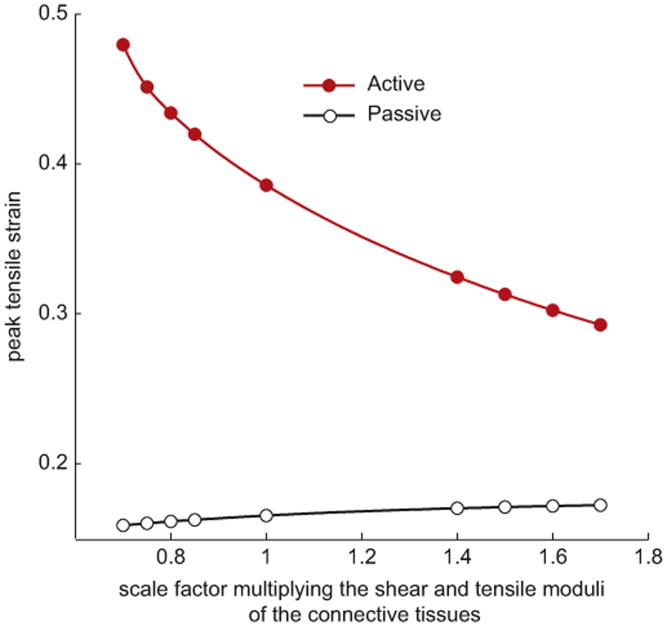
The model predicted that strains within the fiber were nonuniform in both passive and active stretches. Therefore the peak local strains were higher than the applied macroscopic tissue strain. Peak local tensile strains increased with activation (Figs. 6 and 7). For the best-fit model (corresponding to an abscissa value of 1 in Fig. 7), the peak strain increased from 0.17 to 0.39 with activation. The location of peak strain also changed with activation. Peak strains in the fiber occurred adjacent to the end of the transition region of the endomysium in passively stretched fibers (Fig. 6B), and at the end of the fiber immediately adjacent to the tendon in actively stretched fibers (Fig. 6E). Decreasing the stiffness of the endomysium resulted in a significant increase in peak strains for the active lengthening condition (Figs. 6D–F and 7). By contrast, decreasing the stiffness of the endomysium had negligible effect for the passive lengthening condition (Figs. 6A–C and 7).
Fig. 6.
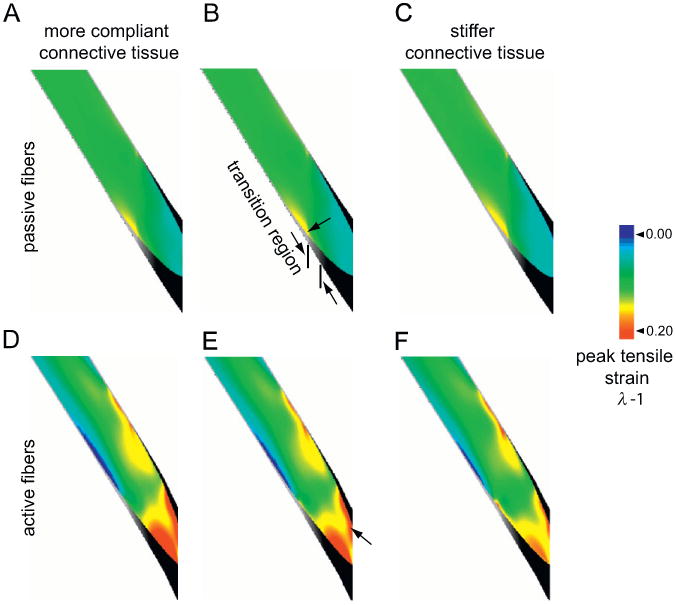
Contour plots of tensile strains in passively (A–C) and actively (D–F) stretched fibers. All fibers underwent a macroscopic strain of 0.1. The active strain plots correspond to 100% activation (α = 1). B and E correspond to the model that matches the experimental deformations (Fig. 5). The material constants for this model are given in Table 2. The model in A and D has a more compliant endomysium and corresponds to an abscissa value of 0.7 in Fig. 7. The model in C and F has a stiffer endomysium and corresponds to an abscissa value of 1.7 in Fig. 7. The arrows (B and E) point to the location of peak strain. The length of the endomysium region with gradually varying stiffnesses has been illustrated in B.
Fig. 7.
Peak tensile strain (λ − 1) experienced by the fiber as a function of the tensile modulus of the endomysium for passive and active stretches. The overall fiber stretch is 10% for all models. The values of C1, Gψ,and Gβ (Table 1 and Eq. (2.2)) for each model, represented as a point on the plot, are obtained by multiplying the values of these moduli for the stiff and compliant regions of the endomysium, given in Table 2, by the value of the scale factor on the horizontal axis.
4. Discussion
The purpose of this work was to develop a finite element micromechanical model to explore the mechanisms that affect local strain distributions within muscle fibers near the MTJ. We demonstrated that local micro-scale strains are higher than the macro-scale strains experienced by the muscle tissue near the MTJ. Micro-scale strain concentrations arise from specific features of the microstructure, including the tapering of the fiber and the difference in stiffness between the fiber and the surrounding endomysium. The strains predicted by the model can be thought of as the strains experienced by the sarcomeres and therefore provide insight into the likelihood of injury. It has been previously suggested that the higher likelihood of injury during active lengthening is a result of higher stresses (e.g. Brooks et al., 1995). The results presented here suggest an alternative hypothesis: the higher likelihood of injury with activation may be due to larger micro-scale strains in active lengthening compared to passive lengthening for the same average fiber stretch.
Our model predicted that, in passively stretched muscle, peak strains occurred near the most compliant region of the endomysium (Fig. 6B). Strain concentrations in passive stretch result from the difference between the stiffness of the fiber and that of the stiff endomysium surrounding the tip of the fiber at the MTJ. In the actively stretched simulations, peak strains occurred at the MTJ and were a result of the tapering of the fiber. At the MTJ where the fiber cross-sectional area is the smallest, the sarcomeres stretch further to balance the forces from more distal regions of the fiber with larger cross-sectional areas. If tapering is removed from the model, the difference between passive and active peak strains is negligible.
Our findings on the location of peak strain are consistent with experimental observations regarding the location of rupture when muscles are stretched to failure under passive and active conditions. Failure has been reported to occur near the MTJ in passive stretch (Law et al., 1995; Tidball et al., 1993) and at the attachment (within the interface between fiber and tendon) in active stretch (Law et al., 1995; Tidball et al., 1993). Since the interface is not explicitly included in our model, we are not able to predict if failure would initiate within the interface or within the sarcomeres at the end of the fiber.
Both activation and endomysium stiffness affected the model predictions of sarcomere strains at the MTJ. Peak strains increased significantly with activation, which may explain the higher likelihood of injury observed during active lengthening. Peak strains during active stretch were higher for fibers with more compliant endomysium. This result can be interpreted as follows: under active conditions, the endomysium provides resistance that balances active forces between the regions of the fiber with larger and smaller cross-sectional areas due to tapering, and hence protects the end of the fiber from excessive strain. More compliant endomysium provides less resistance, less ability to balance forces in the fiber, and is therefore less capable of providing protection from excessive strain. This mechanism may provide an explanation for the increased propensity for injury in muscles affected by the Duchene muscular dystrophy, where the mechanical linkage between fibers and endomysium has been compromised (Pasternak et al., 1995; Petrof, 1998).
Our analysis does not account for the variability in the amount of tapering of the fiber at the MTJ, fiber pennation angle, and the lengths of the stiff and transition regions of the endomysium among different fibers in the experiment. These parameters may vary both within and between muscles. However, the peak deflection versus distance curves from all the fiber showed the same qualitative behavior. More importantly, we found that irrespective of the exact values of these properties, our predictions with regard to the effects of activation and endomysium stiffness were valid, even though the absolute values of tensile strain may be variable.
We assumed that the mechanical properties of the fiber are uniform along its length. Previous studies have reported that sarcomeres near the MTJ are shorter than sarcomeres in the rest of the fiber (e.g. Eisenberg and Milton, 1984). It has also been observed that sarcomeres near the MTJ are less extensible in passive and active stretches of single fibers and therefore must be stiffer (Huxley and Peachey, 1961). However, we found no statistically significant difference between sarcomere lengths near the MTJ and throughout the rest of the fiber, for the slack or the stretched fibers.
The constitutive model used to describe the behavior of muscle fibers in our FE model did not include dynamic effects such as short-range stiffness, viscoelasticity, or force–velocity dependence. Therefore, our predictions focus on the effects of the structural complexity and quasi-static mechanics of the MTJ. Future extension of our models to include these dynamic behaviors would allow for exploration of the interaction between structural effects explored in this study and these dynamic effects. We predict that incorporation of these effects into the model would effectively stiffen the behavior of the tissues and therefore decrease the magnitudes of our peak strain predictions; however, the effects of activation and endomysium stiffness would remain qualitatively similar to our findings.
The models presented here could ultimately be used to predict the likelihood of injury based on macroscopic in vivo strains. Previous studies have reported thresholds for overall fiber stretch resulting in rupture. For example, Law et al. (1995) reported an overall fiber strain of 135% prior to failure in stretch to failure of whole muscles, while Friden and Lieber (2003) reported overall strains of approximately 250% prior to failure in stretch to failure of single fibers. However as our models demonstrate, local sarcomere strains may be much higher than the overall strains reported at failure. For example, Tidball et al. (1993) reported sarcomere strains of > 200% near the site of lesion in stretch to failure of whole muscles. However, more rigorous experimental investigations of the thresholds for local sarcomere strain failure are needed in order to use the models described here to precisely predict the conditions for injury.
The models developed here provide a new framework for modeling the fiber-level structure and mechanics of the MTJ. The model predictions illuminate the complexity of the mechanics of the MTJ, and they demonstrate that the structural and mechanical details of the MTJ affect local micro-scale fiber strains and fiber injury susceptibility.
Supplementary Material
Supplementary data associated with this article can be found in the online version at doi:10.1016/j.jbiomech.2011.08.025.
Acknowledgments
We are grateful to Julie Choisne, Ramsey Kamar, Charles Haggart, and Shayn Peirce-Cottler. Funding for this work was provided by NIH Grant no. R01 AR 056201, the Funds for Excellence in Science and Technology at the University Virginia, NSF Grant 0734262, and the National Skeletal Muscle Research Center at UC San Diego.
Footnotes
Conflict of interest statement: None of the authors have any conflict of interest to report in this research.
References
- Armstrong RB, Ogilvie RW, Schwane JA. Eccentric exercise-induced injury to rat skeletal muscle. Journal of Applied Physiology. 1983;54:80–93. doi: 10.1152/jappl.1983.54.1.80. [DOI] [PubMed] [Google Scholar]
- Barrett B. The length and mode of termination of individual muscle fibres in the human sartorius and posterior femoral muscles. Acta Anatomica. 1962;48:242–257. doi: 10.1159/000141843. [DOI] [PubMed] [Google Scholar]
- Blemker SS, Pinsky PM, Delp SL. A 3D model of muscle reveals the causes of nonuniform strains in the biceps brachii. Journal of Biomechanics. 2005;38:657–665. doi: 10.1016/j.jbiomech.2004.04.009. [DOI] [PubMed] [Google Scholar]
- Brooks SV, Zerba E, Faulkner JA. Injury to muscle fibres after single stretches of passive and maximally stimulated muscles in mice. The Journal of Physiology. 1995;488(Pt2):459–469. doi: 10.1113/jphysiol.1995.sp020980. [DOI] [PMC free article] [PubMed] [Google Scholar]
- Criscione JC, Douglas AS, Hunter WC. Physically based strain invariant set for materials exhibiting transversely isotropic behavior. Journal of the Mechanics and Physics of Solids. 2001;49:871–897. [Google Scholar]
- De Smet AA, Best TM. MR imaging of the distribution and location of acute hamstring injuries in athletes. American Journal of Roentgenology. 2000;174:393–399. doi: 10.2214/ajr.174.2.1740393. [DOI] [PubMed] [Google Scholar]
- Dvorak GJ, Benveniste Y. On transformation strains and uniform fields in multiphase elastic media. Proceedings: Mathematical and Physical Sciences. 1992;437:291–310. [Google Scholar]
- Eisenberg BR, Milton RL. Muscle fiber termination at the tendon in the frog's sartorius: a stereological study. The American Journal of Anatomy. 1984;171:273–284. doi: 10.1002/aja.1001710304. [DOI] [PubMed] [Google Scholar]
- Friden J, Lieber RL. Spastic muscle cells are shorter and stiffer than normal cells. Muscle & Nerve. 2003;27:157–164. doi: 10.1002/mus.10247. [DOI] [PubMed] [Google Scholar]
- Garrett WE, Jr, Rich FR, Nikolaou PK, Vogler JB., 3rd Computed tomography of hamstring muscle strains. Medicine and Science in Sports and Exercise. 1989;21:506–514. [PubMed] [Google Scholar]
- Gollapudi SK, Lin DC. Experimental determination of sarcomere force–length relationship in type-I human skeletal muscle fibers. Journal of Biomechanics. 2009;42:2011–2016. doi: 10.1016/j.jbiomech.2009.06.013. [DOI] [PubMed] [Google Scholar]
- Huxley AF, Peachey LD. The maximum length for contraction in vertebrate straiated muscle. The Journal of Physiology. 1961;156:150–165. doi: 10.1113/jphysiol.1961.sp006665. [DOI] [PMC free article] [PubMed] [Google Scholar]
- Ibraghimov-Beskrovnaya O, Ervasti JM, Leveille CJ, Slaughter CA, Sernett SW, Campbell KP. Primary structure of dystrophin-associated glycoproteins linking dystrophin to the extracellular matrix. Nature. 1992;355:696–702. doi: 10.1038/355696a0. [DOI] [PubMed] [Google Scholar]
- Janssen PM, Lehnart SE, Prestle J, Lynker JC, Salfeld P, Just H, Hasenfuss G. The trabecula culture system: a novel technique to study contractile parameters over a multiday time period. The American Journal of Physiology. 1998;274:H1481–H1488. doi: 10.1152/ajpheart.1998.274.5.H1481. [DOI] [PubMed] [Google Scholar]
- Law DJ, Caputo A, Tidball JG. Site and mechanics of failure in normal and dystrophin-deficient skeletal muscle. Muscle & Nerve. 1995;18:216–223. doi: 10.1002/mus.880180211. [DOI] [PubMed] [Google Scholar]
- Lieber RL, Friden J. Mechanisms of muscle injury gleaned from animal models. American Journal of Physical Medicine & Rehabilitation—Association of Academic Physiatrists. 2002;81:S70–S79. doi: 10.1097/00002060-200211001-00008. [DOI] [PubMed] [Google Scholar]
- Lieber RL, Woodburn TM, Friden J. Muscle damage induced by eccentric contractions of 25% strain. Journal of Applied Physiology. 1991;70:2498–2507. doi: 10.1152/jappl.1991.70.6.2498. [DOI] [PubMed] [Google Scholar]
- Lieber RL, Friden J. Morphologic and mechanical basis of delayed-onset muscle soreness. Journal of the American Academy of Orthopaedic Surgeons. 2002;10:67–73. [PubMed] [Google Scholar]
- Lieber RL, Runesson E, Einarsson F, Fridén J. Inferior mechanical properties of spastic muscle bundles due to hypertrophic but compromised extracellular matrix material. Muscle & Nerve. 2003;28:464–471. doi: 10.1002/mus.10446. [DOI] [PubMed] [Google Scholar]
- Lynch GS, Rafael JA, Chamberlain JS, Faulkner JA. Contraction-induced injury to single permeabilized muscle fibers from mdx, transgenic mdx, and control mice. AJP—Cell Physiology. 2000;279:C1290–C1294. doi: 10.1152/ajpcell.2000.279.4.C1290. [DOI] [PubMed] [Google Scholar]
- Macpherson PC, Dennis RG, Faulkner JA. Sarcomere dynamics and contraction-induced injury to maximally activated single muscle fibres from soleus muscles of rats. The Journal of Physiology. 1997;500(Pt 2):523–533. doi: 10.1113/jphysiol.1997.sp022038. [DOI] [PMC free article] [PubMed] [Google Scholar]
- Morgan DL, Allen DG. Early events in stretch-induced muscle damage. Journal of Applied Physiology. 1999;87:2007–2015. doi: 10.1152/jappl.1999.87.6.2007. [DOI] [PubMed] [Google Scholar]
- Newham DJ, McPhail G, Mills KR, Edwards RHT. Ultrastructural changes after concentric and eccentric contractions of human muscle. Journal of the Neurological Sciences. 1983;61:109–122. doi: 10.1016/0022-510x(83)90058-8. [DOI] [PubMed] [Google Scholar]
- Nikolaou PK, Macdonald BL, Glisson RR, Seaber AV, Garrett WE., Jr Biomechanical and histological evaluation of muscle after controlled strain injury. The American Journal of Sports Medicine. 1987;15:9–14. doi: 10.1177/036354658701500102. [DOI] [PubMed] [Google Scholar]
- Noonan TJ, Garrett WE., Jr Injuries at the myotendinous junction. Clinics in Sports Medicine. 1992;11:783–806. [PubMed] [Google Scholar]
- Pasternak C, Wong S, Elson E. Mechanical function of dystrophin in muscle cells. The Journal of Cell Biology. 1995;128:355–361. doi: 10.1083/jcb.128.3.355. [DOI] [PMC free article] [PubMed] [Google Scholar]
- Petrof BJ. The molecular basis of activity-induced muscle injury in Duchenne muscular dystrophy. Molecular and Cellular Biochemistry. 1998;179:111–123. doi: 10.1023/a:1006812004945. [DOI] [PubMed] [Google Scholar]
- Puso MA. NIKE3D: A Nonlinear, Implicit, Three-Dimensional Finite Element Code for Solid and Structural Mechanics User's Manual. UCRL-MA-10526 2006 [Google Scholar]
- Rehorn MR, Blemker SS. The effects of aponeurosis geometry on strain injury susceptibility explored with a 3D muscle model. Journal of Biomechanics. 2010;43:2574–2581. doi: 10.1016/j.jbiomech.2010.05.011. [DOI] [PMC free article] [PubMed] [Google Scholar]
- Schwane JA, Armstrong RB. Effect of training on skeletal muscle injury from downhill running in rats. Journal of Applied Physiology. 1983;55:969–975. doi: 10.1152/jappl.1983.55.3.969. [DOI] [PubMed] [Google Scholar]
- Silder A, Heiderscheit BC, Thelen DG, Enright T, Tuite MJ. MR observations of long-term musculotendon remodeling following a hamstring strain injury. Skeletal Radiology. 2008;37:1101–1109. doi: 10.1007/s00256-008-0546-0. [DOI] [PMC free article] [PubMed] [Google Scholar]
- Tidball JG, Salem G, Zernicke R. Site and mechanical conditions for failure of skeletal muscle in experimental strain injuries. Journal of Applied Physiology (Bethesda, Md: 1985) 1993;74:1280–1286. doi: 10.1152/jappl.1993.74.3.1280. [DOI] [PubMed] [Google Scholar]
- Zajac FE. Muscle and tendon: properties, models, scaling, and application to biomechanics and motor control. Critical Reviews in Biomedical Engineering. 1989;17:359–411. [PubMed] [Google Scholar]
Associated Data
This section collects any data citations, data availability statements, or supplementary materials included in this article.
Supplementary Materials
Supplementary data associated with this article can be found in the online version at doi:10.1016/j.jbiomech.2011.08.025.


