

Abstract
Tourette syndrome (TS) is a neuropsychiatric disorder with childhood onset characterized by motor and phonic tics. Obsessive-compulsive disorder (OCD) is often concomitant with TS. Dysfunctional tonic and phasic dopamine (DA) and serotonin (5-HT) metabolism may play a role in the pathophysiology of TS. We simultaneously measured the density, affinity, and brain distribution of dopamine D2 receptors (D2-Rs), dopamine transporter (DAT) binding potential (BP), and amphetamine (AMP)-induced dopamine release (DArel) in 14 adults with TS and 10 normal adult controls. We also measured the brain distribution and BP of serotonin 5-HT2A receptors (5-HT2AR), and serotonin transporter (SERT) BP, in 11 subjects with TS and 10 normal control subjects.
As compared with controls, DArel was significantly increased in the ventral striatum among subjects with TS. Adults with TS+OCD exhibited a significant D2-R increase in left ventral striatum. SERT binding potential in midbrain and caudate/putamen was significantly increased in adults with TS (TS+OCD and TS−OCD). In 3 subjects with TS+OCD, in whom D2-R, 5-HT2AR, and SERT were measured within a 12-month period, there was a weakly significant elevation of DArel and 5-HT2A BP, when compared with TS−OCD subjects and normal controls.
The current study confirms, with a larger sample size and higher resolution PET scanning, our earlier report that elevated DArel is a primary defect in TS (Singer et al, 2002). The finding of decreased SERT BP, and the possible elevation in 5-HT2aR in individuals with TS who had increased DArel, suggest a condition of increased phasic DArel modulated by low 5-HT in concomitant OCD.
INTRODUCTION
Tourette syndrome (TS) is a childhood disorder characterized by motor and phonic tics that must be present for at least one year prior to diagnosis (American Psychiatric Association, 2004). TS can be diagnosed and differentiated from other disorders by the history obtained from the patient and the family, and the carefully structured observation of the patient both at rest and with stimulation (Scahill, et al, 2006). People with TS often have a family history of tics, obsessions, compulsions, attention problems, hyperactivity, and other psychiatric disorders (Scahill, et al, 2006; Murray, 2006). While the symptoms of TS are often exacerbated in adolescence, they may subside in adulthood; however, subsets of adults with TS continue to exhibit the symptoms of the syndrome.
We hypothesize that dysfunctional metabolism of the neurotransmitters dopamine (DA) and serotonin (5-HT) plays a role in the development and maintenance of TS (Wong et al, 2005). Multiple anecdotal reports of beneficial effects of dopamine antagonists (Singer, 2001), and nicotinic (Shytle et al, 2000; Silver et al, 2000) agents in some people with TS suggest that these neurotransmitters are poorly regulated in TS. There is also some anecdotal evidence that serotonin reuptake inhibitors (i.e, fluoxetine) can alleviate symptoms as well (Silverstri, et al, 1994). The benefits of such agents are not uniformly visible, however, and some people with TS report worsening symptoms upon pharmacologic intervention. Consequently, it is necessary to further explore the pathophysiology of TS symptoms in terms of specific and interrelated neurotransmitter systems in order to develop appropriate and more effective novel interventions.
In the present study, we focus on the DA and 5-HT systems. A tonic/phasic imbalance in the DA system may help to explain the DA pathophysiology associated with TS, as has been proposed in schizophrenia (SCZ) (Grace, 1991). In these studies, we used [11C]raclopride (a DA receptor antagonist that competes with endogenous DA for binding to D2 and D3 receptors), and [11C]WIN (a DA transporter (DAT) antagonist), to measure four DA variables: dopamine D2 receptor density (D2 Bmax), dopamine D2 receptor affinity (D2 KD), amphetamine (AMP)-induced DA release (DArel), and DAT binding potential (BP). Consequently, the current study, via measurement of the DA system, is designed to asses the tonic/phasic regulation hypothesis in relation to TS. The tonic/phasic regulation hypothesis asserts that the low level of tonic extracellular DA, released by the action of corticostriatal afferents, down-modulates spike-dependent phasic DArel in TS, via the activation of autoreceptors on DA terminals (Grace, 1995).
A factor adding a layer of complexity to our understanding of TS is the frequent co-morbidity of TS with obsessive-compulsive disorder (OCD), and the multiple serotonergic abnormalities seen in OCD could reflect the presence of dysfunctional 5-HT neurotransmission in TS. In traditional pharmacotherapy, people with TS often respond preferentially to DA antagonists (Singer, 2001), while people with OCD respond mainly to selective serotonin reuptake inhibitors (SSRIs). This variation suggests different pathophysiologies for these disorders; however, it has been reported that mixed serotonergic/dopaminergic agents such as risperidone help alleviate symptoms of TS and OCD (McDougle, 2000; Pfanner, 2000). Therefore, in this study, we also evaluated the BP of serotonin 5-HT2A receptors (5-HT2ARs), as well as the BP of SERT, using the radiotracers [11C]MCN (a 5-HT2AR antagonist) and [11C]MDL (a SERT antagonist). For people with TS, firm evidence of either a 5-HT/alone or DA/5-HT abnormality would provide support for --or raise questions about-- treatment combinations utilizing DA and 5-HT antagonism, such as exerted by atypical neuroleptics.
METHODS
Participants
Healthy adult control subjects were recruited via advertisements in local newspapers, word-of-mouth, and announcements at local universities. Adult subjects with TS were recruited with the help of local and regional chapters of the Tourette Syndrome Association. All subjects received thorough medical and psychiatric screenings which specifically examined current and prior medications. All subjects were free of neuroleptic, serotonergic, and dopaminergic drugs at the time of PET scanning, and had been treatment-free for a period of at least 6 months prior to the start of the study.
Study procedures were conducted in accordance with the Declaration of Helsinki of 2004. The Institutional Review Board of The Johns Hopkins University School of Medicine approved the studies and the informed consent documents. All participants gave their written informed consent.
Dopamine Study
For the DA study, we recruited and performed PET scans on a total of 14 subjects with TS (12 M, 2 F, age 29 ± 8 (SD) years) and 10 normal controls (6 M, 4 F, age 26 ± 7 (SD) years). Seven of the subjects with TS were treatment naïve, 3 were not currently on medication, and the remaining 4 subjects voluntarily stopped their medication at least 6 months prior to the baseline PET scan.
Serotonin Study
For the 5-HT study, we recruited and performed PET scans on a total of 11 subjects with TS (9 M, 2 F, age 34 ± 9 (SD) years) and 10 normal controls (5 M, 5 F, age 32 ± 8 (SD) years). Eight of the subjects with TS were treatment naïve, 2 were not currently on medication, and the remaining subject voluntarily stopped medication at least 6 months prior to the baseline PET scan.
General Procedures
Participants were enrolled as outpatients in the Division of Nuclear Medicine of Johns Hopkins Hospital. Participants were required to abstain from use of all psychoactive drugs, caffeine, alcohol, and nicotine for the days of the PET scans. All subjects underwent medical history and physical examinations which included full toxicology and blood workups. In the female participants, urine pregnancy tests were given before and during study participation, and all the results of all pregnancy tests were negative. Subjects also underwent 12-lead electrocardiography (ECG).
For Tourette’s subjects, we used the DSM-IV-TM (American Psychiatric Association, 2004) as the inclusion criteria. We also required that all subjects be drug naïve or drug free for at least three months. Exclusion criteria included any marked axis I psychiatric disorder, order than TS with or without OCD, as well as any movement disorder other than those resulting from TS or OCD.
Neurocognitive Battery and Neuropsychiatric Assessments
All subjects received an evaluation of overall neurocognitive functioning during screening, and further neuropsychiatric assessments during a separate study day. Neurocognitive testing was conducted in a quiet testing room. The complete battery was designed to assess intelligence, executive functioning, word and design fluency, new learning/memory and visual constructional ability.
A comprehensive family history, with emphasis on tics and neuropsychiatric problems including OCD, was also obtained on a separate day from the PET scans. OCD was diagnosed according to the Structured Clinical Interview for DSM-IV Axis I Disorders (SCID-I), Clinical Version. The presence and severity of obsessions and compulsions were measured by the Yale Brown Obsessive-Compulsive Scale (Y-BOCS) (Goodman et al, 1989a,b). The diagnosis of adult Attention Deficit and Hyperactivity Disorder (ADHD) was determined by the Clinical Global Impression Scale for Attention Deficit Disorder (Guy, 1976) and the Wender Utah Rating Scale (WURS) (Wender, 1995). In addition, the Yale Global Tic Severity Scale (YGTSS) (Leckman et al, 1989) and the Brief Psychiatric Rating Scale (BPRS) (Overall and Gorham, 1962) were administered to 14 subjects with TS (12 M, 2 F, age 29 ± 8 years) and 10 normal controls (6 M, 4 F, age 26 ± 7 years) for the DA study, and 11 subjects with TS (9 M, 2 F, age 34 ± 9 years) and 10 normal controls (5M, 5 F, age 32 ± 8 years) for the 5-HT study.
Dopamine Measurements
In order to obtain measurements of DA dynamics, including DArel, D2 Bmax, and D2 KD, subjects were scanned over two study days, and received two PET scans each day according to the following procedure: Day 1-Scan 1: [11C]raclopride: pre-treatment: intravenous (IV) saline bolus (5 cc over 3 min at 5-min pre-injection). Day 1-Scan 2: [11C]raclopride: pre-treatment: IV AMP bolus (0.3 mg/kg over 3 min at 5-min pre-injection). Day 2-Scan 3 (within 7 days post-Day 1): [11C] WIN35,428 ([11C]WIN): intravenous push bolus. Day 2- Scan 4: [11C]raclopride (low specific activity): intravenous push bolus.
On Day 1, the specific activity of [11C]raclopride for Scan 1 and Scan 2 averaged 10,000–15,000 mCi/μmol, mass of 1.0 μg, with a dose of approximately 20 mCi. On Day 2, the specific activity of [11C]WIN averaged 10,000–15,000 mCi/μmol, mass dose of 1.0 μg, with a dose of approximately 20 mCi. The low specific activity of [11C]raclopride on Day 2 averaged 1000–1500 mCi/μmol, with a mass of 300–600 μg. Thus, Scan 1 and Scan 2 measured DArel, Scan 3 measured the binding potential of WIN for DAT, and Scan 1 and Scan 4 yielded the D2 Bmax and D2 KD measures.
Serotonin Measurements
In order to obtain measurements of SERT and 5-HT2AR BPs, subjects received two PET scans on the same day. The first scan used the radiotracer [11C]McN5652 (MCN), for SERT, and the second scan used the radiotracer [11C]MDL100907 (MDL) for 5HT2A; each a 95-min PET scan intravenous push bolus with a dose of approximately 20 mCi and high specific activity (>2,000 Ci/mmole).
PET Procedures
For all scans, the same general PET and image analysis procedures were followed. For co-registration with the PET data to enhance anatomical definitions, each participant received a volumetric magnetic resonance imaging (MRI) scan with analysis of the caudate, putamen and ventral striatum to ensure that regional brain volumetric differences did not account for any of the PET analysis results. The MRI data were acquired using a spoiled GRASS (Gradient Recalled Acquisition in Steady State) (SPGR) sequence on a GE 1.5 T Signa Camera (GE Healthcare, Chalfont St. Giles, UK). To minimize movement during the MRI and PET scans, each participant was custom-fitted with a thermoplastic facemask.
Upon arrival to the PET center, a venous catheter was placed in the antecubital vein for injection of the radiotracer. [11C]raclopride (Ehrin et al, 1985) or [11C]WIN (Wong et al, 1993), produced at the Johns Hopkins Hospital Biomedical Cyclotron, was injected at the start of PET scanning. An additional arterial catheter was placed in the opposite arm as the venous line for blood sampling during all scans. All subjects received ECG, blood pressure, and pulse rate monitoring during each scan.
PET images were obtained on a GE Advance PET camera (GE Healthcare, Chalfont St. Giles, UK), which simultaneously acquires 35 slices, with an axial field of view of 15.2 cm. Each PET session consisted of a 90-min scan, with 32 frames of 15 sec to 5 min each, according to the following protocol: four 15-sec frames, four 30-sec frames, three 1-min frames, two 2-min frames, five 4-min frames, twelve 5-min frames. Data were acquired in the three dimensional mode. The images were reconstructed using filtered back-projection with a ramp filter (image size 128×128, pixel size 2×2 mm2, inter-slice spacing 4.25 mm), resulting in a spatial resolution of 5.5 mm × 5.5 mm × 4.25 mm full-width-at-half-maximum at the center of the field of view. Data in the decay-corrected, reconstructed, dynamic images were expressed in units of concentration (μCi/mL).
Image Analysis
For all PET scans, the initial primary outcome was BP, representing a ratio of receptor density divided by receptor affinity (Bmax/KD) (Logan et al, 1996). Thus, for the three [11C]raclopride scans (Scans 1, 2 and 4), BP represents the Bmax/KD of raclopride for D2/D3 receptors. For the [11C]WIN scan (Scan 3), BP represents the Bmax/KD for DAT. Intrasynaptic DArel was defined as the displacement of [11C]raclopride by endogenous DA, and was calculated as the percent change in BP for the post-AMP challenge [11C]raclopride scan (Scan 2) and the baseline BP measured in the post-saline [11C]raclopride scan (Scan 1). The D2 Bmax was calculated from the BP at high (Scan 1) and low (Scan 4) specific activity [11C]raclopride for absolute receptor density, using two methods: True Receptor Equilibrium Measures of Binding and Ligand Exchange (TREMBLE; Sölling et al, 1997), and the Transient Equilibrium Method (Farde et al, 1989). To determine BP, volumes of interest (VOIs) were drawn for subdivisions of the striatum and used to extract time activity curves, as described below.
VOI Definition
VOIs were manually defined for the caudate nucleus, putamen, and cerebellum on each individual’s MRI. The volumes of these VOIs were measured (mL) to test for differences in brain volumetrics between patient groups. The striatal VOIs were divided into five functional divisions (Martinez et al, 2003b), using the anatomical guidance provided by postmortem studies of human brain (Karachi, 2002) to overcome the fact that the subdivisions were not identifiable on MRI alone. Ventral striatum was separated from the other striatal VOIs on each coronal image after reorienting the MRI such that the anterior/posterior commissural plane (AC/PC) was horizontal. For this procedure, a line was placed on each coronal image that was perpendicular to the bisector of the internal capsule and passed through the lower corner of the lateral ventricle. (Baumann et al, 1999) We defined the ventral striatum as the portions of striatal VOIs that were below the line. The caudate and putamen VOIs were classified to respective anterior and posterior subdivisions by the AC/PC plane in the reoriented MRI (Baumann et al, 1999; Karachi et al, 2002; Martinez et al, 2003a). Thus, we sampled 10 subdivisions of the striatum: anterior and posterior regions of both the putamen and the caudate nucleus, and the ventral striatum, each in both the left and right hemispheres. The cerebellum VOI was used as a reference region.
The VOIs were transferred to PET space according to MRI-to-PET co-registration parameters using the mutual information theory as implemented in SPM2. Time-activity profiles of regions were obtained by applying the VOIs to individual PET frames after correcting for movements of the head during PET scans (Meyer et al, 1999).
Mathematical Modeling
BP. Bmax, and DArel for [11C]raclopride
We employed a simplified reference tissue approach (SRTM) (Lammerstma and Hume, 1996), as modified to a linear operational equation (Ichise et al, 2003), and a reference tissue graphical analysis (RTGA) (Logan et al, 1996a). BP was also calculated for [11C]raclopride using TREMBLE which calculates the BP at the peak bound/free ratio (Sölling et al, 1997). D2-R occupancy due to IV AMP challenge was calculated as DArel =DPB/PBo and expressed as a percentage. TREMBLE (Wong et al, 1998), as well as TEM (Transient Equilibrium Method) (Farde, et al, 1989) was used to calculate D2 Bmax and KD.
The TEM analysis was performed as follows: it was assumed that the radioactivity concentration of bound ligand at time t was obtained by A(t) minus R(t) where A(t) and R(t) were the radioactivity concentrations at time t for the target and reference regions. Transient equilibrium (dB(t)/dt=0) was assumed when B(t) reached the maximum (=t0). We predicted A(t) using the multi-linear reference tissue method with 2 parameters (MRTM2; Ichise et al, 2002) to reduce noise in measured A(t). The boud-free ratio (B(t) over R(t) at t0) was plotted against B(t0) for low and high specific radioactivity experiments (the Eddie-Hofstee plot) to obtain D2 Bmax as the y intercept and −KD as slope of the line connecting the two points.
BP for [11C]WIN (DAT BP)
We applied a one-vascular, two-tissue compartmental model for [11C]WIN (Wong et al, 1993), using metabolite-corrected plasma radioactivity data, to obtain the BP of DAT.
5-HT Modeling Methods
The parametric imaging approaches (Zhou et al, 2002a,b; Zhou et al, 2003a; Zhou et al, 2004), including linear and non-linear least square fitting with spatial constraint, were used to evaluate voxel-wise kinetics for the MCN, and MDL dynamic PETs. VOIs were extracted as described above. Parametric images of K1, DV, and BP were generated for VOI and voxel statistical analysis using SPM (Zhou et al, 2004; Zhou et al, 2002b; Zhou et al, 2003b).
Statistical Analysis
Statistical analysis of all PET parameters for 5-HT and DA measures (Bmax, KD, BP) and DArel, DAT, SERT: means and standard deviations (SD) were calculated for binding potential and change in receptor occupancy for each striatal VOI for both controls and all patient groups. Since the cerebellum VOI was the reference region, it was not included in the statistical analysis. To test for between-groups differences, we used a robust linear regression model, where group status (i.e., control vs. TS) was encoded using dummy variables, and set as the independent variable. The PET parameters were set as the dependent variables, with age as a covariate.
To test for correlations between PET parameters and scores from psychiatric scales, individual values for those variables were incorporated into a linear regression. All statistical analyses were performed using Stata 8 (StataCorpLP, College Station, Texas.)
RESULTS
Dopamine hypotheses
Based on previous findings of elevation in DArel (Singer, et al, 2000) and Bmax (Wong, et al, 1997), we hypothesized that the TS groups would continue to show elevations of dopamine parameters in striatal regions. Changes in dopamine parameters were tested at each striatal VOI using robust linear regression as described above.
D2 Receptors (D2-R)
Twelve subjects with TS (10 M, 2 F, age: 31 ± 8.9) and 3 normal control subjects (1 M, 2 F, age: 24 ± 2.5) completed Scans 1–4, and results were compared across three variables describing the D2-R system: BP, KD, and Bmax, using TREMBLE analysis. Although a small control group, only subjects whose plasma radioactivity and metabolites were available to construct time-activity curves (TACs) were used (requires insertion of an arterial catheter for blood collection).
Baseline BP was not different between subject groups in any brain region (p>0.05). With the TEM method used for modeling, subjects with TS showed lower Bmax values than normal controls in the left anterior putamen (p=0.02). There was also a weakly significant decrease in the right anterior putamen (p=0.07), and right posterior putamen (p=0.06). Overall, TS subjects showed a uniform decrease in Bmax across all brain regions as compared to controls. With KD, we also saw a significant decrease in TS subjects as compared to control in the left and right anterior putamen (p=0.03). A decrease in KD is also seen in the left ventral striatum, but at weaker significance (p=0.09).
DA Release (DArel), a Measure of Receptor Occupancy
The group comparison shows a robust increase of DArel in the right ventral striatum (p<0.05) in 14 subjects with TS (12 M, 2 F, age 29 ± 8 years), as compared with 10 healthy controls (6 M, 4 F, age 26 ± 7 years) (Fig. 2). A weakly significant increase in DArel was also seen in left ventral striatum of subjects with TS, when compared with controls (p=0.06). DArel in the TS group was nearly double that of the control group.
Figure 2. DArel in Subjects with Tourette Syndrome and Normal Controls by the SRTM and RTGA Methods.
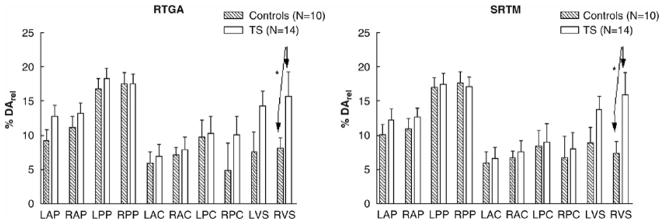
Dopamine release (DArel) is calculated using 2 mathematical modeling methods: the simplified reference tissue method (SRTM) (Lammerstma and Hume, 1996), and the reference tissue graphical analysis (RTGA) (Logan et al, 1996). Both methods demonstrate a significant elevation (approximately 50%) of DArel in the left and right ventral striatum, in subjects with Tourette syndrome (TS), as compared with normal controls. (Brackets indicate significant contrasts; p < 0.05.)
DA Transporter (DAT)
DAT BP was obtained for 11 subjects with TS (9 M, 2 F, age 32 ± 8 years) and 5 normal controls (3 M, 2 F, age 25 ± 4 years), and was measured using data from the WIN scan (Scan 3). No significant differences were seen in DAT BP between subjects with TS and normal controls in any brain region (p>0.05) (Fig. 3).
Figure 3. DAT Binding Potential in Subjects with Tourette Syndrome and Healthy Controls.
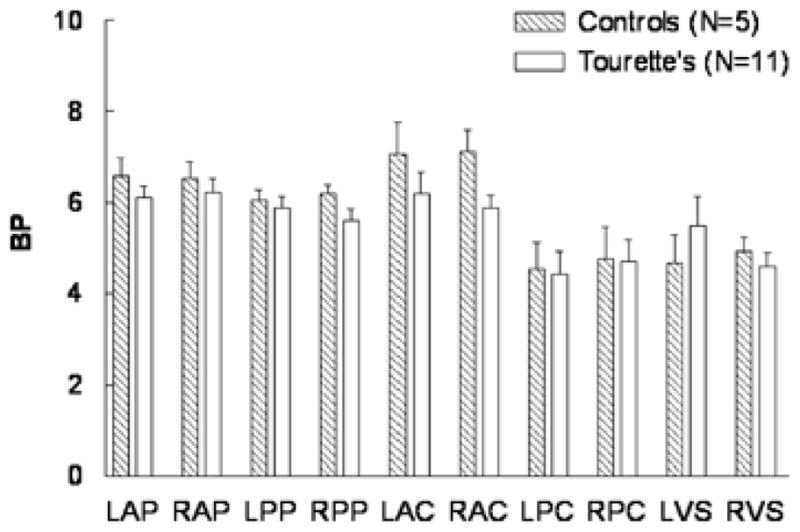
No significant differences were seen in measurements of dopamine transporter (DAT) binding potential between subjects with Tourette syndrome (TS), as compared with normal controls, in any brain region (p>0.05).
5-HT Measures
BPs for both 5-HT2A and SERT were compared between TS and control groups, as well as among the TS group subsets (TS+OCD (n=9); TS−OCD (n=2)) and normal controls (n=9) (Fig. 4). Significant reductions were seen in SERT BP in the midbrain, caudate, and putamen of subjects with TS, when compared with normal controls (p<0.05) (Fig. 4-A). When SERT BP was compared among the TS+OCD, TS−OCD, and control groups, significant decreases were seen in TS+OCD (p<0.05) and TS−OCD (p< 0.05), as compared with normal controls in the midbrain (Fig. 4-B).
Figure 4. SERT and 5HT2AR Binding Potentials (BPs) in TS+OCD and TS−OCD Subjects, and Normal Controls.

Panel A: Significant reductions (p < 0.05) were seen in serotonin transporter (SERT) BP in the midbrain, caudate, and putamen of subjects with Tourette syndrome (TS), when compared with normal controls. Panel C: No significant differences were seen in serotonin receptor (5-HT2AR) BP between TS and normal controls (p > 0.05). Panel B: When grouped by OCD status, the TS+OCD groups displayed significant decreases in SERT BP in midbrain, as compared with normal controls (p < 0.05). Panel D: When grouped by OCD status, TS+OCD subjects showed slightly higher 5-HT2A binding, but these results were not significant (p>0.1).
No significant differences were noted in 5-HT2A BP in any brain region when comparing the TS and control groups (Fig. 4-C), but weakly significant elevations in 5-HT2A BP were observed in TS+OCD versus TS−OCD (p=0.07), and TS+OCD versus normal controls (p=0.08), in pre-frontal, temporal and cingulate cortices (Fig. 4-D).
Neuropsychological Assesments
The following correlations between DArel (as measured by RTGA) and neuropsychological assessments in subjects with TS were significant and of interest. DArel in the left ventral striatum was significantly and positively correlated with interpersonal sensitivity t-score (r=0.6, p= 0.038). When the same correlation analysis was applied to DArel measurements using SRTM, the results were marginally significant, but still showed a positive correlation (r=0.5, p=0.06).
Neuropsychiatric Assessments
A brief summary of the neuropsychiatric assessments is presented by study (DA and 5-HT) in Table 1, including results of the Brief Psychiatric Rating Scale (BPRS), the Yale Global Tic Severity Scale (YGTSS), and the Yale Brown Obsessive-Compulsive Scale (Y-BOCS), and the Wender Utah Rating Scale (WURS).
Table 1.
Summary of Clinical Evaluations of Subjects with TS and Healthy Controls
| YGTSS | |||||||
|---|---|---|---|---|---|---|---|
| Study | Group | BPRS | Motor tics | Phonic tics | Impairment | Y-BOCS | |
| Range | (20, 140) | (0, 25) | (0, 25) | (0, 50) | (0, 40) | ||
| Dopamine | Controls | Mean | 21.89 | 7.14 | 5 | 8.14 | 5.57 |
| (N=10) | SD | 1.01 | 9.73 | 8.66 | 13.98 | 7.79 | |
| TS subjects | Mean | 23.19 | 14.55 | 11 | 24.72 | 12 | |
| (N=14) | SD | 5.29 | 7.73 | 7.77 | 16.72 | 9.58 | |
| Serotonin | Controls | Mean | 22.24 | 4.71 | 2.14 | 8.29 | 1.38 |
| (N=10) | SD | 4.19 | 8.18 | 5.67 | 14.26 | 3.89 | |
| TS subjects | Mean | 23.34 | 13.8 | 9.5 | 20.7 | 16.83 | |
| (N=11) | SD | 2.78 | 8.01 | 6.85 | 17.32 | 6.79 | |
BPRS, brief psychiatric rating Scale (Overall and Gorham, 1962); TS, Tourette syndrome; Y-BOCS, Yale–Brown Obsessive Compulsive Scale; YGTSS, Yale Global Tic Severity Scale.
Motor tics, phonic tics, and impairment were measured using the YGTSS (Leckman et al, 1989). The presence and severity of obsessions and compulsions were measured by the Y-BOCS (Goodman et al, 1989a, 1989b). Higher scores indicate worsening phenotype.
MRI Findings
Volumetric MRI changes have been noted in TS, in that children with TS have shown to have a predominance of the right putamen over normal controls (Singer, 1993). Thus, in the current study, the putamen, caudate, and ventral striatum were assessed in 14 subjects with TS and 8 normal controls to ensure that volumetric disparities did not account for any group differences observed in the PET results. However, no significant differences in regional brain volumes were found between patient groups (p> 0.05). In addition, no significant left-right asymmetries were observed in either population (p> 0.05) (data not shown).
LIMITATIONS
Use of McN to measure SERT
An increasing number of publications have used the tracer DASB to measure SERT, because DASB does have higher contrast than McN. (McAnn, et al, 2005). However, we are not aware of any published studies showing any clinical advantage of DASB over MCN. While the increased contrast with DASB has led to an increase in the number of studies with DASB vs MCN, MCN is as well suited to display the SERT and its losses as DASB.
Furthermore, we have published two papers (McAnn, et al, 2005; Szabo, et al, 2002) in which we compared the kinetics of the two tracers including arterial blood collection and compartmental modeling. In a preclinical study on baboons treated with MDMA, both radioligands demonstrated reduced binding in all brain regions and the correlation between them was very high. Also in a clinical paper on MDMA users and matched control subjects the correlation between the two tracers was high. The human study included MDMA users and controls. The correlation between the specific binding component of the distribution volume (DVsp) of 15 brain regions demonstrated high correlation between MCN and DASB in both controls and users. (McAnn, et al, 2005).
Statistical Justification
Even though we performed several analyses on the given data, we did not use a correction for multiple comparisons. While multiple comparison corrections apply to multiple tests on a single dependent variable, we performed single tests on multiple, independent endpoints. That is, each measurement of DAR, Kd, etc., in each brain region can be considered an independent experiment. Thus, we used a robust linear regression, treating each derived measurement in each brain region as an independent measurement.
DISCUSSION
Abnormalities in the DA system have been implicated previously in the pathophysiology of TS. Our own pilot results with 7 subjects with TS and 5 age-matched normal controls showed an increased DArel in subjects with TS (Singer et al, 2002). We have confirmed and extended this initial result in our current study with a doubling of the sample size, and with the use of higher-resolution tomography and multiple mathematical modeling methods.
Ever since the original DA hypothesis for TS was proposed (Singer et al, 1982), the underlying dopaminergic deficit leading to TS dysfunction has eluded investigators. Thus, despite the many attempts to characterize TS, including the measurement of homovanilic acid (HVA) levels in post-mortem studies(Butler et al, 1979; Singer et al, 1982), it appears that the most direct evidence has been the strikingly consistent increase in AMP-induced DArel that was first shown via PET imaging in the pilot study mentioned above (Singer, et al. 2002). Improved tomographic resolution has allowed us to examine specific subdivisions of the striatum and, in the current study, we have observed significantly elevated AMP-induced DArel in the ventral striatum. Indeed, this elevation is more consistent than that reported for AMP-induced DArel in SCZ (Gjedde & Wong, 1998; Laruelle et al, 1996).
Origin of Increased DA Release: The Tonic-phasic Dopamine model
The model of the tonic-phasic balance in the DA system as a homeostatic mechanism may also explain the DA pathology in TS. Disruption of the tonic-phasic balance has been proposed to underlie the DA pathophysiology in SCZ (Grace, 1991; Grace, 1995) as well as in other neurological disorders, such as TS. This model is based on electrophysiological and neurochemical data, in which two types of DA kinetics exist in postsynaptic targets of the DA system. The long-term or homeostatic mechanism is determined by the tonic “baseline” level of DA, which is in low concentrations, shows slow changes, and exists extracellularly. This is defined primarily as an extrasynaptic measure, from studies using microdialysis and electrophysiological measurements (O’Donnell & Grace, 1994; West & Grace, 2002). Phasic DA is the spike-dependent DArel that occurs primarily into the synapse; it will cause transient, local changes in the vicinity of the synaptic cleft with sufficient simulation (Wightman et al, 2002) or when an uptake blocker is given (e.g., AMP) ( Grace, 1991, 1995). Intrasynaptic DArel produced by spike-dependent DArel or from the use of stimulant challenges such as AMP has been proposed as a surrogate for phasic DA. Therefore DArel excludes the low-level tonic extrasynaptic DA levels that indirectly may influence the phasic release.
Grace (1991, 1995) has proposed that DA is modulated by baseline levels of tonic (extrasynaptic) DA, which may be regulated by neocortical afferents and by DAT. While we found no changes in DAT binding, previous studies (Malison, et al, 1995; Singer, et al, 1991) have reported increased DAT binding, which fits the Grace (1991, 1993) models of dysfunctional regulation of tonic dopamine in TS.
We believe that this type of functional regulatory system is a potential target for the types of disruption that may underlie regulatory disorders of the brain, including disorders such as TS, SCZ, or depression (Grace, 1993). We suggest that in TS, the clinical and imaging evidence is consistent with the decreased tonic regulation of phasic DA response, and that this leads to a hyper-responsive spike-dependent DA-releasing system and subsequent pathological states. This increased release, coupled with other yet-to-be-determined factors, may account for the motor and vocal tic activity of TS. Another consequence of the chronically lower tonic DA is that it may explain presynaptic up-regulation of enzymes such as elevated DOPA decarboxylase (DDC) and other precursors of DA; this is apparently true in SCZ (Reith, et al, 1994) and perhaps in TS as well (Ernst et al, 1999).
Another potential factor that could contribute to the increase in DA release observed here would be an increase in the DA innervation. Thus, a simulation of dopamine dynamics with increased innervation (i.e., increased levels of type 2 vesicular monoamine transporter (VMAT2)) using a model from Gjedde et al (2006) has projected that increased VMAT2 could contribute to increased synaptic dopamine. This is consistent with previous work by Albin, et al (2003) who reported small increases in the binding of the VMAT2 ligand [11C]dihydrotetrabenazine (DTBZ) among TS patients when compared to controls. In their study, Albin’s group saw a significant increase in DTBZ binding (using voxel-by-voxel analysis) in right ventral striatum (effect size of 0.55). In our study, we also see a significant increase in occupancy of similar effect size (0.6), but we see this increase bilaterally, in both left and right ventral striatum (with a weaker significance in the left ventral striatum.) The bilateral nature of our result and equivalent effect size suggest that other factors outside of increased innervation play a role in the change of occupancy we see. Therefore, based on our tonic phasic model of TS for DA, we propose one mechanism may be that the low tonic DA release leads to unchecked phasic DArel, as tonic DArel normally inhibits phasic DArel.
5-HT and DA relationships
We were also able to introduce the findings of 5-HT2AR and SERT measures in TS, which are particularly relevant, because of the high prevalence of co-morbid OCD. We demonstrated SERT reductions in the entire 11-subject TS alone group, as well as in those TS+OCD subjects. Our findings are consistent with those of Muller-Vahl et al (2005); although this was a SPECT study using the tracer BCIT, and other studies others showed increased(Pogarell et al, 1994) or unchanged (Simpson et al, 2003) SERT. However, our study also includes the concomitant 5-HT2AR measure, indicative of a trend for elevations in 5-HT2A BP.
5-HT abnormalities have been hypothesized in TS, although there are conflicting reports regarding 5-HT metabolism (Comings, 1990; Leckman et al, 1984). Some abnormalities that have been hypothesized to be related to co-morbidity with OCD include decreased SERT in platelets (Weizman, 1992).
There is increasing pharmacological evidence implicating the 5-HT system in the pathophysiology of TS, which does not seem to be limited to a co-morbid OCD. Studies have shown that TS patients who are resistant to neuroleptics show a reduction in tic severity with risperidone, which has combined 5-HT2 and D2 antagonism properties (Brun et al, 1996). A negative correlation has been shown between vocal tics and SERT (Heinz et al, 1998). There are few studies on OCD or TS+OCD that clearly delineate the 5-HT abnormalities, and imaging studies have reported inconsistent results. For example, one study demonstrated significantly reduced SERT in midbrain/brainstem in TS subjects with co-morbid OCD (Stengler-Wenzke et al, 2004), while two others showed increased (Pogarell et al, 1994) or unchanged(Simpson et al, 2003) SERT. One study examined SERT in TS and found reductions mainly in TS+OCD (Muller-Vahl et al, 2005). In addition, Haugbol et al (2004) suggest that 5-HT2AR may be elevated in TS.
To these earlier findings, we can now add two additional sets of results from our study. Although in a smaller sub-fraction of our subjects, these results are provocative and give rise to a proposed model of DA and 5HT interactions, which we will describe below.
Effect of TS and OCD on DArel
The initial TS subject group was subdivided into co-morbid subjects (TS + OCD, n=10) and subjects with TS symptoms only (TS−OCD, n=4). A one-way ANOVA showed a significant effect of OCD diagnosis on the DArel values of TS subjects in the ventral striatum (p<0.05). Specifically, post-hoc contrasts showed that DArel was significantly elevated in TS+OCD subjects (p< 0.05), as compared with normal controls (n=8), in the left ventral striatum for both the SRTM and RTGA methods (Fig. 5). DArel in TS−OCD subjects were elevated as compared to controls, but lower than that seen in TS+OCD; however, these contrasts were only weakly significant (p=0.5)
Figure 5. AMP-Induced DArel in TS+OCD and TS−OCD Subjects and Normal Controls, by the SRTM and RTGA Methods.
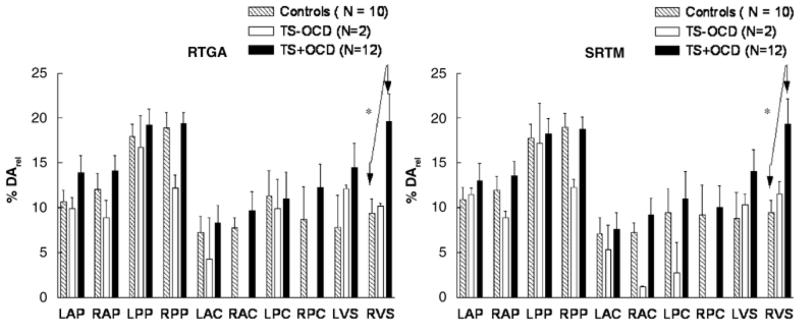
Amphetamine (AMP)-induced dopamine release (DArel) was measured by the simplified reference tissue method (SRTM) (Lammerstma and Hume, 1996), and the reference tissue graphical analysis (RTGA) (Logan et al, 1996) in subjects with Tourette syndrome (TS), with and without obsessive-compulsive disorder (OCD), and normal controls. A significant increase in DArel was seen in TS+OCD, as compared with normal controls (p<0.05). Both analysis methods confirm the concept that AMP-induced DArel in the left ventral striatum is greater in TS+OCD > TS−OCD > normal controls.
More provocative, however, are the results of a subset of our sample, which consists of three TS+OCD subjects who completed the DArel and 5-HT PET scans within one year. Three TS subjects with co-morbid OCD (based on YBOCS scores (Goodman et al, 1989a,b) and SCID diagnoses (First et al, 1994)), completed three DA and two 5-HT PET scans. For these TS+OCD subjects, DArel and 5-HT2A BP were elevated in comparison with TS−OCD subjects (p<0.05), and SERT BP was lower, in comparison with normal controls (p=0.05) (Fig. 6).
Figure 6.
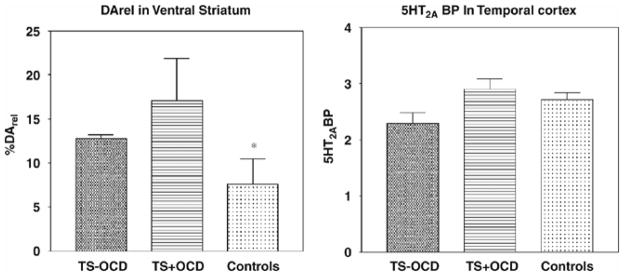
Elevation of AMP-Induced DArel and 5-HT2ARbinding potential (BP) in TS+OCD and TS−OCD Subjects, and Normal Controls
A subset of subjects with Tourette syndrome and OCD (TS+OCD), who completed all dopamine and serotonin PET scans, were compared with the TS−OCD subjects and normal controls from the same study. In the 3 TS+OCD subjects, there was a significant elevation of DArel, as compared with normal controls (p=0.05) (*), and a significant elevation of 5-HT2AR BP, as compared with the TS−OCD subjects (p=0.05) (*).
If the primary deficiency in TS with OCD is 5-HT depletion, then this co-morbid state would produce a compensatory increase in 5-HT2A BP and thereby reduce SERT. By inference from the therapeutic response with SSRIs, which increase intrasynaptic 5-HT and improve OCD symptoms, it is reasonable to speculate that 5-HT2A BP is increased, and SERT would be decreased, in TS+OCD and OCD alone. These findings, combined with the tendency for an upregulation of 5-HT2A BP (though this increase is not significant and p>0.1), gives rise to the following proposed models of DA and 5-HT interaction, where a 5-HT deficit could give rise to an increase in phasic DArel. (Fig. 7 describes the model graphically.)
Figure 7. DA and 5-HT Dynamics in TS+OCD and TS−OCD.

7A: Normal Control) In a healthy brain, 5-HT (1) levels can downregulate DArel (2). In turn, 5-HT can be regulated by SERT (3). The brain can regulate 5HT levels by changing SERT(3) and modulate the impact of 5-HT by altering 5HT2AR (4) levels. These compensatory mechanisms are altered in TS and TS with OCD, as shown below. B) TS patient (No OCD) In a patient with TS, we propose that the primary deficit is diminished 5HT levels (1) resulting in an upregulation of DArel (2). In response to diminished 5HT, SERT levels (2) decrease to compensate, allowing more 5HT to remain in the synapse, the higher intrasynaptic 5-HT in turn leads to a decrease in 5HT2AR numbers (4).
C) TS Patient with OCD
In a patient with both TS and OCD, SERT (1) fails to compensate, and as a result, there are substantially lower levels of 5HT(2). As a result, there is an even greater hyper-responsive DArel (3). Additionally, because of the lowered 5HT, there is a compensatory increase in 5HT2AR number. (4)
5-HT and DA interaction: 5-HT decrease as primary deficit leading to increased DArel
If 5-HT were reduced in the TS+OCD subjects, SERT would be down-regulated to compensate for the intrasynaptic 5-HT deficit, and 5-HT2AR would be up regulated postsynaptically to increase sensitivity for the remaining 5-HT. Similarly, because of the known literature demonstrating the relationship between 5-HT2AR antagonists and DA (Porras, et al, 2004; Schmidt, et al, 1994), this up-regulated 5-HT2AR and decreased 5-HT could further enhance DArel. Although, to date, we have studied three of our subjects at both DA and 5-HT systems (Fig. 5), it does provide further preliminary support for this concept. Thus, our results are consistent with the effects on DArel of concomitant OCD with TS, and may help explain some of the pathophysiology of this co-morbidity (Fig. 6).
5-HT and DA interaction: lack of SERT compensation leading to increased DArel
An alternative explanation is that there is a 5-HT deficit in OCD, but SERT is unable to compensate for this decrease. Thus, the failure of the SERT compensatory mechanism drives intrasynpatic 5-HT even lower, which may lead to even higher DArel. This would be consistent with the trend in our data for TS + OCD subjects to have slightly higher SERT than TS − OCD subjects. In this alternative mechanism, 5-HT normally has a controlling effect on phasic DA, by controlling DA neuron firing directly. Lodge & Grace (2006) have shown that only spontaneously-firing DA neurons can burst-fire (i.e, create a phasic DA response), and that changes in the population of spontaneously-firing DA neurons can modulate the burst (phasic) response. A deficit of 5-HT would lead to an increase in the population of spontaneously-firing neurons. Normally, a down-regulation of SERT could compensate for this increase. However, if SERT is unable to down regulate in TS + OCD, this would cause 5-HT levels to decrease even further and lead to an even higher DArel, via the increase in spontaneously firing DA neurons.
In summary, we have reproduced our initial reported findings (Singer et al, 2002) in a sample of twice the initial size, and have augmented our initial findings by using a higher-resolution tomograph. We have demonstrated SERT reductions consistent with one other published study, but have added evidence of concomitant DArel and 5-HT2AR abnormalities that could serve as the basis for a neurochemical model of DA-5-HT interaction in TS with concomitant OCD. Further understanding of this pathophysiology will be essential in developing potential pharmacologic treatments.
Figure 1. Dopamine Receptor Bmax and KD in Subjects with Tourette Syndrome and Normal Controls.

Receptor density (Bmax)and affinity (KD)were measured using the Transient Equilibrium Method (TEM; Farde et al, 1989), in subjects with TS and normal controls. The TEM method showed significant contrasts for Bmax and KD in the putamen, indicated by the double asterices ventral striatum. We also see weakly significant contrasts in the ventral striatum, indicated by the single asterices.
Table 2.
Study Population Demographics of Subjects with TS and Healthy Controls
| Age | Gender | |||||
|---|---|---|---|---|---|---|
| Study | Measure | Group | N | Mean (SD) | Male | Female |
| Dopamine | DArel | Controls | 10 | 26 (7) | 6 | 4 |
| TS subjects | 14 | 29 (8) | 12 | 2 | ||
| DAT | Controls | 5 | 25 (4) | 3 | 2 | |
| TS subjects | 11 | 32 (8) | 9 | 2 | ||
| D2 receptors | Controls | 7 | 26 (6) | 3 | 4 | |
| TS subjects | 11 | 30 (9) | 9 | 2 | ||
| Neuropsychiatric | Controls | 10 | 26 (7) | 6 | 4 | |
| TS subjects | 14 | 29 (8) | 12 | 2 | ||
| Neurocognitive | Controls | 9 | 25 (6) | 5 | 4 | |
| TS subjects | 14 | 29 (8) | 12 | 2 | ||
| Serotonin | 5-HT2AR and SERT | Controls | 10 | 32 (8) | 5 | 5 |
| TS subjects | 11 | 34 (9) | 9 | 2 | ||
| Neuropsychiatric | Controls | 10 | 32 (8) | 5 | 5 | |
| TS subjects | 11 | 34 (9) | 9 | 2 | ||
| Neurocognitive | Controls | 2 | 22 (1) | 0 | 2 | |
| TS subjects | 7 | 33 (7) | 6 | 1 | ||
The following were evaluated in separate populations for the dopamine and serotonin studies. Dopamine study: amphetamine (AMP)-stimulated dopamine release (DArel); dopamine transporter (DAT) density; the density (Bmax) and affinity (KD) of D2 dopamine receptors. Serotonin study: the density (Bmax) and affinity (KD) of 5-HT2A serotonin receptors, and serotonin transporter (SERT) density. Neuropsychiatric and neurocognitive measures were evaluated in both populations.
TS, Tourette syndrome.
Table 3. Key to Abbreviations of Brain Regions.
Table 3 is provided as a key to the abbreviations for brain regions used in Figures 2, 3, 4, 5, 6 and 7.
| Serotonin study | |||||||||
|---|---|---|---|---|---|---|---|---|---|
| MDBR | PUT | CAU | THAL | PFC | TC | OC | CU | PAC | OFC |
| Brain regions | |||||||||
| Midbrain | Putamen | Caudate | Thalamus | Pre-frontal cortex | Temporal cortex | Occipital cortex | Cingulate | Parietal cortex | Orbito-frontal cortex |
| Dopamine study | |||||||||
| LAP | RAP | LPP | RPP | LAC | RAC | LPC | RPC | LVS | RVS |
| Brain regions | |||||||||
| Left anterior putamen | Right anterior putamen | Left posterior putamen | Right posterior putamen | Left anterior caudate | Right anterior caudate | Left posterior caudate | Right posterior caudate | Left ventral striatum | Right ventral striatum |
Acknowledgments
Grant support: PHS Grants RO1 NS38927, K24 DA00412, RO1 AA12839. HSS currently has grant support from UCB Pharma, and has previously served as a consultant for Penwest and Shire.
We thank the excellent editorial assistance of Melinda Roberson, PhD
Special Thanks To: Johns Hopkins Hospital PET Center and Biomedical Cyclotron staff, and L. Smith, M. Thomas, and K. Warren.
Reference List
- American Psychiatric Association. Diagnostic and statistical manual of mental disorders. 4. American Psychiatric Association; Washington, DC: 2004. text revision (DSM-IV-TM™) [Google Scholar]
- Baumann MH, Danos P, Krell D, Diekmann S, Leschinger A, Stauch R, et al. Reduced volume of limbic system-affiliated basal ganglia in mood disorders: preliminary data from a postmortem study. Journal of Neuropsychiatry & Clinical Neuroscience. 1999;11:71–78. doi: 10.1176/jnp.11.1.71. [DOI] [PubMed] [Google Scholar]
- Brasic JR, Musachio JL, Zhou Y, Cascella N, Nestadt G, Osman M. Neuropsychiatric assessment of [123I]iodo-3-(2 azetidinylmethoxy)pyridine. Movement Disorders. 2001a;16(Suppl 1):S54. [abstract] [Google Scholar]
- Brasic JR, Wong D, Eroglu A. PET scanning in autism spectrum disorders. eMedicine Journal. 2006b;7(2) [Google Scholar]
- Bruun RD, Budman CL. Risperidone as a treatment for Tourette’s syndrome. Journal of Clinical Psychiatry. 1996;57:29–31. [PubMed] [Google Scholar]
- Butler IJ, Koslow SH, Seifert WE, Jr, Caprioli RM, Singer HS. Biogenic amine metabolism in Tourette syndrome. Ann Neurol. 1979;6(1):37–9. doi: 10.1002/ana.410060109. [DOI] [PubMed] [Google Scholar]
- Comings DE. Blood serotonin and tryptophan in Tourette Syndrome. American Journal of Medical Genetics. 1990;36:418–430. doi: 10.1002/ajmg.1320360410. [DOI] [PubMed] [Google Scholar]
- Cunningham VJ, Gunn RN, Matthews JC. Quantification in positron emission tomography for research in pharmacology and drug development. Nuclear Medicine Communications. 2004;25:643–646. doi: 10.1097/01.mnm.0000134330.38536.bc. [DOI] [PubMed] [Google Scholar]
- Ehrin E, Farde L, de Paulis T, Eriksson L, Greitz T, Johnstrom P, Litton JE, Nilsson JL, Sedvall G, Stone-Elander S. Preparation of 11C-labelled Raclopride, a new potent dopamine receptor antagonist: preliminary PET studies of cerebral dopamine receptors in the monkey. International Journal of Applied Radiation & Isotopes. 1985;36(4):269–73. doi: 10.1016/0020-708x(85)90083-3. [DOI] [PubMed] [Google Scholar]
- Ernst M, Zametkin AJ, Jons PH, Matochik JA, Pascualvaca D, Cohen RM. High presynaptic dopaminergic activity in children with Tourette’s disorder. Journal of American Academy of Child and Adolescent Psychiatry. 1999;38:86–94. doi: 10.1097/00004583-199901000-00024. [DOI] [PubMed] [Google Scholar]
- Farde L, Eriksson L, Blomquist G, Halldin C. Kinetic analysis of central [11C]raclopride binding to D2-dopamine receptors studied by PET: a comparison to the equilibrium analysis. Journal of Cerebral Blood Flow and Metabolism. 1989;9:696–70. doi: 10.1038/jcbfm.1989.98. [DOI] [PubMed] [Google Scholar]
- First MB, Spitzer RL, Gibbon M, Williams JBW. Clinician Version (SCID-CV) American Psychiatric Press; Washington, DC: 1994. Structured Clinical Interview for DSM-IV Axis I Disorders. [Google Scholar]
- Gjedde A, Wong DF. No acute effect of amphetamine on dopamine receptor binding potential in healthy subjects or patients in schizophrenia. NeuroImage. 1998;7(4):A44. [abstract] [Google Scholar]
- Goodman WK, Price LH, Rasmussen SA, Mazure C, Fleischmann RL, Hill CL, Heninger GR, Charney DS. The Yale-Brown Obsessive Compulsive Scale. I. Development, use, and reliability. Archives of General Psychiatry. 1989a;46:1006–1011. doi: 10.1001/archpsyc.1989.01810110048007. [DOI] [PubMed] [Google Scholar]
- Goodman WK, Price LH, Rasmussen SA, Mazure C, Delgado P, Heninger GR, Charney DS. The Yale-Brown Obsessive Compulsive Scale. II. Validity. Archives General Psychiatry. 1989b;46:1012–1016. doi: 10.1001/archpsyc.1989.01810110054008. [DOI] [PubMed] [Google Scholar]
- Grace AA. Phasic versus tonic dopamine release and the modulation of dopamine system responsivity: A hypothesis for the etiology of schizophrenia. Neuroscience. 1991;41:1–24. doi: 10.1016/0306-4522(91)90196-u. [DOI] [PubMed] [Google Scholar]
- Grace AA. Cortical regulation of subcortical dopamine systems and its possible relevance to schizophrenia. Journal of Neural Transmission. 1993;91:111–134. doi: 10.1007/BF01245228. [DOI] [PubMed] [Google Scholar]
- Grace AA. The tonic/phasic model of dopamine system regulation: its relevance for understanding how stimulant abuse can alter basal ganglia function. Drug & Alcohol Dependence. 1995;37:111–129. doi: 10.1016/0376-8716(94)01066-t. [DOI] [PubMed] [Google Scholar]
- Guy W. ECDEU assessment manual for psychopharmacology, revised, DHEW Publication No. (ADM) 76–338. U. S. Department of Health, Education, and Welfare; Rockville, Maryland: 1976. pp. 217–222. [Google Scholar]
- Halstead WC. Brain and intelligence. University of Chicago Press; Chicago: 1947. [Google Scholar]
- Heinz A, Knable MB, Wolf SS, Jones DW, Gorey JG, Hyde TM, Weinberger DR. Tourette’s syndrome: [I-123]beta-CIT SPECT correlates of vocal tic severity. Neurology. 1998;51:1069–74. doi: 10.1212/wnl.51.4.1069. [DOI] [PubMed] [Google Scholar]
- Hornykiewicz O. Biochemical aspects of Parkinson’s disease. Neurology. 1998;51(2 Suppl 2):S2–9. doi: 10.1212/wnl.51.2_suppl_2.s2. [DOI] [PubMed] [Google Scholar]
- Ichise M, Toyama H, Innis RB, Carson RE. Strategies to improve neuroreceptor parameter estimation by linear regression analysis. J Cereb Blood Flow Metab. 2002;22:1271–81. doi: 10.1097/01.WCB.0000038000.34930.4E. [DOI] [PubMed] [Google Scholar]
- Ichise M, Liow JS, Lu JQ, Takano A, Model K, Toyama H, Suhara T, Suzuki K, Innis RB, Carson RE. Linearized reference tissue oparametric imaging methods: application to [11C]DASB positron emission tomography studies of the serotonin transporter in human brain. J Cereb Blood Flow Metab. 2003;23:1096–1112. doi: 10.1097/01.WCB.0000085441.37552.CA. [DOI] [PubMed] [Google Scholar]
- Karachi C, Francois C, Parain K, Bardinet E, Tande D, Hirsch E, Yelnik J. Three-dimensional cartography of functional territories in the human striatopallidal complex by using calbindin immunoreactivity. Journal of Comparative Neurology. 2002;450:122–134. doi: 10.1002/cne.10312. [DOI] [PubMed] [Google Scholar]
- King RA. Clinical assessment. In: Lombroso PJ, editor. Institute VIII. TS and OCD: Neurobiological approaches to childhood psychiatric disorders; 41st Annual Meeting of the American Academy of Child and Adolescent Psychiatry; New York Hilton and Towers: New York, New York. 1994. [Google Scholar]
- Klove H. Clinical neuropsychology. In: Forster FM, editor. The medical clinics of North America. Saunders; New York, New York: 1963. [PubMed] [Google Scholar]
- Lammerstma AA, Hume SP. Simplified reference tissue model for PET receptor studies. NeuroImage. 1996;4:153–158. doi: 10.1006/nimg.1996.0066. [DOI] [PubMed] [Google Scholar]
- Laruelle M, Abi-Dargham A, Van Dyck C, Gil, D’Souza C, Erdos J, McCance E, Rosenblatt W, Fingado C, Zoghbi SS, Baldwin RM, Seibyl JP, Krystal JH, Charney DS, Innis RB. Single photon emission computerized tomography imaging of amphetamine-induced dopamine release in drug-free schizophrenic subjects. Proceedings of the National Academy of Sciences. 1996;93(17):9235–9240. doi: 10.1073/pnas.93.17.9235. [DOI] [PMC free article] [PubMed] [Google Scholar]
- Laruelle M, Abi-Dargham A. Dopamine as the wind of the psychotic fire: new evidence from brain imaging studies. Journal of Psychopharmacology. 1999;13(4):358–71. doi: 10.1177/026988119901300405. [DOI] [PubMed] [Google Scholar]
- Laruelle M, Abi-Dargham A, Gil R, Kegeles L, Innis R. Increased dopamine transmission in schizophrenia: relationship to illness phases. Biological Psychiatry. 1999;46(1):56–72. doi: 10.1016/s0006-3223(99)00067-0. [DOI] [PubMed] [Google Scholar]
- Leckman JF, Riddle MA, Hardin MT, Ort SI, Swartz KL, Stevenson J, Cohen DJ. The Yale Global Tic Severity Scale: initial testing of a clinician rated scale of tic severity. Journal of the American Academy of Child and Adolescent Psychiatry. 1989;28:566–573. doi: 10.1097/00004583-198907000-00015. [DOI] [PubMed] [Google Scholar]
- Leckman JF, Towbin KE, Ort SI, Cohen DJ. Clinical assessment of tic disorder severity. In: Cohen DJ, Bruun RD, Leckman JF, editors. Tourette’s syndrome and tic disorders. 1. 46 . 1988. pp. 55–78. [Google Scholar]
- Lodge DJ, Grace AA. The hippocampus modulates dopamine neuron responsivity by regulating the intensity of phasic neuron activation. Neuropsychopharmacology. 2006 doi: 10.1038/sj.npp.1300963. in press. [DOI] [PubMed] [Google Scholar]
- Logan J, Fowler JS, Volkow ND, Wang GJ, Ding YS, Alexoff D. Distribution volume ratios without blood sampling from graphical analysis of PET data. Jorunal of Cerebral Blood Flow and Metabolism. 1996;16:834–840. doi: 10.1097/00004647-199609000-00008. [DOI] [PubMed] [Google Scholar]
- Logan J, Fowler JS, Volkow ND, Wolf AP, Dewey SL, Schlyer DJ, MacGregor RR, Hitzemann R, Bendriem B, Gatley SJ. Graphical analysis of reversible radioligand binding from time-activity measurements applied to [N-11C-methyl]-(−)-cocaine PET studies in human subjects. Journal of Cerebral Blood Flow and Metabolism. 1990;10:740–7. doi: 10.1038/jcbfm.1990.127. [DOI] [PubMed] [Google Scholar]
- Malison RT, McDougle CJ, van Dyck CH, Scahill L, Baldwin RM, Seibyl JP, Price LH, Leckman JF, Innis RB. [123I]β-CIT SPECT imaging of striatal dopamine transporter binding in Tourette’s disorder. American Journal of Psychiatry. 1995;152–9:1359–1361. doi: 10.1176/ajp.152.9.1359. [DOI] [PubMed] [Google Scholar]
- Martinez D, Slifstein M, Broft A, Mawlawi T, Hwang DR, Huang YY, Cooper T, Kegeles L, Zarahn E, Abi-Dargham A, Haber SN, Laruelle M. Imaging human mesolimbic dopamine transmission with positron emission tomography. Part II: Amphetamine-induced dopamine release in the functional subdivisions of the striatum. Journal of Cerebral Blood Flow and Metabolism. 2003;23:285–300. doi: 10.1097/01.WCB.0000048520.34839.1A. [DOI] [PubMed] [Google Scholar]
- McCann UD, Szabo Z, Seckin E, Rosenblatt P, Mathews WB, Ravert HT, Dannals RF, Ricaurte GA. Quantitative PET studies of the serotonin transporter in MDMA users and controls using [11C]McN5652 and [11C]DASB. Neuropsychopharmacology. 2005;30:1741–1750. doi: 10.1038/sj.npp.1300736. [DOI] [PMC free article] [PubMed] [Google Scholar]
- McDougle CJ, Epperson CN, Pelton GH, Wasylink S, Price LH. A double-blind, placebo-controlled study of risperidone addition in serotonin reuptake inhibitor-refractory obsessive-compulsive disorder. Archives General Psychiatry. 2000;57(8):794–801. doi: 10.1001/archpsyc.57.8.794. [DOI] [PubMed] [Google Scholar]
- Meyer JH, Gunn RN, Myers R, Grasby PM. Assessment of spatial normalization of PET ligand images using ligand-specific templates. Neuroimage. 1999;9:545–553. doi: 10.1006/nimg.1999.0431. [DOI] [PubMed] [Google Scholar]
- Mihailescu S, Drucker-Colin R. Nicotine, brain nicotinic receptors, and neuropsychiatric disorders. Archives of Medical Research. 2000;31(2):131–144. doi: 10.1016/s0188-4409(99)00087-9. [DOI] [PubMed] [Google Scholar]
- Muller-Vahl KR, Meyer GJ, Knapp WH, Emrich HM, Gielow P, Brucke T, Berding G. Serotonin transporter binding in Tourette Syndrome. Neuroscience Letters. 2005;385:120–125. doi: 10.1016/j.neulet.2005.05.031. [DOI] [PubMed] [Google Scholar]
- Murray JB. Psychophysiological aspects of Tourette’s syndrome. Journal of Psychology. 1997;(6):615–26. doi: 10.1080/00223989709603843. [DOI] [PubMed] [Google Scholar]
- O’Donnell P, Grace AA. Tonic D2-mediated attenuation of cortical excitation in nucleus accumbens neurons recorded in vitro. Brain Research. 1994;634:105–112. doi: 10.1016/0006-8993(94)90263-1. [DOI] [PubMed] [Google Scholar]
- Pfanner C, Marazziti D, Dell’Osso L, Presta S, Gemignani A, Milanfranchi A, Cassano GB. Risperidone augmentation in refractory obsessive-compulsive disorder: an open- label study. International Clinical Psychopharmacology. 2000;15(5):297–301. doi: 10.1097/00004850-200015050-00007. [DOI] [PubMed] [Google Scholar]
- Pogarell O, Hamann C, Popperl G, Juckel G, Chouker M, Zaudig M, Riedel M, Moller HJ, Hegerl U, Tatsch K. Elevated brain serotonin transporter availability in patients with obsessive-compulsive disorder. Biological Psychiatry. 2003;54:1406–1413. doi: 10.1016/s0006-3223(03)00183-5. [DOI] [PubMed] [Google Scholar]
- Porras G, Di Matteo V, Fracasso C, Lucas G, De Deurwaerdere P, Caccia S, Esposito E, Spampinato U. 5-HT2A and 5-HT2C/2B receptor subtypes modulate dopamine release induced in vivo by amphetamine and morphine in both the rat nucleus accumbens and striatum. Neuropsychopharmacology. 2002;26:311–324. doi: 10.1016/S0893-133X(01)00333-5. [DOI] [PubMed] [Google Scholar]
- Reitan R, Wolfson D. The Halstead-Reitan Neuropsychological Test Battery. 2. Neuropsychology Press; Tucson, AZ: 1993. [Google Scholar]
- Reith J, Benkelfat C, Sherwin A, Yasuhara Y, Kuwabara H, Andermann F, Bachneff S, Cumming P, Diksic M, Dyve SE, Etienne P, Evans AC, Lal S, Shevell M, Savard G, Wong DF, Chouinard G, Gjedde A. Elevated dopa decarboxylase activity in living brain of patients withpsychosis. Proc Natl Acad Sci U S A. 1994 Nov 22;91(24):11651–4. doi: 10.1073/pnas.91.24.11651. [DOI] [PMC free article] [PubMed] [Google Scholar]
- Scahill L, Erenberg G, Berlin CM, Jr, Budman C, Coffey BJ, Jankovic J, Kiessling L, King RA, Kurlan R, Lang A, Mink J, Murphy T, Zinner S, Walkup J Tourette Syndrome Association Medical Advisory Board: Practice Committee. Contemporary assessment and pharmacotherapy of Tourette syndrome. NeuroRx. 2006 Apr;3(2):192–206. doi: 10.1016/j.nurx.2006.01.009. [DOI] [PMC free article] [PubMed] [Google Scholar]
- Schmidt CJ, Sullivan CK, Fadayel GM. Blocakde of striatal 5-HT2 receptors reduces the increase in extracellular concentrations of dopamine produced by the amphetamine analogue 3,4-Metylenedioxymethamphetamine. Journal of Neurochemistry. 1994;62:1382–1389. doi: 10.1046/j.1471-4159.1994.62041382.x. [DOI] [PubMed] [Google Scholar]
- Schretlen DJ, Brandt J, Bobholz JH. Validation of the Brief Test of Attention in patients with Huntington’s disease and amnesia. The Clinical Neuropsychologist. 1996;10:70–95. [Google Scholar]
- Schultz W. The phasic reward signal of primate dopamine neurons. Advances in Pharmacology. 1998;42:686–690. doi: 10.1016/s1054-3589(08)60841-8. [DOI] [PubMed] [Google Scholar]
- Shytle RD, Silver AA, Sanberg PR. Comorbid bipolar disorder in Tourette’s syndrome responds to the nicotinic receptor antagonist mecamylamine (Inversine) Biological Psychiatry. 2000;48:1028–1031. doi: 10.1016/s0006-3223(00)00945-8. [DOI] [PubMed] [Google Scholar]
- Silver AA, Shytle RD, Sanberg PR. Mecamylamine in Tourette’s syndrome: a two-year retrospective case study. Journal of Child & Adolescent Psychopharmacology. 2000;10(2):59–68. doi: 10.1089/cap.2000.10.59. [DOI] [PubMed] [Google Scholar]
- Silverstone T. Dopamine in manic depressive illness. A pharmacological synthesis. J Affect Disord. 1985;8(3):225–31. doi: 10.1016/0165-0327(85)90020-5. [DOI] [PubMed] [Google Scholar]
- Silvestri R, Raffaele M, De Domenico P, Tisano A, Lagana A, Di Perri R. Serotoninergic agents in the treatment of Gilles de la Tourette’s syndrome. Acta Neurologica. 1994;16(1–2):8–63. [PubMed] [Google Scholar]
- Simpson HB, Lombardo I, Slifstein M, Huang HY, Hwang DR, Abi-Dargham A, Liebowitz MR, Laruelle M. Serotonin transporters in obsessive-compulsive disorder: a positron emission tomography study with [(11)C]McN 5652. Biological Psychiatry. 2003;54:14–1421. doi: 10.1016/s0006-3223(03)00544-4. [DOI] [PubMed] [Google Scholar]
- Singer HS, Hahn IH, Moran TH. Abnormal dopamine uptake sites in postmortem striatum from patients with Tourette’s syndrome. Annals of Neurology. 1991;30:558–562. doi: 10.1002/ana.410300408. [DOI] [PubMed] [Google Scholar]
- Singer HS. The treatment of tics. Curr Neurol Neurosci Rep. 2001;1:195–202. doi: 10.1007/s11910-001-0016-8. [DOI] [PubMed] [Google Scholar]
- Singer HS, Butler IJ, Tune LE, Seifert WE, Coyle JT. Dopaminergic dysfunction in Tourette Syndrome. Ann Neurol. 1982;12:361–366. doi: 10.1002/ana.410120408. [DOI] [PubMed] [Google Scholar]
- Singer HS, Szymanski S, Giuliano J, Yokoi F, Dogan AS, Brasic JR, Zhou Y, Grace AA, Wong DF. Elevated intrasynaptic dopamine release in Tourette’s syndrome measured by PET. American Journal of Psychiatry. 2002;159:1329–1336. doi: 10.1176/appi.ajp.159.8.1329. [DOI] [PubMed] [Google Scholar]
- Singer HS, Reiss AL, Brown JE, Aylward EH, Shih B, Chee E, Harris EL, Reader MJ, Chase GA, Bryan RN. Volumetric MRI Changes in Basal Ganglia of Children with Tourettes-Syndrome. Neurology. 1993;43:950–956. doi: 10.1212/wnl.43.5.950. [DOI] [PubMed] [Google Scholar]
- Singer HS, Butler IJ, Tune LE, Seifert WF, Jr, Coyle JT. Dopaminergic Dysfunction in Tourette Syndrome. Annals of Neurology. 1982;12(4):361–366. doi: 10.1002/ana.410120408. [DOI] [PubMed] [Google Scholar]
- Sölling T, Brust P, Cunningham VJ, Wong DF, Gjedde A. True equilibrium bolus estimation (TREMBLE) confirms rapid transient equilibrium. Neuroimage. 1997;5(4):A29. [Google Scholar]
- Stengler-Wenzke K, Muller U, Angermeyer MC, Sabri O, Hesse S. Reduced serotonin transporter-availability in obsessive-compulsive disorder (OCD) European Archives of Psychiatry & Clinical Neuroscience. 2004;254:252–255. doi: 10.1007/s00406-004-0489-y. [DOI] [PubMed] [Google Scholar]
- Szabo Z, McCann UD, Wilson AA, Scheffel U, Owonikoko T, Mathews WB, Ravert HT, Hilton J, Dannals RF, Ricaurte GA. Comparison of (+)-(11)C-McN5652 and (11)C-DASB as serotonin transporter radioligands under various experimental conditions. Journal of Nuclear Medicine. 2002;43(5):678–92. [PMC free article] [PubMed] [Google Scholar]
- Szymanski S, Singer H, Guiliano J, Yokoi F, Dogan S, Villemagne V, Wong DF. Basal ganglia dopamine release in Tourette syndrome. Journal of Nuclear Medicine. 1997;38(5):12P. [abstract] [Google Scholar]
- Wender PH. Attention-Deficit Hyperactivity Disorder in Adults. Oxford University Press; New York: 1995. [Google Scholar]
- West AR, Grace AA. Opposite influences of endogenous dopamine D1 and D2 receptors acticvation on activity states and electrophysiological properties of striatal neurons: studies combining in vivo intracellular recordings and reverse microdialysis. Journal of Neuroscience. 2002;22:294–304. doi: 10.1523/JNEUROSCI.22-01-00294.2002. [DOI] [PMC free article] [PubMed] [Google Scholar]
- Weizman A, Mandel A, Barber Y, Weitz R, Cohen A, Mester R, Rehavi M. Decreased Platelet Imipramine Binding in Tourette Syndrome Children with Obsessive-Compulsive Disorder. Biological Psychiatry. 1992;31:705–711. doi: 10.1016/0006-3223(92)90280-d. [DOI] [PubMed] [Google Scholar]
- Wightman RM, Robinson DR. Transient changes in mesolimbic dopamine and their association with ‘reward’. Journal of Neurochemistry. 2002;82:721–735. doi: 10.1046/j.1471-4159.2002.01005.x. [DOI] [PubMed] [Google Scholar]
- Wong DF, Yung B, Dannals RF, Shaya EK, Ravert HT, Chen CA, Chan B, Folio T, Scheffel U, Ricaurte GA. In vivo imaging of baboon and human dopamine transporters by positron emission tomography using [11C]WIN 35,428. Synapse. 1993;15(2):130–142. doi: 10.1002/syn.890150205. [DOI] [PubMed] [Google Scholar]
- Wong DF, Singer HS, Brandt J, Shaya E, Chen C, Brown J, Kimball AW, Gjedde A, Dannals RF, Ravert HT, Wilson PD, Wagner HN., Jr D2-like dopamine receptor density in Tourette syndrome measured by PET. Journal of Nuclear Medicine. 1997;38:1243–1247. [PubMed] [Google Scholar]
- Wong DF, Solling T, Yokoi F, Gjedde A. Quantification of extracellular dopamine release in schizophrenia and cocaine use by means of TREMBLE. Quantitative Functional Brain Imaging with Positron Emission Tomography. 1998:463–468. [Google Scholar]
- Wong DF, Brasic JR, Kuwabara H, Zhou Y, Schretlen D, Kumar A, Ye W, Alexander M, Nandi A, Bell-Warren KR, Gjedde A, Grace AA, Singer HS. Abnormalities of dopamine and serotonin neuroreceptors documented with PET in Tourette syndrome. Journal of Nuclear Medicine. 2005;48(5):182P. [abstract] [Google Scholar]
- Zhou Y, Brasic J, Endres CJ, Kuwabara H, Kimes A, Contoreggi C, Wong DF. Binding potential image based statistical mapping for detection of dopamine release by [11C]raclopride dynamic PET. NeuroImage. 2002a;16:S91. [Google Scholar]
- Zhou Y, Huang SC, Bergsneider M, Wong DF. Improved parametric image generation using spatial-temporal analysis of dynamic PET studies. NeuroImage. 2002b;15:697–707. doi: 10.1006/nimg.2001.1021. [DOI] [PubMed] [Google Scholar]
- Zhou Y, Endres CJ, Brasic JR, Huang SC, Wong DF. Linear regression with spatial constraint to generate parametric images of ligand-receptor dynamic PET studies with a simplified reference tissue model. NeuroImage. 2003a;18:975–989. doi: 10.1016/s1053-8119(03)00017-x. [DOI] [PubMed] [Google Scholar]
- Zhou Y, Offord SJ, Ahmet SD, Crabb AH, Wong DF. Evaluation of antihistamine drugs by human [11C]Doxepin dynamic PET studies with parametric image approach. Proceedings of the IEEE: Symposium on Advances in Medical Image Processing in Medicine; 2003b. pp. 1085–1091. [Google Scholar]
- Zhou Y, Brasic J, Dogan AS, Ye W, Crabb AH, Hilton J, Wong DF. A robust parametric imaging algorithm to quantify serotonin receptor and transporter binding in human brain using 11C-MDL 100,907 and (+)11C-MCN 5652 dynamic PET. Journal of Nuclear Medicine. 2004;45(Suppl 5):395P–396P. [abstract] [Google Scholar]
- Zhou Y, Brasic JR, Ye WG, Dogan AS, Hilton J, Singer HS, Wong DF. Quantification of cerebral serotonin binding in normal controls and subjects with Tourette’s syndrome using [C-11]MDL 100,907 and (+)[C-11]McN 5652 dynamic PET with parametric imaging approach. NeuroImage. 2004;22:T98–T99. [Google Scholar]