

Background: Conformational stability and folding of retinoblastoma tumor suppressor are unknown to date.
Results: The metastable RbAB domain undergoes oligomerization and aggregation, which are suppressed by natural ligands.
Conclusion: RbAB requires binding to ligands or is prone to inactivation.
Significance: Despite a different sequence and fold, Rb shares tumor suppression and multiligand binding with p53 where marginal stability and oligomerization may lead to inactivation.
Keywords: Protein Aggregation, Protein Folding, Protein Misfolding, Protein Stability, Retinoblastoma (Rb), Scaffold Proteins, Cyclin Fold, Marginal Stability, Oligomerization, Tumor Suppressor
Abstract
The retinoblastoma tumor suppressor (Rb) controls the proliferation, differentiation, and survival of cells in most eukaryotes with a role in the fate of stem cells. Its inactivation by mutation or oncogenic viruses is required for cellular transformation and eventually carcinogenesis. The high conservation of the Rb cyclin fold prompted us to investigate the link between conformational stability and ligand binding properties of the RbAB pocket domain. RbAB unfolding presents a three-state transition involving cooperative secondary and tertiary structure changes and a partially folded intermediate that can oligomerize. The first transition corresponds to unfolding of the metastable B subdomain containing the binding site for the LXCXE motif present in cellular and viral targets, and the second transition corresponds to the stable A subdomain. The low thermodynamic stability of RbAB translates into a propensity to rapidly oligomerize and aggregate at 37 °C (T50 = 28 min) that is suppressed by human papillomavirus E7 and E2F peptide ligands, suggesting that Rb is likely stabilized in vivo through binding to target proteins. We propose that marginal stability and associated oligomerization may be conserved for function as a “hub” protein, allowing the formation of multiprotein complexes, which could constitute a robust mechanism to retain its cell cycle regulatory role throughout evolution. Decreased stability and oligomerization are shared with the p53 tumor suppressor, suggesting a link between folding and function in these two essential cell regulators that are inactivated in most cancers and operate within multitarget signaling pathways.
Introduction
The retinoblastoma tumor suppressor (Rb)5 is a central regulator of cell cycle progression, development, and differentiation that modulates the activity of E2F proteins and other transcription factors (1, 2). Rb also interacts with chromatin-remodeling enzymes, leading to control of chromatin state and expression of specific target genes (3), and has recently been shown to play a role in stem cell biology (4). Despite extensive divergence among its components, the signaling network regulating the cell cycle is conserved throughout evolution of eukaryotes from yeasts to mammals (5). The Rb/E2F regulatory node is strikingly conserved in organisms as divergent as unicellular algae, plants, worms, and mammals, pointing to the central role of this ancient regulatory module (6, 7). Rb is considered as a “hub” protein of the cell cycle interaction network because of its ability to bind to and regulate the activity of multiple proteins involved in cell cycle control (8).
Rb was the first tumor suppressor to be identified in the pediatric tumor retinoblastoma and is further inactivated in glioblastoma; melanoma; and lung, breast, and liver cancers among others (9). On the other hand, Rb is also targeted by several DNA and RNA viruses such as human papillomavirus (HPV), hepatitis C virus, and Merkel cell polyomavirus, which are linked to the development of cervical, liver, and Merkel cell carcinoma, respectively (10–12). Most mutations of the RB1 gene correspond to small insertions or deletions and to early termination with a smaller proportion of missense mutations (13, 14). Rb cooperates with p53 in tumor suppression, and loss of function of both p53 and Rb is thought to be a virtually universal feature of tumorigenesis (15). However, the consequences of Rb loss on cancer initiation and progression are only beginning to be uncovered. Based on its inactivation in tumors, Rb has been recently proposed as a potential target for anticancer strategies, and it has been suggested that Rb levels could be considered for guiding cancer treatments (16).
Human Rb is a 105-kDa protein composed of structured RbN (17) and RbAB (18) domains followed by a disordered RbC domain that becomes ordered upon binding to E2F (19). The RbN and RbAB domains are linked by a flexible stretch (20). The RbAB domain, termed “small pocket” or “pocket domain,” is the primary site for molecular interactions between Rb and its binding partners (21) and together with RbC forms the “large pocket,” which is sufficient for cell cycle arrest and transcriptional repression functions. The RbAB domain is also the site of most tumorigenic missense mutations (14) and presents the double cyclin fold topology (see Fig. 1), a highly conserved structural motif found in a nuclear regulatory protein superfamily that includes cyclins, the basal transcription factor TFIIB, and “pocket” family members p107, p130, and Rb, all of which function as protein recognition modules (22, 23). The double cyclin fold is formed by two five-helix structural cores with additional helices in each family (18, 22). In RbAB, the A and B cyclin folds present five and three additional helices, respectively, and are connected by a 60-residue flexible linker (20). Both subdomains associate through an extensive 2013-Å2 interface formed by a compact hydrophobic core (18).
FIGURE 1.

Structure of the RbAB domain and its LXCXE and E2F ligands. A ribbon representation of the RbAB domain (Protein Data Bank code 1N4M) indicating the relative orientations of the RbAB A and B subdomains (dark and light gray, respectively) is shown. The HPV E7(21–29) peptide containing the LXCXE motif (Protein Data Bank code 1GUX; red) binds to a conserved surface cleft located in the B subdomain, whereas the E2F-TD(407–426) peptide (Protein Data Bank code 1N4M; green) binds to a conserved groove formed by the A/B interface. The three tryptophan residues in RbAB are depicted (cyan spheres) and are located in the hydrophobic core of the A subdomain (Trp-516), in the A/B interface (Trp-563), and in the B subdomain (Trp-681). The fraction of accessible surface area for these residues is 0.41 (Trp-516), 0.00 (Trp-563), and 0.01 (Trp-681).
The RbAB domain contains two highly conserved protein interaction surfaces, the LXCXE and E2F clefts. Cellular factors containing the LXCXE motif such as SWI/SNF complexes, DNMT1, Rbp2, and HDAC1/2 mediate transcriptional repression and chromatin regulation (21, 24) by interacting with the LXCXE cleft located in the B subdomain (18) (see Fig. 1). An Rb knock-in allele carrying a mutation that prevents binding to the LXCXE cleft promotes tumor formation and chromosome instability in p53-deficient mice (25), highlighting the importance of LXCXE interactions for tumor suppression. The E2F cleft, located at the A/B interface, binds to a helical motif from the E2F transactivation domain (E2F-TD) (18, 26) (Fig. 1), an interaction that is essential for Rb-mediated G1 cell cycle arrest (1). Both the LXCXE and E2F clefts are targeted by viral proteins, among them the small DNA tumor virus proteins HPV E7, adenovirus E1A, and polyomavirus T antigen, highlighting their importance for virus-mediated control of the host cell cycle (27).
Protein conformational stability and dynamics are closely linked to their function and mechanisms of inactivation (28) as low thermodynamic stabilities can cause native states to be highly sensitive to destabilizing mutations, and aggregation-prone forms of proteins may be involved in disease (29, 30). Moreover, unstable or highly dynamic proteins may also be more sensitive to proteolysis in vivo (31). Structure-function studies have provided insights into the mechanisms of inactivation of the p53 and p16INKA tumor suppressors (32, 33). Mutation of the multifunctional p53 protein in over 50% of human cancers leads to either loss of function or dominant negative oncogenic gain of function phenotypes (33, 34), whereas loss of function or overexpression of the CDK4/6 inhibitor p16INKA is also a hallmark of multiple types of cancer (34, 35). Tumorigenic mutations in the marginally stable p53 core domain (p53CD) and in p16INK4A yield unstable proteins that are unfolded and prone to aggregation under physiological conditions (32, 36, 37), showing that low thermodynamic stability and its associated misfolding and aggregation are linked to loss of function of both tumor suppressors.
Despite their central importance in gene regulatory and protein interaction networks, current knowledge of the structure-function relationships and conformational stability of cyclin fold proteins is very scarce (21). Although a few studies from TFIIB and Cyclin A suggest that these proteins have low stability and a high plasticity (38–40), recent work on Rb showed that its inactivation by phosphorylation involves multiple conformational rearrangements, indicating that Rb plasticity is required for function (17, 19, 20, 41, 42). However, the conformational stability and dynamics of Rb or its domains have not been studied to date. This type of work is fundamental for developing effective therapeutic approaches targeting Rb and for understanding its role as a hub in a large protein signaling network. Biophysical studies of multidomain proteins such as Rb are challenging because they frequently present low levels of recombinant expression, have disordered regions, and are prone to aggregation, making them difficult to handle in vitro. In these cases, the domain fragmentation approach presents a valuable starting point that provides information on the properties of individual domains, setting the basis for studies of larger fragments or the full-length protein, as exemplified by its success in the study of the p53 tumor suppressor (33). Although the behavior of individual domains may be modified by domain interactions in vivo, the properties of major domains within multidomain proteins frequently have a strong impact on the full-length protein. For example, the stability and levels of folded p53 in vivo are dictated by the p53CD (43, 44) with additional modulation by domain interactions and phosphorylation (45, 46).
In this work, we present the first report on the conformational stability and folding of the RbAB pocket domain, which presents the main interaction sites with both cellular and viral proteins and is the site of most tumorigenic point mutations. We show that RbAB is marginally stable and presents multiple conformations in solution including a folding intermediate in which the LXCXE and E2F binding sites are disrupted. Based on our results, we discuss the possibility that, similar to other clinically relevant tumor suppressors, RbAB marginal stability may underlie its inactivation in cancer. These properties may be an evolutionarily conserved feature of cyclin fold superfamily proteins that allows the multiple interactions involved in cell signaling regulatory networks.
EXPERIMENTAL PROCEDURES
Protein Expression and Purification and Peptide Synthesis
The human RbAB domain (residues 372–787) was expressed and purified as described previously (47). The sample was stored in 20 mm sodium phosphate, pH 7.0, 200 mm NaCl, and 2 mm DTT. Protein purity was >95% as judged by SDS-PAGE and MALDI-TOF mass spectrometry (Bruker Daltonics, Billerica, MA). The purified domain was homogeneous and monomeric as indicated by static light scattering measurements (see below), which yielded a molecular mass of 49 kDa. Protein concentration was determined by the Bradford method or by UV spectroscopy using a molar extinction coefficient for RbAB (ϵ280 nm = 43,350 m−1·cm−1) (48). The E7 peptides used in this work have been described previously in detail (47). Peptides were synthesized by Fmoc (N-(9-fluorenyl)methoxycarbonyl) chemistry (W. M. Keck Facility, Yale University, New Haven, CT). Peptides were quantified by UV absorbance at 276 nm, and peptides lacking tyrosine residues were quantified by absorbance at 220 nm.
Chemicals and Solutions
Unless stated otherwise, measurements were performed in 20 mm sodium phosphate buffer at pH 7.0, 200 mm NaCl, and 2 mm DTT at 20 ± 0.1 °C using analytical grade chemical reagents (Sigma-Aldrich or ICN).
Light Scattering Measurements
Static Light Scattering
The average molecular weight of RbAB was determined on a Precision Detectors PD2010 light scattering instrument connected in tandem to a high performance liquid chromatography system and an LKB 2142 differential refractometer. We used a Superdex 200 HR 10/30 (24-ml) gel filtration column (GE Healthcare) and injected 150 μl of a 1 mg/ml (∼20 μm) protein sample at a 0.5 ml/min flow rate. The buffer was 20 mm sodium phosphate, pH 7.0, 0.1 m NaCl, and 1 mm DTT. The 90° light scattering and refractive index signals of the eluting material were recorded on a PC computer and analyzed with the Discovery32 software supplied by Precision Detectors.
Dynamic Light Scattering (DLS)
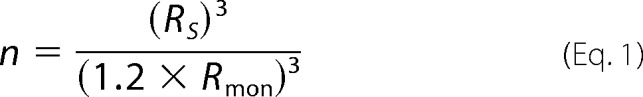
Measurements were performed on a Zetasizer Nano S DLS device from Malvern Instruments. 10 μm RbAB samples in different solvent conditions were prepared and filtered prior to measurement with Ultrafree-MC microcentrifuge filters (0.22 μm; Millipore). The average hydrodynamic radius and standard deviation were calculated by Gaussian fitting of the particle size distribution curves using the instrument software. The average number of monomers (n) in the oligomeric RbAB samples was calculated from the average volume (v) and hydrodynamic radius of the ensemble (RS) where the Rmon is the radius of a native RbAB monomer (Rmon = 3.85 nm) and 1.2 is the average relationship between the hydrodynamic radii of partially folded and native monomers (49).
 |
Circular Dichroism Spectroscopy
Measurements were conducted on a Jasco J-810 spectropolarimeter using a Peltier temperature-controlled cell. Far-UV circular dichroism (CD) spectra were recorded between 200 and 260 nm at standard sensitivity at a rate of 100 nm/min with 4-s response time, 0.2-nm data pitch, and 1-nm bandwidth. Spectra were an average of at least five scans after subtraction of buffer spectra. Near-UV CD measurements were performed in the 250–360 nm range using the same equipment parameters at high sensitivity and 50–90 μm RbAB concentration. Raw data were converted to molar ellipticity using the relationship
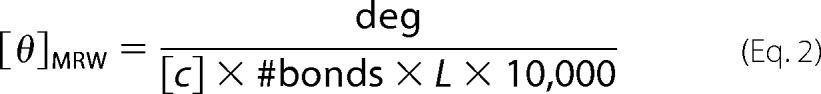 |
where deg is the raw signal in millidegrees, [c] is protein concentration in molar units, #bonds is the number of peptide bonds (number of amino acids − 1), and L is the path length in cm.
Fluorescence Spectroscopy
Fluorescence emission spectra were recorded on a Jasco FP-6500 spectrofluorometer with an excitation wavelength of 295 nm, and the emission spectrum was recorded from 310 to 400 nm using excitation and emission bandwidths of 5 nm, respectively, and a scan speed of 100 nm/min. Fluorescence emission data were analyzed by first subtracting the buffer background at the appropriate guanidinium chloride (GdmCl) concentration, and the center of spectral mass of the emission spectrum was quantified as
where Fi is the fluorescence emission at wave number υi and the summation is carried out over the range of measured values of F. Spectra of RbAB at concentrations above 1 μm were recorded in a 4-mm-path length quartz cell, and those below 1 μm were recorded in a 10-mm-path length cell. All data shown were obtained from averaging three to five spectra.
1-Anilinonaphtalene 8-Sulfonate (ANS) and Thioflavin T (ThT) Binding
Binding to ANS and ThT was measured by fluorescence spectroscopy. For ANS binding experiments, 2–4 μm protein was added to 100 mm citrate-phosphate buffer solution equilibrated at the indicated pH value (2.0 or 7.0) containing 60 μm ANS. Fluorescence spectra were recorded with excitation at 370 nm using a 5-nm excitation and emission bandwidth, respectively, and ANS binding was detected by an increase in fluorescence at 470 nm. For ThT binding experiments, 2–4 μm protein was added to 100 mm citrate-phosphate buffer solution equilibrated at the indicated pH value (2.0 or 7.0) containing 20 μm ThT. Fluorescence spectra were recorded with excitation at 435 nm using a 5-nm excitation and emission bandwidth, respectively, and ThT binding was detected by an increase in probe fluorescence at 480 nm.
GdmCl and Urea Equilibrium Unfolding
Experiments were performed by equilibrating the protein in tubes containing 20 mm sodium phosphate buffer, pH 7.0, 200 mm NaCl, and 2 mm DTT at 20 °C and increasing GdmCl or urea concentrations. Samples were incubated for 30 min prior to measurement of CD and tryptophan emission spectra because unfolding kinetics indicated that the equilibrium was reached within 200 s.
RbAB Denaturation in the Presence of E7 Peptides
Unfolding experiments in the presence of peptide ligands were performed in the manner described above except that a preformed RbAB·peptide complex was added to the tubes containing denaturant instead of RbAB alone. The final concentrations in the experiments were 1 μm RbAB and 10 μm peptide.
Data Analysis and Fitting
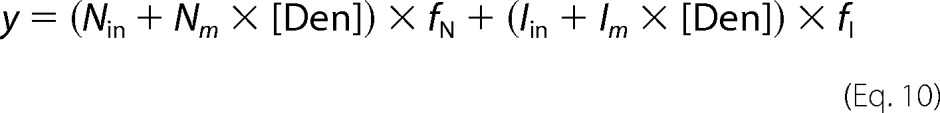
GdmCl denaturation curves were fit to a three-state model (see Scheme 1). Spectroscopic signals were fit to a linear model,
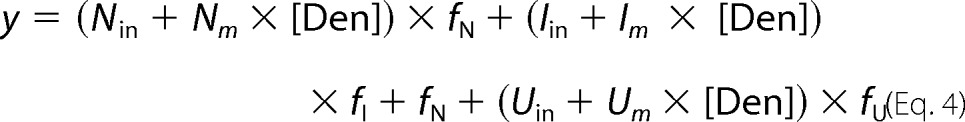 |
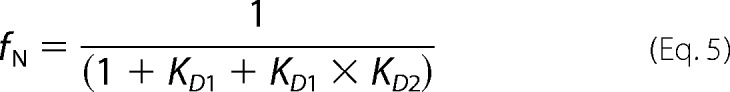
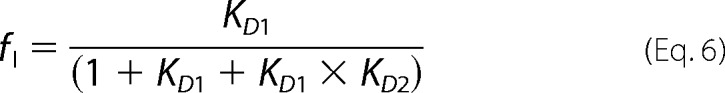
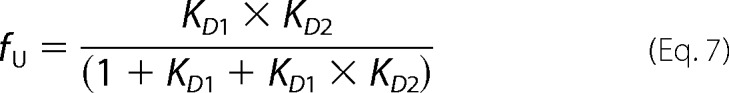
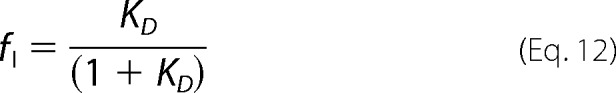
where y is the measured signal; Nin, Iin, and Uin are the spectroscopic signals of the native, intermediate, and unfolded monomers, respectively; and Nm, Im, and Um are parameters that account for the linear variation of these signals with denaturant concentration ([Den]). The fractions of native, intermediate, and unfolded monomers are fN, fI, and fU and are defined as
 |
 |
 |
where R is the gas constant, T is the temperature, KD1 and ΔG1H2O and KD2 and ΔG2H2O are the equilibrium dissociation constants and free energies of unfolding of the first and second transitions, respectively, and m1 and m2 are m-values for each transition. Global data fitting of experiments at 1 and 5 μm RbAB concentrations was performed to obtain thermodynamic parameters for each transition. Data sets for CD and center of spectral mass (CSM) signals were fit separately. Urea denaturation curves were fit to a two-state model considering native (“N”) and partially folded intermediate (“I”) monomers. The spectroscopic signals were fit to the equation
 |
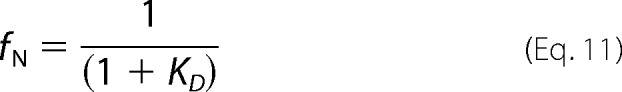
where y is the measured signal, Nin and Iin are the spectroscopic signals of the native and intermediate states, respectively, and Nm and Im account for the linear variation of the signals with denaturant concentration ([Den]). The fractions of native and intermediate species (fN and fI) are defined as
 |
 |
where R is the gas constant, T is the temperature, KD and ΔGH2O are the equilibrium dissociation constant and free energy of unfolding, respectively, and m is the m-value for the transition. Parameters were estimated from global fitting on the CD and tryptophan center of mass signals on experiments performed at 1 μm RbAB concentration. Data sets for CD and CSM signals were also fit separately to obtain the spectroscopic parameters for each state. For urea denaturation in the presence of RbAB ligands, data were fit to a model that considers coupled binding and folding (see Scheme 2). The global free energy of unfolding (50) is described by
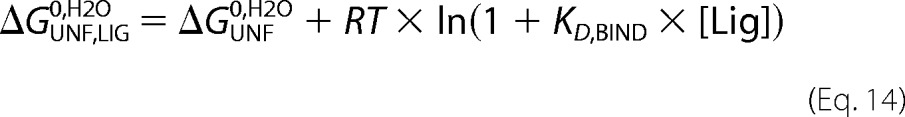 |
where ΔGUNF0,H2O is the free energy of unfolding in the absence of ligands, KD,BIND is the equilibrium dissociation constant for binding of the native species to the ligand, and [Lig] is ligand concentration in the reaction. Global data fitting on the CD and CSM signals was performed on denaturation curves performed at 1 μm RbAB concentration and 10 μm ligand concentration. We restricted the fits using the ΔGUNF0,H2O and mUNF values obtained from fits of denaturation curves in the absence of ligand, which allowed us to estimate the KD,BIND values for each ligand. Fittings were carried out using Profit software (Quantumsoft, Zurich, Switzerland).
SCHEME 1.
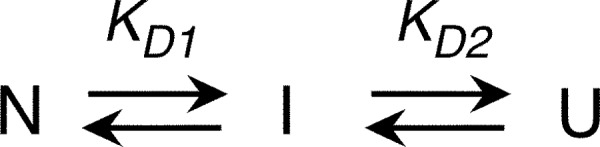
Three-state RbAB denaturation model.
SCHEME 2.
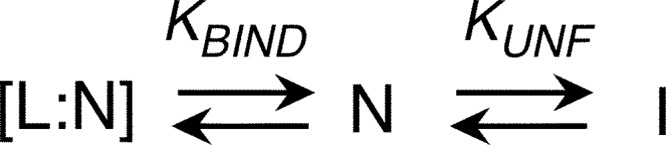
Coupled binding and unfolding model.
Thermal Scans
Thermal denaturation scans were performed on a Jasco J-810 spectropolarimeter using a Peltier temperature-controlled cell. Ellipticity at 220 nm was recorded as the temperature was increased at a constant speed from 20 to 80 °C with 2-nm bandwidth, 4-s response time, and 0.2 °C data pitch. The scan rate was varied from 0.5 to 5 °C/min.
Thermal Scans of RbAB·Peptide Complexes
Experiments like those described above were performed on preformed complexes of 2 μm RbAB with 20 μm peptide ligands. None of the peptide ligands presented ellipticity changes in the temperature range assayed, ensuring that all changes in the CD signal corresponded to the RbAB domain.
Data Analysis
Thermal scans were fit to an irreversible denaturation model (see Scheme 3) (51, 52) that involves a first-order kinetic conversion from the native state N to a “final” state (F in this model). This model can describe denaturation reactions including on- or off-pathway intermediates provided that the overall process is irreversible. The rate constant k is assumed to change with temperature following the relationship
 |
where Ea is the activation energy, R is the gas constant, T is temperature, and T* is the temperature where k = 1 min−1. The change in molar ellipticity with temperature was fit according to the function
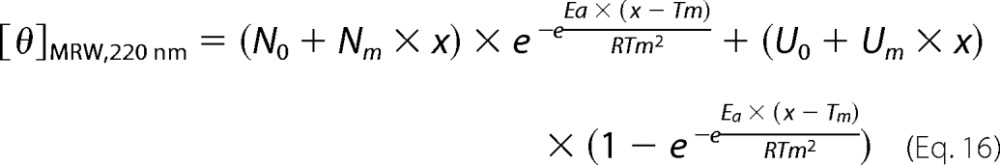 |
where [θ]MRW220 nm is the measured signal, the variable x is temperature in K, N0 and U0 are the signals of the native and denatured states at 0 K, respectively, and Nm and N0 are constants that allow for a linear increase or decrease of the base-line signals as a function of temperature for the native and denatured states. Ea(app) and Tm(app) are the apparent activation energy and melting temperature, respectively. R is the gas constant (1.995·10−3 kcal/mol·K).
SCHEME 3.

Kinetic model for irreversible denaturation.
Isothermal Denaturation Kinetics
The denaturation reaction was followed by recording elastic scattering at 360 nm in a UV spectrophotometer (Aminco Bowman) and the far-UV CD signal at 220 nm following transfer of the RbAB domain from a concentrated stock solution held at 4 °C to a cuvette containing 20 mm sodium phosphate buffer, pH 7.0, 200 mm NaCl, and 2 mm DTT pre-equilibrated at different temperatures without sample stirring. The concentration dependence of the reaction was measured at 45 °C in a 0.2-cm-path length cell by varying RbAB concentration from 0.1 to 4 μm. Both the elastic scattering and CD signals were followed until the reactions reached saturation. The temperature dependence of the reaction was measured at 0.5 μm concentration in a 0.5-cm-path length cell.
Isothermal Denaturation Kinetics in the Presence of Peptide Ligands
Experiments were performed as detailed above except that a preformed RbAB·peptide complex was added to the cuvette at 2 μm RbAB and 20 μm peptide final concentration.
Data Analysis
Model-free T50 values were calculated by determining the initial and saturation values of the signal and by calculating the time at which the signal change was 50% of the total change observed. The VE (elongation speed) value was experimentally determined as the slope of the traces centered at 30% signal saturation. For both parameters, the standard deviations were less than 1%. We used a kinetically limited model developed by Zlotnick et al. (53) to analyze the mechanism of nucleated oligomerization. The size of the nucleus can be estimated from the slope of a log-log plot of [RbABagg] as a function of [RbABmon],
where k is a proportionality constant and n is the size of the oligomerization nucleus. We estimated [RbABagg] and [RbABmon] at different time points in the oligomerization kinetics using the normalized elastic scattering signal as a proxy for aggregate concentration. We defined [RbABagg] = [RbABtot] × Scattering signal and [RbABmon] = [RbABtot] × (1 − Scattering signal).
The order of the polymerization reaction was calculated from the log(VE) versus log(Ctot) curve,
where Ctot is the total RbAB concentration, C is a constant, and l is the elongation order.
RESULTS
Characterization of the RbAB Native State
We began by exploring the solution conditions under which the RbAB monomer was stable by assessing its solubility after a 1-h incubation in buffer equilibrated at different pH values. As shown in Fig. 2A, the RbAB domain was highly soluble between pH 6.0 and 8.0, but aggregation occurred at pH values approaching its theoretical pI (8.9). Surprisingly, RbAB aggregated between pH 3.0 and 5.0 possibly due to titration of yet unidentified acidic residues. RbAB was soluble both at low and neutral pH, which prompted us to compare the conformation of the soluble species obtained at pH 2.0 and 7.0. The far-UV CD spectrum of RbAB at pH 7.0 presented the characteristic minima at 208 and 222 nm, indicating a high content of α-helical secondary structure (Fig. 2B), as expected from the known crystal structures (Fig. 1). At pH 2.0, RbAB retained a high content of secondary structure, indicating that it was still largely folded, but its far-UV CD spectrum suggested an added component of β-sheet structure (Fig. 2B). To assess β-sheet content, we measured ThT binding by RbAB. ThT binding was increased at pH 2.0 compared with pH 7.0, further suggesting the formation of elements of repetitive β-sheet structure at low pH (Fig. 2C). RbAB tertiary structure was evaluated by assessing the environment of tryptophan residues by near-UV CD and by tryptophan fluorescence. The RbAB domain presents three tryptophan residues that have low solvent accessibility and are located in the hydrophobic cores of the A subdomain, the A/B interface, and the hydrophobic core of the B subdomain (Fig. 1). At pH 7.0, the near-UV CD spectrum presented a negative band centered at 280 nm (Fig. 2D), indicating that tryptophan residues were in an asymmetric environment. This environment was partially disrupted at pH 2.0 as shown by the decrease in intensity of the CD band at 280 nm (Fig. 2D). The tryptophan fluorescence spectrum at pH 7.0 presented a maximum at 328 nm, indicating that the tryptophan residues were solvent-protected as expected for the native state (Fig. 1), whereas at pH 2.0, the shift of this maximum to 340 nm revealed a higher exposure of these residues to solvent (Fig. 2D, inset). In addition, RbAB presented high ANS binding at pH 2.0 in comparison with pH 7.0 as shown by a strong increase in ANS fluorescence emission intensity (Fig. 2E). This indicated that at low pH there was a higher exposure of hydrophobic regions to the solvent. The oligomerization state at low pH was investigated by DLS (Fig. 2F). At pH 7.0, RbAB presented a homogeneous particle size distribution with hydrodynamic radius RS = 3.85 ± 0.07 nm. This value was slightly higher than that expected for a globular 52-kDa monomer (RS = 3.1 nm), which is likely due to the elongated shape of the molecule. At pH 2.0, RbAB presented a broader particle size distribution with RS = 23 ± 4 nm, indicative of an oligomer, which was predicted to correspond roughly to 120 monomers (49) (see “Experimental Procedures”). This soluble oligomer displayed high stability to thermal denaturation with no changes in its CD spectrum up to 80 °C, and its formation was an irreversible process (not shown). Therefore, although at pH 7.0 RbAB is a monomer that presents a native conformation and consolidated tertiary structure, at pH 2.0, RbAB remains largely folded but forms soluble oligomers with an increase in β-sheet structure and higher solvent accessibility of its hydrophobic core. Because this process is irreversible, this conformation may become populated even in conditions where the native state is most stable.
FIGURE 2.

Native conformation of the RbAB domain. A, fraction of soluble RbAB protein remaining after a 1-h incubation at pH values ranging from pH 2.0 to pH 9.5. The fraction of protein remaining in solution was quantified by UV spectroscopy with the pH ranges where aggregation occurred marked as gray shaded areas. RbAB concentration was 1 μm. B, far-UV CD spectrum of the RbAB domain at pH 7.0 (full line) and 2.0 (broken line). C, ThT fluorescence emission spectrum in 100 mm citrate-Tris buffer in the presence of RbAB at pH 7.0 (full line) and 2.0 (broken line). The emission spectrum of ThT alone was subtracted from each trace. D, near-UV CD spectrum of the RbAB domain at pH 7.0 (full line) and 2.0 (broken line). Inset, RbAB tryptophan emission spectrum at pH 7.0 (full line) and 2.0 (broken line). E, ANS fluorescence emission spectrum in 100 mm citrate-Tris buffer in the presence of RbAB at pH 7.0 (full line) and 2.0 (broken line). The emission spectrum of ANS alone was subtracted from each trace. F, particle size distribution of a 10 μm RbAB sample at pH 7.0 (dark gray bars) and 2.0 (light gray bars) measured by dynamic light scattering. The average particle size populations were RS = 3.85 ± 0.07 nm (pH 7.0) and RS = 23 ± 4 nm (pH 2.0). AU, arbitrary units; deg, degrees. Error bars represent standard deviations.
RbAB Domain Unfolding Involves Two Cooperative Transitions
Although RbAB presented a native conformation at pH 7.0, small variations of ionic strength and temperature led to changes in its stability and solubility (not shown), suggesting that its conformational stability might be low even at neutral pH. This issue was investigated by using GdmCl to perturb the native state while monitoring secondary and tertiary structure changes by circular dichroism and tryptophan fluorescence. Concentrations up to 0.8 m GdmCl produced an increase in the far-UV CD band at 220 nm (Fig. 3A). This was accompanied by an increase in the intensity of the near-UV CD and tryptophan fluorescence signals (Fig. 3, B and C) with a slight shift in the tryptophan emission maximum (Fig. 3C), which suggested that at low GdmCl concentrations the RbAB domain remained folded but underwent a minor conformational rearrangement. We identified this state as RbAB-N* to differentiate it from the native state, RbAB-N. At 3.0 m GdmCl, RbAB presented a significant loss of secondary structure (Fig. 3A) as well as partial disruption of tertiary structure as shown by the decrease in the near-UV CD band and by the red shift in the tryptophan fluorescence maximum from 328 to 340 nm (Fig. 3, B and C). Finally, at 6.0 m GdmCl, RbAB was fully unfolded (RbAB-U) as indicated by a complete loss of the far- and near-UV CD signals (Fig. 3, A and B) and by a shift to 355 nm of the tryptophan emission maximum (Figs. 3C). Next, we analyzed the RbAB denaturation process by plotting the far-UV CD and tryptophan CSM signals as a function of GdmCl concentration (Fig. 3D). Two distinct cooperative unfolding transitions were evident that occurred around 1.0 and 4.5 m GdmCl, respectively. These transitions showed a concurrent loss of secondary and tertiary structure (Fig. 3D). The partially folded species populated between the first and second transitions was identified as RbAB-I given that its spectroscopic properties were similar to that of molten globule-like folding intermediates (Fig. 3, A–C).
FIGURE 3.

GdmCl equilibrium unfolding of the RbAB domain. Far-UV CD spectra (A), near-UV CD spectra (B), and intrinsic tryptophan fluorescence spectra (C) of 1 μm RbAB at 0 m GdmCl (full line), 0.8 m GdmCl (dashed line), 3 m GdmCl (dashed and dotted line), and 6 m GdmCl (dotted line) are shown. D, RbAB equilibrium unfolding transition followed by monitoring molar ellipticity at 220 nm (CD; open circles) and tryptophan fluorescence CSM (black circles). Protein concentration was 1 μm. Fits for each signal obtained from Equation 4 are plotted as full lines. E, fraction of N, I, and U species as a function of GdmCl concentration plotted using Equations 5–9 and the parameters obtained from fitting of the denaturation curves (Table 1). The species populated at different GdmCl concentrations are indicated above the graph. AU, arbitrary units; deg, degrees.
To define the best model to fit our experimental data (Fig. 3E), we assessed the oligomerization state of RbAB along the unfolding transition by DLS. As shown in Fig. 4, the RS values of RbAB were the same within experimental error at 0 and 0.8 m GdmCl (Fig. 4), indicating that RbAB remained monomeric before the first unfolding transition. The partly folded intermediate RbAB-I at 3.0 m GdmCl presented a particle size distribution (RS = 11.0 ± 1.5 nm) that was larger and more asymmetric than that of RbAB-N. The relationship RS(I)/RS(N) was 2.9, which is significantly larger than the reference value for monomeric intermediates (54) (1.1–1.2), indicating that under these conditions the intermediate formed oligomers of an estimated average size of 14 units (49) (see “Experimental Procedures”). Unfolded RbAB at 6.0 m GdmCl (RbAB-U) presented a monodisperse particle size distribution with RS = 8.8 ± 0.9 nm, which is in excellent agreement with the reference value for a denatured monomer of the same size (RS = 8.9 nm (49)). The relationship RS(U)/RS(N) = 2.3 also agreed with the value expected for denatured monomers (54) (1.3–2.0), confirming that RbAB-U was monomeric. We next explored whether the denaturation transitions showed a dependence on protein concentration as would be expected for an oligomeric intermediate. However, we did not find significant differences in the transition midpoints measured at 1 and 5 μm RbAB concentrations for either the CD or CSM signals. This could be due to the fact that the partly folded oligomer observed at the higher concentrations of the DLS experiments was not significantly populated at the lower concentrations of the equilibrium denaturation experiments. The data could be fit to a three-state denaturation model that considered the population of N, I, and unfolded (U) monomers (Fig. 3D and Scheme 1).
FIGURE 4.

RbAB particle size distribution at different GdmCl concentrations. Dynamic light scattering measurements of a 10 μm RbAB solution in 20 mm phosphate buffer, pH 7.0, 200 mm NaCl, and 2 mm DTT with different GdmCl concentrations. The GdmCl concentration and average Stokes radius (RS) for each condition is indicated inside each panel. Error bars represent standard deviations.
The CD and CSM signals were fitted separately, performing global fits for the experiments at 1 and 5 μm RbAB concentrations (Fig. 3D). From these fittings, we obtained the transition midpoints (C50 value), free energies of unfolding, and m-values for each transition, which are shown in Table 1. For both the N-I and the I-U transitions, the C50 values estimated from fitting of the CD and CSM signals were in excellent agreement, confirming that these transitions were characterized by a concurrent loss of secondary and tertiary structure (Table 1). The free energy of unfolding estimated from fitting of the CD and CSM signals had an average value of ΔGN-IH2O = 5.0 ± 1.5 kcal/mol for the N-I transition and an average value of ΔGI-UH2O = 32.0 ± 6.6 kcal/mol for the I-U transition. The ΔGH2O values obtained by fitting of the CD and CSM signals agreed within experimental error for both transitions (Table 1), lending further support to the three-state model used. The average total free energy of unfolding was ΔGN-UH2O = 36.5 ± 6.8 kcal/mol. The intermediate RbAB-I was the most stable species in solution, being fully populated in the 1.5–4.0 m GdmCl range (Fig. 3E), and the spectroscopic parameters estimated from the fit for RbAB-I confirmed that this species presented partial loss of secondary and tertiary structure (Table 1).
TABLE 1.
Thermodynamic parameters for RbAB equilibrium unfolding
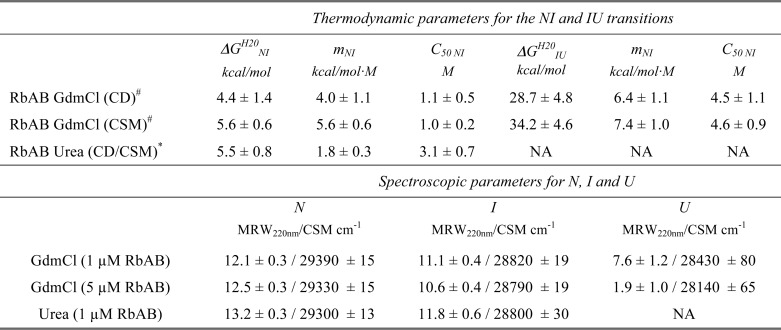
# Global fitting for each spectroscopic signal was performed on unfolding curves measured at 1 and 5 μm RbAB concentration.
* Global fitting for both spectroscopic signals was performed on unfolding curves measured at 1 μm RbAB concentration by normalizing the measured signals prior to fitting.
The m-values for the first and second transitions agreed within experimental error for both spectroscopic probes (Table 1). We obtained average m-values of 4.8 ± 1.3 kcal/mol·m for the N-I transition and 6.9 ± 1.5 kcal/mol·m for the I-U transition. These values corresponded to changes in accessible surface area of 17,900 Å2 for the N-I transition and 27,500 Å2 for the I-U transition (55). The N-I transition had an m-value corresponding to an average estimated number of 200 residues (55), which corresponded well with the size of the B subdomain and the flexible linker (180 residues), whereas the I-U transition had an m-value corresponding to an average estimated number of 300 residues (55), which agreed well with the size of the A subdomain (240 residues). The sum derived from the m-values (500 residues) corresponds well with the size of the entire RbAB domain construct (455 residues). Both the m-values and the fact that both the N-I and the I-U transitions were highly cooperative also suggested that each transition corresponded to the unfolding of a region of the RbAB domain with cooperatively folded structure, suggesting that the intermediate corresponded to a species in which one subdomain remained mainly folded, whereas the other subdomain was unfolded. The number of residues derived from the m-values suggested that the first transition corresponded to unfolding of the B subdomain.
Dissection of the RbAB Unfolding Transitions by Ligand Stabilization
To address the effect of ligands on RbAB domain stability, we performed experiments where we added RbAB-specific peptide ligands to the unfolding mixture. We used two peptides derived from viral and cellular partners that target the main binding surfaces in RbAB (Fig. 1). The first was the E7(16–31) peptide derived from the human papillomavirus type 16 E7 protein, which binds to the LXCXE cleft in the B subdomain (18), and the second was the E2F-TD peptide derived from the E2F2 transcription factor, which binds to the A/B interface (26) (see Table 3 and Fig. 1). Using GdmCl, we obtained very small shifts in the transition midpoints for both peptides (not shown) likely because the ionic nature of this chaotrope weakened the RbAB-ligand interactions (56). Therefore, we performed these experiments using urea as denaturant.
TABLE 3.
Effect of LXCXE and E2F peptide ligands on RbAB thermal stability
All measurements were performed at 2 μm RbAB and 20 μm peptides. Buffer was 20 mm sodium phosphate, pH 7, 2 mm DTT, and 0.01% Tween 20 at the specified NaCl concentration. Scan speed, 3 °C/min. NA, not assessed; pS, phosphoserine.
| Peptide | Sequencea | ΔTm(app) |
ΔGBINDb |
||
|---|---|---|---|---|---|
| 0.05 m NaCl | 0.6 m NaCl | 0.05 m NaCl | 0.6 m NaCl | ||
| °C | kcal/mol | ||||
| E7(16–31) | QPETTDLYCYEQLNDS | 10.6 ± 0.2 | 8.7 ± 0.2 | −12.6 | −10.6 |
| E7(16–40) | QPETTDLYCYEQLNDSSEEEDEIDG | 12.2 ± 0.2 | 8.8 ± 0.2 | −13.1 | −10.4 |
| E7(16–40)PP | QPETTDLYCYEQLNDpSpSEEEDEIDG | 12.5 ± 0.2 | 10.1 ± 0.2 | −14.4 | −11.0 |
| E7N HPV-16 | MHGDTPTLHEYMLDLQPETTDLYCYEQLNDSSEEEDEIDG | 12.5 ± 0.2 | NA | −13.4 | NA |
| E7N HPV-18 | MHGPKATLQDIVLHLEPQNEIPVDLLCHEQLSDSEEENDEIDG | 12.2 ± 0.2 | NA | −12.1 | NA |
| E7N HPV-11 | MHGRLVTLKDIVLDLQPPDPVGLHCYEQLEDSSEDEVDKVDK | 7.9 ± 0.2 | NA | −10.2 | NA |
| E2F2-TD | DDYLWGLEAGEGISDLFD | 9.4 ± 0.2c | NA | NA | NA |
a The HPV E7 LXCXE and the E2F-TD helix motifs are underlined and in bold.
b Values were taken from Ref. 56.
c Measurements were performed at 0.2 m NaCl.
As opposed to the two transitions observed with GdmCl, urea denaturation of the RbAB domain presented a single cooperative transition that presented concurrent changes of the CD and CSM signals (Fig. 5A). The far-UV CD signal increased at low denaturant concentrations as observed with GdmCl, indicating that the conformational rearrangement leading to RbAB-N* was also present in urea and ruling out that this effect was due to ionic strength. The state populated after the transition and up to 9.0 m urea was not completely unfolded as indicated by a high content of secondary structure and by a CSM signal corresponding to partial exposure of the tryptophan residues (Fig. 5, A and B). The CD spectrum of RbAB in 4.0 m urea after the unfolding transition was very similar to that of the RbAB intermediate populated in 3.0 m GdmCl (Fig. 5B). The species in 4.0 m urea was clearly not unfolded as shown by the difference between its CD spectrum and that of unfolded RbAB in 6.0 m GdmCl (Fig. 5B). The data could be globally fit to a two-state model (Fig. 5, A and C), yielding a C50 value of 3.1 ± 0.7 m, an m-value of 1.8 ± 0.3 kcal/mol·m, and a free energy of unfolding of 5.5 ± 0.8 kcal/mol, which is in excellent agreement with the ΔGH2O value for the N-I transition from GdmCl unfolding (Table 1). The spectroscopic parameters of the final state from urea experiments were undistinguishable from those of the GdmCl intermediate, and the difference in m-values for the N-I transition from GdmCl and the urea experiments (2.7-fold) was close to that expected considering the difference in denaturing power of both agents (55) (Table 1). This difference also likely explains why the second unfolding transition is not observed in urea because it would be expected to occur at C50 values of 10.4 m or higher (55), which are beyond the solubility of urea. In addition, the partially unfolded intermediate may be stabilized by ionic interactions that are disrupted by GdmCl but not by urea. Together, these results strongly suggested that the single transition observed in urea corresponded to the N-I transition from GdmCl experiments.
FIGURE 5.

Urea denaturation and effect of peptide ligands on RbAB equilibrium unfolding. A, RbAB equilibrium unfolding followed by molar ellipticity at 220 nm (CD; open circles) and tryptophan fluorescence CSM (black circles). Lines are global fits to a two-state denaturation model (Equation 10 and Table 1). Protein concentration was 1 μm. B, far-UV CD spectra of 1 μm RbAB in 0.3 m urea (full line), 4.0 m urea (dashed line), 3 m GdmCl (dotted line), and 6 m GdmCl (dashed and dotted line). C, fraction of native protein as a function of urea concentration for the isolated RbAB domain (CD, open circles; CSM, black circles) and for complexes of 1 μm RbAB with 10 μm E2FTD (CD, open triangles; CSM, black triangles) and 1 μm RbAB with 10 μm E7(16–31) (CD, open diamonds; CSM, black diamonds). Lines are global fits of the CD and CSM signals to Equation 14. Parameters from global fitting are reported in Tables 1 and 2. The species populated at different urea concentrations are depicted above the graphs. deg, degrees.
Next, we probed the effect of the E7(16–31) and E2F-TD peptides on the N-I transition. Both the E2F2-TD and the E7(16–31) peptides produced shifts in the unfolding transition midpoint of 0.8 and 2.2 molar units, respectively (Fig. 5C). We fitted the unfolding curves to a model that considers coupled binding and folding equilibriums and assumes that ligands bind only to the native state (Fig. 5C and Scheme 2).
This model allowed us to calculate the free energy of unfolding and binding, which was ΔGUNF,LIGH2O = 7.0 ± 0.2 kcal/mol for the RbAB·E2F2-TD complex and ΔGUNF,LIGH2O = 9.5 ± 0.1 kcal/mol for the RbAB·E7(16–31) complex (Table 2). The dissociation constants of the RbAB-ligand interactions calculated from this model were 1.1 ± 0.1·10−8 m for the RbAB·E7(16–31) complex and 8.6 ± 1.3·10−7 m for the RbAB·E2F2-TD complex, which are in very good agreement with the values previously reported from anisotropy or isothermal titration calorimetry measurements (2.1·10−9 m for RbAB·E7(16–31) (56) and 1.9·10−7 m for RbAB·E2F-TD (26); Table 2). This agreement supported our model, indicating that both ligands bound selectively to the native state and providing evidence that the native structures of both the LXCXE and the E2F binding clefts were disrupted in the partially folded intermediate. These results lent support to the picture arising from GdmCl unfolding that the first transition corresponded to unfolding of the B subdomain with the corresponding loss of the LXCXE binding surface. The disruption of the E2F binding cleft in the intermediate also fits with this scenario because unfolding of the B subdomain would also be expected to alter the native structure of the A/B interface where this binding site is located.
TABLE 2.
Effect of LXCXE and E2F peptide ligands on RbAB thermodynamic stability
| ΔGUNF,LIGa | C50a | KD,BINDa | KD,BINDb | |
|---|---|---|---|---|
| kcal/mol | m | m | m | |
| RbAB + E2F-TD | 7.0 ± 0.2 | 3.9 ± 0.6 | (8.6 ± 1.3) × 10−7 | (1.9 ± 0.4) × 10−7 (26)c |
| RbAB + E7(16–31) | 9.5 ± 0.1 | 5.3 ± 0.9 | (1.1 ± 0.1) × 10−8 | 2.1 × 10⁻⁹ (56)d |
a Values determined in this study. Global fitting was performed on unfolding curves measured in urea at 1 μm RbAB concentration and 10 μm peptide using the m-value and ΔGUNF value for the isolated RbAB domain determined in the urea unfolding of the isolated RbAB domain (Table 1). The measured CD and CSM signals were normalized prior to fitting.
b Values obtained from literature.
c KD measured by isothermal titration calorimetry.
d KD measured by fluorescence anisotropy.
Low RbAB Stability Leads to Irreversible Aggregation
The RbAB domain showed a propensity to aggregate over long incubation periods at room temperature, suggesting that its thermal stability might be low, in line with the chemical unfolding results. To test this hypothesis, we performed thermal scanning experiments where we monitored secondary structure changes as temperature was increased at a constant rate. Upon increasing temperature, RbAB showed a cooperative loss of native secondary structure accompanied by visible aggregation (Fig. 6A). The native conformation could not be recovered when temperature was decreased, indicating that the process was irreversible (Fig. 6, A and B). The CD spectrum of the final state was different from that of a disordered polypeptide and presented a single minimum at 225 nm (Fig. 6B), which indicated that thermal denaturation did not involve full unfolding of the domain and led to a misfolded RbAB species. As an approach to fit the experimental curves, we applied a simple kinetic model often used to describe irreversible thermal transitions (52) (Scheme 3 and “Experimental Procedures”).
FIGURE 6.

Irreversible thermal denaturation of the RbAB domain. A, RbAB irreversible thermal denaturation scans. The far-UV CD ellipticity signal at 220 nm was recorded as temperature increased from 20 to 80 °C (open circles) or decreased from 80 to 20 °C (black circles) at a scanning speed of 3 °C/min. Protein concentration was 2 μm in a 0.1-cm-path length cell. Data were fit to Equation 16 (see “Experimental Procedures”), obtaining a Tm(app) value of 52.2 ± 0.1 °C. Residuals are shown below the graph. B, far-UV CD spectra of the RbAB domain before thermal denaturation at 20 °C (full line), at the end point of the scan at 80 °C (broken line), and after decreasing temperature to 20 °C following denaturation (dotted line). mdeg, millidegrees.
From the curve shown in Fig. 6A, we obtained a Tm(app) of 52.2 ± 0.1. °C. The Tm(app) value was dependent on scan speed (not shown). This behavior is characteristic of irreversible thermal denaturation and indicates that the reaction is kinetically limited with Tm(app) being higher than the true melting temperature (57). At 0.5 °C/min, Tm(app) decreased to 42.7 ± 0.1 °C, indicating that RbAB thermal stability was low and suggesting that denaturation could occur spontaneously at physiological temperature.
To characterize the mechanism of RbAB thermal denaturation, we followed the time course of this process by monitoring the far-UV CD and elastic light scattering signals after transferring a concentrated RbAB stock kept in ice to buffer equilibrated at different temperatures. The RbAB domain was stable at 20 °C, whereas transfer to 37, 42, 45, and 50 °C led to protein aggregation. We chose to characterize the thermal denaturation process at 45 °C (Fig. 7). After transfer of 0.5 μm RbAB to 45 °C, we observed a time-dependent decrease in the intensity of the CD signal accompanied by a slower increase in light scattering that was indicative of aggregation (Fig. 7A). The time-dependent changes of the CD and scattering signals had different dependence on protein concentration: whereas at 0.5 μm RbAB the scattering signal showed a slower time course than the CD signal, at 4 μm RbAB, the time course of both signals was similar (Fig. 7, A and B). The CD kinetics was independent of protein concentration with an average half-time of 11 min, whereas the scattering kinetics were strongly dependent on protein concentration (Fig. 7C) but limited by the kinetics of the conformational change at high protein concentrations (Fig. 7B). These results suggested that although at low concentrations the reaction was limited by the polymerization process at high concentrations aggregation was limited by a conformational transition of the native monomer. The time-dependent measurements performed at multiple protein concentrations were next used to dissect the oligomerization mechanism.
FIGURE 7.

Isothermal denaturation kinetics of the RbAB domain. A, thermal denaturation kinetics followed after adding RbAB from a concentrated stock solution held at 4 °C to a 0.2-cm-path length cell containing buffer equilibrated at 45 °C. The final RbAB concentration was 0.5 μm. Light gray line, CD signal; black line, elastic scattering signal. B, thermal denaturation kinetics followed after adding RbAB from a concentrated stock solution held at 4 °C to a 0.2-cm-path length cell containing buffer equilibrated at 45 °C. The final RbAB concentration was 4 μm. Light gray line, CD signal; black line, elastic scattering signal. C, normalized light scattering signal as a function of time for RbAB concentrations ranging from 0.2 to 4 μm (right to left). The dashed lines indicate the area of the curves used for the nucleus size analysis. Each of the five data sets in D was obtained from time points within the dashed region. D, log-log plot of aggregate concentration as a function of free monomer concentration calculated according to Equation 17. Each data set represents values calculated for all total protein concentrations at a fixed time in the denaturation kinetics: 5 (filled circles), 10 (open circles), 15 (filled triangles), 20 (open triangles), and 25 min (filled squares). The size of the nucleus (2.3 ± 0.2) was calculated as an average of the slopes obtained for each data set. All linear fits had correlation values of r > 0.89. E, dependence of the speed of elongation (VE) on total RbAB concentration. Data points were fit to Equation 18, and the order of the reaction was obtained from the slope, which was 1.20 ± 0.01 (see “Experimental Procedures”). deg, degrees.
Both the CD and scattering signals presented a lag period followed by a growth phase, which are characteristic of nucleation-polymerization processes (53) (Fig. 7, A and B). The extent of aggregation and the changes in the far-UV CD signal normalized by concentration were similar for all protein concentrations (not shown), suggesting that a similar final state was reached in all reactions. To model the process, we used a kinetically limited model developed by Zlotnick et al. (53) in which an oligomerization nucleus formed during the lag phase influences the kinetics of aggregation (58) according to Equation 17 (see “Experimental Procedures”). In this model, [RbABagg] and [RbABmon] are the concentrations of RbAB aggregate and monomer, respectively, k is a constant, and n is the size of the oligomerization nucleus. We used the normalized scattering signal (Fig. 7C and “Experimental Procedures”) to calculate [RbABagg] and [RbABmon] at different time points in the aggregation kinetics for all RbAB concentrations tested (Fig. 7D). The size of the oligomerization nucleus was obtained from the average slope of the log-log plot of [RbABagg] as a function of [RbABmon], obtaining a value of 2.3 ± 0.2 (Fig. 7D). These results indicated that the oligomerization nucleus was an RbAB dimer. Finally, the order of the polymerization reaction was obtained from the slope of the log-log plot of elongation speed as a function of monomer concentration, obtaining a value of 1.20 ± 0.01 (Fig. 7E and “Experimental Procedures”), which indicated that the polymerization reaction was of first order with respect to RbAB.
Based on our results, we propose the following minimal model for RbAB thermal denaturation (Scheme 4). The first step in the reaction is a unimolecular conformational transition of the native RbAB monomer N to yield a non-native monomer, “M*.” In turn, M* progresses to form the dimeric aggregation nucleus M*2, and the reaction proceeds by the sequential addition of RbAB monomers, yielding a partially folded insoluble aggregate AN. Although at low concentrations the reaction is limited by the nucleation step (Scheme 4, Step B), at high concentrations, the conformational transition from N to M* becomes the rate-limiting reaction (Scheme 4, Step A).
SCHEME 4.
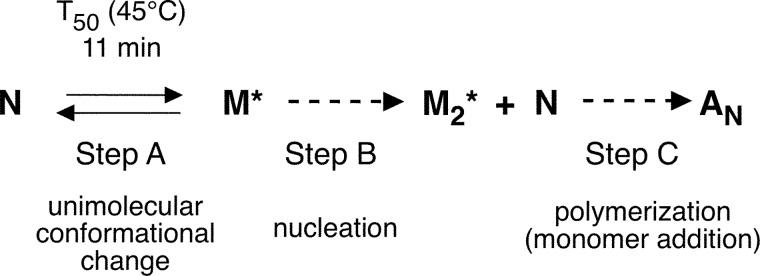
Minimal model for RbAB thermal denaturation.
LXCXE and E2F-TD Peptide Ligands Suppress Thermal Aggregation
Because the LXCXE and E2F-TD ligands stabilized RbAB in equilibrium unfolding experiments, we asked whether they also affected RbAB thermal stability because this could have direct implications for the stability of this domain in the cellular milieu. For this purpose, we measured the influence of peptide ligands on RbAB denaturation kinetics at 37 °C. The aggregation kinetics displayed a half-time of 28 min at 5 μm [RbAB], indicating that the RbAB monomer was marginally stable under these conditions. Next, we measured aggregation of RbAB·ligand complexes preassembled at 20 °C before the temperature jump. The high affinity of both ligands (Table 2) ensured that at the concentrations used in the experiment (5 μm RbAB and 20 μm peptides) all of the RbAB molecules were in complex with peptide during the preincubation period. Thermal denaturation following incubation with both ligands yielded a 5-fold lower scattering value compared with the isolated RbAB domain at the end point of the measurements (Fig. 8A). UV and CD measurements confirmed that in the presence of either E7(16–31) or E2F-TD over 95% of RbAB remained soluble and native at the end of the experiment (not shown), indicating that both ligands completely suppressed RbAB aggregation under these conditions and time window. Suppression of RbAB aggregation was not observed with a peptide from the bovine papillomavirus E7 N-terminal domain that does not contain the LXCXE motif or with BSA (not shown), strongly suggesting that this effect was specific to high affinity interactions. The time course of changes in the CD and scattering signals was similar at 5 μm [RbAB] (Fig. 8A), indicating that the reaction was limited by the conformational transition from N to M* (Scheme 4, Step A). The E7(16–31) and E2F-TD peptides slowed down this limiting step, suggesting that both ligands bound strongly to the native state N but weakly to M*. This indicated that the LXCXE and E2F binding surfaces were disrupted in M* similarly to what was observed for the intermediate RbAB-I from equilibrium denaturation experiments.
FIGURE 8.

Irreversible thermal denaturation of the RbAB domain at 37 °C and effect of LXCXE and E2F-TD peptide ligands on thermal stability. A, aggregation kinetics of the isolated RbAB domain at 37 °C and 5 μm concentration followed by light scattering (black line) and by far-UV CD (open circles) and aggregation kinetics of 5 μm RbAB in complex with 20 μm E7(16–31) peptide (dark gray line) or with 20 μm E2F-TD peptide (broken line) followed by light scattering. B, thermal scans of the isolated RbAB domain at 2 μm concentration (filled black circles; Tm(app) = 49.5 ± 0.1 °C) and of complexes of 2 μm RbAB domain with 20 μm E7(16–31) peptide (filled black triangles; Tm(app) = 60.1 ± 0.1 °C) or with 20 μm E2F-TD peptide (open black circles; Tm(app) = 58.9 ± 0.1 °C) (Table 2). Lines are fits to Equation 16. C, correlation between the binding free energy and the change in apparent melting temperature for a set of peptides containing the LXCXE motif (data are from Table 3). The line is a linear fit of the data (correlation coefficient r = 0.892). mdeg, millidegrees.
We further tested the effect of RbAB ligands on thermal stability by performing thermal scanning experiments of RbAB·ligand complexes at 0.05 m [NaCl]. Both complexes presented a marked increase in the Tm(app) value of 10.6 °C for RbAB·E7(16–31) and 9.4 °C for RbAB·E2F-TD (Fig. 8B and Table 3). The stabilization persisted at 1 m [NaCl], ruling out effects due to nonspecific ionic interactions of the acidic peptides with the basic RbAB domain (not shown). To analyze whether this effect was dependent on the affinity of the RbAB-ligand interactions, we performed experiments using a set of peptides containing the LXCXE motif from high risk (HPV-16 and -18) and low risk (HPV11) E7 proteins (Table 3). Because ionic strength is known to modulate the affinity of these interactions, we performed experiments at 0.05 and 0.6 m [NaCl], covering a range of affinities from the low nanomolar to the submicromolar range (56) (Table 3). We observed increases in the Tm(app) values for all peptides and conditions tested that ranged from 7.9 to 12.5 °C (Table 3). Using the previously known affinities of each RbAB·ligand complex (Table 3), we analyzed the correlation between the free energy of interaction and the Tm(app) values obtained for the different conditions. As shown in Fig. 8C, the magnitude of thermal stabilization showed a strong positive correlation with the free energy of interaction (r = 0.89). Taken together, these experiments showed that RbAB is marginally stable at 37 °C. Binding of ligands strongly stabilizes the native state against thermal aggregation with an early event in thermal denaturation corresponding to the loss of native structure of the LXCXE and E2F-TD binding sites (Figure 1). Moreover, stabilization is based on specific high affinity binding of the ligands to native RbAB, and the magnitude of stabilization correlates with the affinity of the RbAB-ligand interactions.
DISCUSSION
The acknowledgment that despite extensive sequence divergence TFIIB, cyclins, and Rb belong to the cyclin domain superfamily revealed a strikingly conserved architecture of proteins involved in cell cycle control and transcriptional signaling networks (23). TFIIB, cyclins, and Rb also share functions related to multisite protein recognition and present topologically conserved ligand binding sites (22). Because both the architecture and the protein recognition functions are conserved throughout eukaryotic evolution, the conformational properties of the RbAB pocket domain may reveal shared features of cyclin fold superfamily proteins. Our work reveals that the RbAB domain is marginally stable and that mild perturbations destabilize the native state, leading to oligomerization, population of partially folded states, and aggregation at temperatures compatible with living cells (Fig. 9). This suggests that the species populated in vitro may represent conformations accessible to the RbAB domain in vivo with equilibria being shifted by post-translational modifications, intracellular crowding, and protein and interdomain interactions (30) (Fig. 9). Although in vivo studies with full-length Rb will be required to address these issues, phosphorylation was recently shown to induce RbN-RbAB domain interactions that lead to a transition from an extended to a globular architecture (20, 42), highlighting Rb plasticity.
FIGURE 9.

RbAB conformational equilibria and possible effects of ligand binding, mutation, or phosphorylation. The diagram represents the native and non-native species populated by the RbAB domain. The RbAB ligand-bound form is derived from Protein Data Bank codes 1GUX and 1N4M with the LXCXE peptide in orange and the E2F-TD peptide in red. Tumorigenic mutations located in the RbAB hydrophobic core are mapped on the RbAB structure and shown as cyan spheres. Reversible processes are represented with double arrows, and irreversible processes are represented with one-way arrows with RbAB species where the B domain is unfolded marked in blue. Gray boxes indicate conformations that may be stabilized by tumorigenic mutations. Temp, temperature.
We found that the native state N can be in equilibrium with native-like states such as “N*,” which is stabilized under mild denaturing conditions. Although both N and N* are compact monomers with features compatible with the reported crystallographic structures (Fig. 1), N* presents small rearrangements with respect to N that include an increase in secondary structure and packing of aromatic residues with no changes in tryptophan exposure (Figs. 2, 3, and 5). This plasticity of the native state observed in vitro may correspond to a recently reported allosteric rearrangement of the relative orientations of the A and B subdomains that occurs upon phosphorylation of RbN and disrupts binding to the E2F cleft (20).
In addition, several perturbations lead to the population of partly folded and oligomeric conformations. These include the monomeric equilibrium folding intermediate I and the thermal denaturation intermediate M*, which are both unable to bind LXCXE and E2F ligands (Figs. 3, 5, 7, and 8). Although I forms limited (∼14-unit) soluble oligomers, “IN,” at high protein concentration (Fig. 4), M* also undergoes oligomerization, leading to the formation of insoluble aggregates, “AN” (Fig. 7). Although it is tempting to speculate that I and M* are conformationally equivalent species, further work will be required to assess this hypothesis. At low pH, RbAB forms large (∼120-unit) folded soluble oligomers, “IB,” with properties similar to the unfolding intermediate I and an increase in repetitive β-sheet structure (Fig. 2). Even when the pH tested is unlikely to occur within the cell, the fact that IB forms by an irreversible process may lead to an increase in the population of this conformation, particularly in the crowded cellular environment. These features are shared with the wild type p53 core domain, which also populates partially folded states that resemble mutant phenotypes at high pressure (59) and acquires a molten globule-like conformation at pH 5.0 (60).
The cyclin fold is found exclusively as a duplicated tandem in the cyclins, TFIIB, and Rb protein family members, suggesting that both repeats evolved together following early domain duplication (23, 61). Our work reveals differences between the equilibrium unfolding of RbAB and that of the only other characterized cyclin fold protein, Cyclin A2. Although Cyclin A2 presents a single unfolding transition (38), RbAB presents two distinct cooperative unfolding transitions with concurrent changes in secondary and tertiary structure and m-values that correspond well to the size of each subdomain. This difference in unfolding behavior may be due to the different number of helices that augment the cyclin fold in both proteins. Both the LXCXE and the E2F-TD clefts are disrupted in the equilibrium folding intermediate I, suggesting that the B subdomain and part of the A/B interface are unfolded, whereas the A subdomain remains folded. This would indicate that the stable A subdomain, which is able to fold independently (62), provides a scaffold for folding of the unstable B subdomain as seen in other large multidomain proteins (18, 63). The structural features of the RbAB domain with a large (2013-Å2) A/B interface continuous with the core of the B subdomain (18) fit well with this scenario. Because intermediates are rarely easy to isolate at equilibrium (64, 65), the fully populated RbAB folding intermediate provides an excellent opportunity for future structural characterization.
The average free energy of unfolding per residue for small to medium sized proteins, ΔG0/N, is 0.075 ± 0.037 kcal/mol·residue (66, 67). The first RbAB unfolding transition has a ΔG0 value of 5 kcal/mol at 20 °C and a ΔG0/N value of 0.025 kcal/mol·residue, which is below average and well below that of stable model proteins such as barnase and ubiquitin (with ΔG0/N values of 0.107 and 0.114 kcal/mol·residue, respectively) (66, 67). This low thermodynamic stability is shared with Cyclin A2 (ΔG0/N = 0.015 kcal/mol·residue) and with the marginally stable tumor suppressors p16INKA and p53CD (with ΔG0/N values of 0.020 and 0.028 kcal/mol·residue, respectively) (32, 38, 68). RbAB is also prone to aggregation at 37 °C and undergoes irreversible denaturation with a half-time of 28 min (Figs. 6, 7, and 8). This low thermal stability is also shared with Cyclin A2, p53CD, and p16INKA. The p53CD denatures spontaneously at 37 °C with a half-time of 9 min (36), and fast cycling between folded and unfolded states leads to aggregation by competition of the native state with off-pathway species (69, 70). Cyclin A2 is also thermally unstable and aggregation-prone with a melting temperature of 45 °C (38). The thermal stability of p16INKA has not been tested, but this protein has an unusual unfolding rate of less than 2 s at 25 °C, suggesting that its kinetic stability at physiological temperature is low (32). Therefore, the low thermodynamic and thermal stabilities of RbAB are properties shared with both cyclin fold and tumor suppressor proteins. Although it is tempting to speculate that RbAB marginal stability will have strong functional implications, future work will be required to gain a better understanding of Rb stability in vivo.
Marginal thermodynamic and thermal stabilities have strong consequences on the phenotype of cancer-related mutations. Several tumorigenic p53CD mutants produce critically unstable proteins that are unfolded in native conditions (37), and dominant negative effects could be explained by the “prion-like” behavior of p53 whereby destabilized aggregation-prone mutant proteins induce aggregation of wild type p53 (71, 72). Similarly, several p16INKA mutants are destabilized and yield partially folded or aggregated states (32). Studies from Rb also suggest that this “critical stability” may explain oncogenic phenotypes because low penetrant alleles R661W and C712R show partial growth suppression ability (73), are unstable in vivo, and require chaperone-like activity for their function (74, 75). Most tumorigenic missense mutations are located in the hydrophobic core of the RbAB domain (14), suggesting that as for p53CD these mutations may produce a decrease in stability below critical levels, leading to partial loss of function and the population of non-native conformations (Fig. 9).
The equilibrium between RbAB native and non-native states is strongly influenced by LXCXE and E2F-TA ligands, which strongly stabilize the native state (Figs. 5 and 8), suggesting that the RbAB domain may require inter- or intramolecular interactions to be held in its native conformation in vivo and that intracellular crowding may further modulate RbAB stability and aggregation propensity (Fig. 9). The degree of stabilization correlates with ligand binding free energy (Fig. 8), suggesting that the interaction affinity may determine the effects of different targets on RbAB in vivo. Cyclin A2 is also unstable in the absence of its ligands (38), suggesting that ligand stabilization may be a property shared by cyclin fold family members. The stabilizing effect of the LXCXE E7 peptide on RbAB may seem contradictory at first because full-length E7 induces proteasomal degradation of Rb in vivo through interaction with the Cullin-2 ubiquitin ligase complex (76). Although these differences stress the need for future studies that address the effects of ligands on Rb turnover, our results suggest that intermolecular interactions may provide an additional route to modulate Rb levels by regulating thermodynamic stability (31), hindering the accessibility of proteolytic sites.
In RbAB, the metastable B subdomain coevolved with a stable A subdomain required for its folding and stabilization. The LXCXE site in RbB mediates binding to cellular targets involved in chromatin remodeling and to viral oncoproteins that disrupt the network (56, 77). Unfolding of the metastable B subdomain in vivo may promote oligomerization, providing a “scaffold” for association of multiple protein targets and leading to alternate conformations that contribute to its role as a “hub protein.” Nevertheless, this hypothesis should be confirmed by in vivo stability analysis of the full-length protein. RbAB shares marginal stability, oligomerization, and ligand binding properties with Cyclin A2 (38), suggesting that conformational plasticity may be functionally conserved in cyclin fold family proteins (78). Coupling of folding, binding, and oligomerization could provide a robust mechanism to retain network topology and regulatory properties despite the differences between cell environments and components in the wide variety of organisms where Rb and cyclin fold proteins evolved (5).
Studies on the thermodynamic stability of tumor suppressors also provide a starting point for the development of therapeutic anticancer strategies as shown for unstable p53CD mutants that could be rescued by small peptides or by in silico screened molecules (33). Compounds that transiently inactivate Rb could also be used to promote the expansion of stem cell populations (4) with the strong medical relevance involved. Our results suggest that small ligands may have tunable effects on Rb stability that could be exploited for therapeutics. Further advances in these fronts will benefit from the understanding of the conformational equilibria, folding, and ligand interactions of the RbAB pocket domain.
This work was supported in part by a grant for basic research from the Instituto Nacional de Cancer (Ministerio de Salud de la Nación, Argentina).
- Rb
- retinoblastoma tumor suppressor
- HPV
- human papillomavirus
- TF
- transcription factor
- E2F-TD
- E2F transactivation domain
- p53CD
- p53 core domain
- DLS
- dynamic light scattering
- GdmCl
- guanidinium chloride
- ANS
- 1-anilinonaphtalene 8-sulfonate
- ThT
- thioflavin T
- CSM
- center of spectral mass
- N
- native monomer
- I
- partially folded intermediate
- U
- unfolded monomer
- A
- aggregate
- M
- non-native monomer.
REFERENCES
- 1. van den Heuvel S., Dyson N. J. (2008) Conserved functions of the pRB and E2F families. Nat. Rev. Mol. Cell Biol. 9, 713–724 [DOI] [PubMed] [Google Scholar]
- 2. Khidr L., Chen P. L. (2006) RB, the conductor that orchestrates life, death and differentiation. Oncogene 25, 5210–5219 [DOI] [PubMed] [Google Scholar]
- 3. Macaluso M., Montanari M., Giordano A. (2006) Rb family proteins as modulators of gene expression and new aspects regarding the interaction with chromatin remodeling enzymes. Oncogene 25, 5263–5267 [DOI] [PubMed] [Google Scholar]
- 4. Sage J. (2012) The retinoblastoma tumor suppressor and stem cell biology. Genes Dev. 26, 1409–1420 [DOI] [PMC free article] [PubMed] [Google Scholar]
- 5. Cross F. R., Buchler N. E., Skotheim J. M. (2011) Evolution of networks and sequences in eukaryotic cell cycle control. Philos. Trans. R. Soc. Lond. B Biol. Sci. 366, 3532–3544 [DOI] [PMC free article] [PubMed] [Google Scholar]
- 6. Gutzat R., Borghi L., Gruissem W. (2012) Emerging roles of RETINOBLASTOMA-RELATED proteins in evolution and plant development. Trends Plant Sci. 17, 139–148 [DOI] [PubMed] [Google Scholar]
- 7. Cao L., Peng B., Yao L., Zhang X., Sun K., Yang X., Yu L. (2010) The ancient function of RB-E2F pathway: insights from its evolutionary history. Biol. Direct 5, 55. [DOI] [PMC free article] [PubMed] [Google Scholar]
- 8. DeGregori J. (2004) The Rb network. J. Cell Sci. 117, 3411–3413 [DOI] [PubMed] [Google Scholar]
- 9. Burkhart D. L., Sage J. (2008) Cellular mechanisms of tumour suppression by the retinoblastoma gene. Nat. Rev. Cancer 8, 671–682 [DOI] [PMC free article] [PubMed] [Google Scholar]
- 10. zur Hausen H. (2009) Papillomaviruses in the causation of human cancers—a brief historical account. Virology 384, 260–265 [DOI] [PubMed] [Google Scholar]
- 11. McGivern D. R., Lemon S. M. (2011) Virus-specific mechanisms of carcinogenesis in hepatitis C virus associated liver cancer. Oncogene 30, 1969–1983 [DOI] [PMC free article] [PubMed] [Google Scholar]
- 12. Sastre-Garau X. (2011) Merkel cell carcinoma revisited: a new example of viro-induced human tumour. Pathol. Biol. 59, 127–130 [DOI] [PubMed] [Google Scholar]
- 13. Lohmann D. R. (1999) RB1 gene mutations in retinoblastoma. Hum. Mutat. 14, 283–288 [DOI] [PubMed] [Google Scholar]
- 14. Valverde J. R., Alonso J., Palacios I., Pestaña A. (2005) RB1 gene mutation up-date, a meta-analysis based on 932 reported mutations available in a searchable database. BMC Genet. 6, 53. [DOI] [PMC free article] [PubMed] [Google Scholar]
- 15. Sherr C. J., McCormick F. (2002) The RB and p53 pathways in cancer. Cancer Cell 2, 103–112 [DOI] [PubMed] [Google Scholar]
- 16. Knudsen E. S., Knudsen K. E. (2008) Tailoring to RB: tumour suppressor status and therapeutic response. Nat. Rev. Cancer 8, 714–724 [DOI] [PMC free article] [PubMed] [Google Scholar]
- 17. Hassler M., Singh S., Yue W. W., Luczynski M., Lakbir R., Sanchez-Sanchez F., Bader T., Pearl L. H., Mittnacht S. (2007) Crystal structure of the retinoblastoma protein N domain provides insight into tumor suppression, ligand interaction, and holoprotein architecture. Mol. Cell 28, 371–385 [DOI] [PMC free article] [PubMed] [Google Scholar]
- 18. Lee J. O., Russo A. A., Pavletich N. P. (1998) Structure of the retinoblastoma tumour-suppressor pocket domain bound to a peptide from HPV E7. Nature 391, 859–865 [DOI] [PubMed] [Google Scholar]
- 19. Rubin S. M., Gall A. L., Zheng N., Pavletich N. P. (2005) Structure of the Rb C-terminal domain bound to E2F1-DP1: a mechanism for phosphorylation-induced E2F release. Cell 123, 1093–1106 [DOI] [PubMed] [Google Scholar]
- 20. Burke J. R., Hura G. L., Rubin S. M. (2012) Structures of inactive retinoblastoma protein reveal multiple mechanisms for cell cycle control. Genes Dev. 26, 1156–1166 [DOI] [PMC free article] [PubMed] [Google Scholar]
- 21. Dick F. A. (2007) Structure-function analysis of the retinoblastoma tumor suppressor protein—is the whole a sum of its parts? Cell Div. 2, 26. [DOI] [PMC free article] [PubMed] [Google Scholar]
- 22. Noble M. E., Endicott J. A., Brown N. R., Johnson L. N. (1997) The cyclin box fold: protein recognition in cell-cycle and transcription control. Trends Biochem. Sci. 22, 482–487 [DOI] [PubMed] [Google Scholar]
- 23. Gibson T. J., Thompson J. D., Blocker A., Kouzarides T. (1994) Evidence for a protein domain superfamily shared by the cyclins, TFIIB and RB/p107. Nucleic Acids Res. 22, 946–952 [DOI] [PMC free article] [PubMed] [Google Scholar]
- 24. Isaac C. E., Francis S. M., Martens A. L., Julian L. M., Seifried L. A., Erdmann N., Binné U. K., Harrington L., Sicinski P., Bérubé N. G., Dyson N. J., Dick F. A. (2006) The retinoblastoma protein regulates pericentric heterochromatin. Mol. Cell. Biol. 26, 3659–3671 [DOI] [PMC free article] [PubMed] [Google Scholar]
- 25. Coschi C. H., Martens A. L., Ritchie K., Francis S. M., Chakrabarti S., Berube N. G., Dick F. A. (2010) Mitotic chromosome condensation mediated by the retinoblastoma protein is tumor-suppressive. Genes Dev. 24, 1351–1363 [DOI] [PMC free article] [PubMed] [Google Scholar]
- 26. Lee C., Chang J. H., Lee H. S., Cho Y. (2002) Structural basis for the recognition of the E2F transactivation domain by the retinoblastoma tumor suppressor. Genes Dev. 16, 3199–3212 [DOI] [PMC free article] [PubMed] [Google Scholar]
- 27. de Souza R. F., Iyer L. M., Aravind L. (2010) Diversity and evolution of chromatin proteins encoded by DNA viruses. Biochim. Biophys. Acta 1799, 302–318 [DOI] [PMC free article] [PubMed] [Google Scholar]
- 28. Cremades N., Sancho J., Freire E. (2006) The native-state ensemble of proteins provides clues for folding, misfolding and function. Trends Biochem. Sci. 31, 494–496 [DOI] [PubMed] [Google Scholar]
- 29. Gidalevitz T., Kikis E. A., Morimoto R. I. (2010) A cellular perspective on conformational disease: the role of genetic background and proteostasis networks. Curr. Opin. Struct. Biol. 20, 23–32 [DOI] [PMC free article] [PubMed] [Google Scholar]
- 30. Dobson C. M. (2003) Protein folding and misfolding. Nature 426, 884–890 [DOI] [PubMed] [Google Scholar]
- 31. Khoo K. H., Mayer S., Fersht A. R. (2009) Effects of stability on the biological function of p53. J. Biol. Chem. 284, 30974–30980 [DOI] [PMC free article] [PubMed] [Google Scholar]
- 32. Tang K. S., Guralnick B. J., Wang W. K., Fersht A. R., Itzhaki L. S. (1999) Stability and folding of the tumour suppressor protein p16. J. Mol. Biol. 285, 1869–1886 [DOI] [PubMed] [Google Scholar]
- 33. Joerger A. C., Fersht A. R. (2008) Structural biology of the tumor suppressor p53. Annu. Rev. Biochem. 77, 557–582 [DOI] [PubMed] [Google Scholar]
- 34. Freed-Pastor W. A., Prives C. (2012) Mutant p53: one name, many proteins. Genes Dev. 26, 1268–1286 [DOI] [PMC free article] [PubMed] [Google Scholar]
- 35. Witkiewicz A. K., Knudsen K. E., Dicker A. P., Knudsen E. S. (2011) The meaning of p16(ink4a) expression in tumors: functional significance, clinical associations and future developments. Cell Cycle 10, 2497–2503 [DOI] [PMC free article] [PubMed] [Google Scholar]
- 36. Friedler A., Veprintsev D. B., Hansson L. O., Fersht A. R. (2003) Kinetic instability of p53 core domain mutants: implications for rescue by small molecules. J. Biol. Chem. 278, 24108–24112 [DOI] [PubMed] [Google Scholar]
- 37. Bullock A. N., Henckel J., Fersht A. R. (2000) Quantitative analysis of residual folding and DNA binding in mutant p53 core domain: definition of mutant states for rescue in cancer therapy. Oncogene 19, 1245–1256 [DOI] [PubMed] [Google Scholar]
- 38. Wang X., Ren J., Qu X. (2008) Biophysical studies on the full-length human cyclin A2: protein stability and folding/unfolding thermodynamics. J. Phys. Chem. B 112, 8346–8353 [DOI] [PubMed] [Google Scholar]
- 39. Grossmann J. G., Sharff A. J., O'Hare P., Luisi B. (2001) Molecular shapes of transcription factors TFIIB and VP16 in solution: implications for recognition. Biochemistry 40, 6267–6274 [DOI] [PubMed] [Google Scholar]
- 40. Hayashi F., Ishima R., Liu D., Tong K. I., Kim S., Reinberg D., Bagby S., Ikura M. (1998) Human general transcription factor TFIIB: conformational variability and interaction with VP16 activation domain. Biochemistry 37, 7941–7951 [DOI] [PubMed] [Google Scholar]
- 41. Harbour J. W., Luo R. X., Dei Santi A., Postigo A. A., Dean D. C. (1999) Cdk phosphorylation triggers sequential intramolecular interactions that progressively block Rb functions as cells move through G1. Cell 98, 859–869 [DOI] [PubMed] [Google Scholar]
- 42. Lamber E. P., Beuron F., Morris E. P., Svergun D. I., Mittnacht S. (2013) Structural insights into the mechanism of phosphoregulation of the retinoblastoma protein. PLoS One 8, e58463. [DOI] [PMC free article] [PubMed] [Google Scholar]
- 43. Ang H. C., Joerger A. C., Mayer S., Fersht A. R. (2006) Effects of common cancer mutations on stability and DNA binding of full-length p53 compared with isolated core domains. J. Biol. Chem. 281, 21934–21941 [DOI] [PubMed] [Google Scholar]
- 44. Mayer S., Rüdiger S., Ang H. C., Joerger A. C., Fersht A. R. (2007) Correlation of levels of folded recombinant p53 in Escherichia coli with thermodynamic stability in vitro. J. Mol. Biol. 372, 268–276 [DOI] [PubMed] [Google Scholar]
- 45. Nichols N. M., Matthews K. S. (2002) Human p53 phosphorylation mimic, S392E, increases nonspecific DNA affinity and thermal stability. Biochemistry 41, 170–178 [DOI] [PubMed] [Google Scholar]
- 46. Natan E., Baloglu C., Pagel K., Freund S. M., Morgner N., Robinson C. V., Fersht A. R., Joerger A. C. (2011) Interaction of the p53 DNA-binding domain with its N-terminal extension modulates the stability of the p53 tetramer. J. Mol. Biol. 409, 358–368 [DOI] [PMC free article] [PubMed] [Google Scholar]
- 47. Chemes L. B., Sánchez I. E., Smal C., de Prat-Gay G. (2010) Targeting mechanism of the retinoblastoma tumor suppressor by a prototypical viral oncoprotein. Structural modularity, intrinsic disorder and phosphorylation of human papillomavirus E7. FEBS J. 277, 973–988 [DOI] [PubMed] [Google Scholar]
- 48. Pace C. N., Vajdos F., Fee L., Grimsley G., Gray T. (1995) How to measure and predict the molar absorption coefficient of a protein. Protein Sci. 4, 2411–2423 [DOI] [PMC free article] [PubMed] [Google Scholar]
- 49. Uversky V. N. (1993) Use of fast protein size-exclusion liquid chromatography to study the unfolding of proteins which denature through the molten globule. Biochemistry 32, 13288–13298 [DOI] [PubMed] [Google Scholar]
- 50. Baker B. M., Murphy K. P. (1996) Evaluation of linked protonation effects in protein binding reactions using isothermal titration calorimetry. Biophys. J. 71, 2049–2055 [DOI] [PMC free article] [PubMed] [Google Scholar]
- 51. Rodriguez-Larrea D., Minning S., Borchert T. V., Sanchez-Ruiz J. M. (2006) Role of solvation barriers in protein kinetic stability. J. Mol. Biol. 360, 715–724 [DOI] [PubMed] [Google Scholar]
- 52. Sanchez-Ruiz J. M. (1992) Theoretical analysis of Lumry-Eyring models in differential scanning calorimetry. Biophys. J. 61, 921–935 [DOI] [PMC free article] [PubMed] [Google Scholar]
- 53. Zlotnick A., Johnson J. M., Wingfield P. W., Stahl S. J., Endres D. (1999) A theoretical model successfully identifies features of hepatitis B virus capsid assembly. Biochemistry 38, 14644–14652 [DOI] [PubMed] [Google Scholar]
- 54. Gast K., Modler A. J. (2005) in Protein Folding Handbook (Buchner J., Kiefhaber T., eds) pp. 673–704, Wiley-VCH, Weinheim, Germany [Google Scholar]
- 55. Myers J. K., Pace C. N., Scholtz J. M. (1995) Denaturant m values and heat capacity changes: relation to changes in accessible surface areas of protein unfolding. Protein Sci. 4, 2138–2148 [DOI] [PMC free article] [PubMed] [Google Scholar]
- 56. Chemes L. B., Sánchez I. E., de Prat-Gay G. (2011) Kinetic recognition of the retinoblastoma tumor suppressor by a specific protein target. J. Mol. Biol. 412, 267–284 [DOI] [PubMed] [Google Scholar]
- 57. Lepock J. R., Ritchie K. P., Kolios M. C., Rodahl A. M., Heinz K. A., Kruuv J. (1992) Influence of transition rates and scan rate on kinetic simulations of differential scanning calorimetry profiles of reversible and irreversible protein denaturation. Biochemistry 31, 12706–12712 [DOI] [PubMed] [Google Scholar]
- 58. Smal C., Alonso L. G., Wetzler D. E., Heer A., de Prat Gay G. (2012) Ordered self-assembly mechanism of a spherical oncoprotein oligomer triggered by zinc removal and stabilized by an intrinsically disordered domain. PLoS One 7, e36457. [DOI] [PMC free article] [PubMed] [Google Scholar]
- 59. Ishimaru D., Maia L. F., Maiolino L. M., Quesado P. A., Lopez P. C., Almeida F. C., Valente A. P., Silva J. L. (2003) Conversion of wild-type p53 core domain into a conformation that mimics a hot-spot mutant. J. Mol. Biol. 333, 443–451 [DOI] [PubMed] [Google Scholar]
- 60. Bom A. P., Freitas M. S., Moreira F. S., Ferraz D., Sanches D., Gomes A. M., Valente A. P., Cordeiro Y., Silva J. L. (2010) The p53 core domain is a molten globule at low pH: functional implications of a partially unfolded structure. J. Biol. Chem. 285, 2857–2866 [DOI] [PMC free article] [PubMed] [Google Scholar]
- 61. Gunbin K. V., Suslov V. V., Turnaev I. I., Afonnikov D. A., Kolchanov N. A. (2011) Molecular evolution of cyclin proteins in animals and fungi. BMC Evol. Biol. 11, 224. [DOI] [PMC free article] [PubMed] [Google Scholar]
- 62. Kim H. Y., Cho Y. (1997) Structural similarity between the pocket region of retinoblastoma tumour suppressor and the cyclin-box. Nat. Struct. Biol. 4, 390–395 [DOI] [PubMed] [Google Scholar]
- 63. Han J. H., Batey S., Nickson A. A., Teichmann S. A., Clarke J. (2007) The folding and evolution of multidomain proteins. Nat. Rev. Mol. Cell Biol. 8, 319–330 [DOI] [PubMed] [Google Scholar]
- 64. Brockwell D. J., Radford S. E. (2007) Intermediates: ubiquitous species on folding energy landscapes? Curr. Opin. Struct. Biol. 17, 30–37 [DOI] [PMC free article] [PubMed] [Google Scholar]
- 65. Silva J. L., Cordeiro Y., Foguel D. (2006) Protein folding and aggregation: two sides of the same coin in the condensation of proteins revealed by pressure studies. Biochim. Biophys. Acta 1764, 443–451 [DOI] [PubMed] [Google Scholar]
- 66. Xiao S., Raleigh D. P. (2010) A critical assessment of putative gatekeeper interactions in the villin headpiece helical subdomain. J. Mol. Biol. 401, 274–285 [DOI] [PubMed] [Google Scholar]
- 67. Robertson A. D., Murphy K. P. (1997) Protein structure and the energetics of protein stability. Chem. Rev. 97, 1251–1268 [DOI] [PubMed] [Google Scholar]
- 68. Bullock A. N., Henckel J., DeDecker B. S., Johnson C. M., Nikolova P. V., Proctor M. R., Lane D. P., Fersht A. R. (1997) Thermodynamic stability of wild-type and mutant p53 core domain. Proc. Natl. Acad. Sci. U.S.A. 94, 14338–14342 [DOI] [PMC free article] [PubMed] [Google Scholar]
- 69. Butler J. S., Loh S. N. (2006) Folding and misfolding mechanisms of the p53 DNA binding domain at physiological temperature. Protein Sci. 15, 2457–2465 [DOI] [PMC free article] [PubMed] [Google Scholar]
- 70. Butler J. S., Loh S. N. (2005) Kinetic partitioning during folding of the p53 DNA binding domain. J. Mol. Biol. 350, 906–918 [DOI] [PubMed] [Google Scholar]
- 71. Ano Bom A. P., Rangel L. P., Costa D. C., de Oliveira G. A., Sanches D., Braga C. A., Gava L. M., Ramos C. H., Cepeda A. O., Stumbo A. C., De Moura Gallo C. V., Cordeiro Y., Silva J. L. (2012) Mutant p53 aggregates into prion-like amyloid oligomers and fibrils: implications for cancer. J. Biol. Chem. 287, 28152–28162 [DOI] [PMC free article] [PubMed] [Google Scholar]
- 72. Xu J., Reumers J., Couceiro J. R., De Smet F., Gallardo R., Rudyak S., Cornelis A., Rozenski J., Zwolinska A., Marine J. C., Lambrechts D., Suh Y. A., Rousseau F., Schymkowitz J. (2011) Gain of function of mutant p53 by coaggregation with multiple tumor suppressors. Nat. Chem. Biol. 7, 285–295 [DOI] [PubMed] [Google Scholar]
- 73. Kratzke R. A., Otterson G. A., Hogg A., Coxon A. B., Geradts J., Cowell J. K., Kaye F. J. (1994) Partial inactivation of the RB product in a family with incomplete penetrance of familial retinoblastoma and benign retinal tumors. Oncogene 9, 1321–1326 [PubMed] [Google Scholar]
- 74. Park Y., Kubo A., Komiya T., Coxon A., Beebe K., Neckers L., Meltzer P. S., Kaye F. J. (2008) Low-penetrant RB allele in small-cell cancer shows geldanamycin instability and discordant expression with mutant ras. Cell Cycle 7, 2384–2391 [DOI] [PMC free article] [PubMed] [Google Scholar]
- 75. Otterson G. A., Modi S., Nguyen K., Coxon A. B., Kaye F. J. (1999) Temperature-sensitive RB mutations linked to incomplete penetrance of familial retinoblastoma in 12 families. Am. J. Hum. Genet. 65, 1040–1046 [DOI] [PMC free article] [PubMed] [Google Scholar]
- 76. Huh K., Zhou X., Hayakawa H., Cho J. Y., Libermann T. A., Jin J., Harper J. W., Munger K. (2007) Human papillomavirus type 16 E7 oncoprotein associates with the cullin 2 ubiquitin ligase complex, which contributes to degradation of the retinoblastoma tumor suppressor. J. Virol. 81, 9737–9747 [DOI] [PMC free article] [PubMed] [Google Scholar]
- 77. Singh M., Krajewski M., Mikolajka A., Holak T. A. (2005) Molecular determinants for the complex formation between the retinoblastoma protein and LXCXE sequences. J. Biol. Chem. 280, 37868–37876 [DOI] [PubMed] [Google Scholar]
- 78. Tokuriki N., Tawfik D. S. (2009) Protein dynamism and evolvability. Science 324, 203–207 [DOI] [PubMed] [Google Scholar]