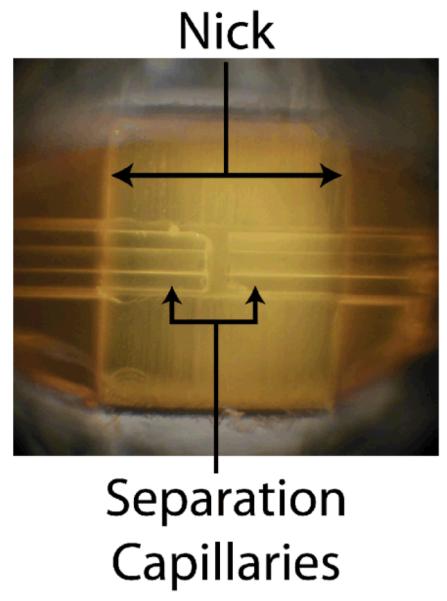
Abstract
We report an improved interface for two-dimensional capillary electrophoresis. This interface is based on capillary tubing and a Plexiglas chip, both of which were milled using a micro-dicing saw. The interface was evaluated and compared to a traditional interface design for both pseudo one-dimensional and two-dimensional capillary electrophoresis. We observe less than 70% transfer efficiency for the traditional design and greater than 90% transfer efficiency with this new interface.
Keywords: capillary electrophoresis, interface design, laser-induced fluorescence, two-dimensional capillary electrophoresis
Introduction
Capillary electrophoresis (CE) is a powerful tool for the separation of complex mixtures.1–9 When very complex samples, such as cell homogenates, are investigated, a single separation is incapable of resolving all of the components present. For complex mixtures it is often beneficial to couple additional separation methods to improve resolution.10 Jorgenson's group demonstrated the coupling of liquid chromatography to capillary electrophoresis in the 1980s.11 In these experiments fractions were periodically transferred to a fused silica capillary for separation in the second dimension by capillary electrophoresis. Those systems were unable to halt flow in the first dimension. The vast majority of analyte that was separated by the liquid chromatography column would flow to waste and only a small fraction was transferred to the second dimension for electrophoretic separation.
Michels et al. demonstrated the first example of a two-dimensional CE (2D-CE) separation.6 In this experiment, proteins from a cell lysate were separated by submicellar concentrations of sodium dodecyl sulfate (SDS); the first dimension buffer had a pH of 7.5 and the second dimension buffer had a pH of 11.1. By using CE in both dimensions it is relatively easy to adjust the voltage across the first capillary such that flow of analyte from the first dimension is halted while separation is still being performed in the second dimension. The majority of 2D-CE experiments that are performed use some combination of capillary zone electrophoresis, capillary sieving electrophoresis, micellar electrokinetic capillary chromatography, and isoelectric focusing.12–17 For example, Chen et al. used CSE-MEKC to analyze the proteins in a mouse tumor cell homogenate.9 The authors investigated the effects of CSE buffer components on separation efficiency and were able to resolve about 60 spots corresponding to different proteins. Additionally, variations of 2D-CE have been used for diagonal CE and on-column digestion of proteins.18–20
The key to the performance of a 2D separation is the design and construction of an efficient, leak free interface that connects the two dimensions. Most systems are designed to immobilize the two capillaries independently.6–9,12–14,16,18–20 The separation capillaries are manually aligned within a chamber to maximize coaxial overlap. This chamber is then filled with the second dimension separation buffer and connected to a high voltage power supply to control sample flow. Construction and alignment of these interfaces require exceptional dexterity while working under a microscope.
In this manuscript we report the use of a micro-dicing saw to nick a sleeve capillary that is then used as an aligning tool. This nicked sleeve capillary facilitates rapid coaxial alignment of the separation capillaries used in 2D-CE separations. As we show, this system produces more efficient fraction transfers and improves precision with respect to peak area.
Experimental
Materials
All capillaries were obtained from Polymicro Technologies (Phoenix, AZ). Buffer reagents were purchased from Sigma-Aldrich (St. Louis, MO).
Interface Fabrication and Sleeve Capillary Nicking
Interfaces were made from Plexiglas microscope slides. Each microscope slide yielded two Plexiglas chips by cutting the slide in half along its short axis. The Plexiglas chip and sleeve capillaries were first immobilized by use of two types of specialty tape from Semiconductor Equipment Corp (Moorpark, CA. USA). The first, medium tack tape, was placed on the underside of a film frame from Perfection Products (Lebanon, IN. USA) with the adhesive side facing upward. Vacuum holds the film frame/medium tack tape in place. Once the medium tack tape is attached to the film frame and all air bubbles are removed, a ~2 × 5 cm piece of heat-release tape is put on the sticky side of the medium-tack tape, with the heat-release tape's adhesive side facing upward. The material that will be cut by the saw is then placed onto the heat release tape and a second piece of heat release tape is placed, adhesive side down, on top of the material. When the adhesive sides of the heat release tape come into contact, the adhesive holds until it is heated to its release temperature. After cutting, a Milwaukee Model MHT3300 heat gun was used to inactivate the heat release tape and release the components.
The interfaces were fabricated from 2 mm thick Plexiglas microscope slides from Exakt Technologies Inc. (Oklahoma City, OK) using a micro-dicing saw (Micro Automation Model 1100) with 500 μm thick diamond blades from Thermocarbon Inc. (Casselberry, FL). This micro-dicing saw was used to cut two perpendicular channels in a Plexiglas chip. The width and depth of the two channels differed slightly. The channel that contained the buffer line and waste was cut to be 1 mm wide and 1 mm deep to hold the 1.0 mm OD, 0.50 mm ID borosilicate glass tubes. This buffer plumbing delivers separation buffer for interface flushing and electrical contact. The channel that was perpendicular to the buffer channel holds the sleeve and separation capillaries. This channel was cut to be approximately 700 μm in width and 700 μm in depth. After assembly, the interfaces are sealed by placing a cover slide on top of the Plexiglas chip.
Traditional interfaces use separate sleeve capillaries for each separation capillary, as shown in Fig. 1. Fabrication of a traditional interface requires exceptional dexterity while working under a microscope. The alignment of the separation capillaries and ultimately the performance of the traditional interface heavily depend on the skill of the constructor of the interface.
Fig. 1.
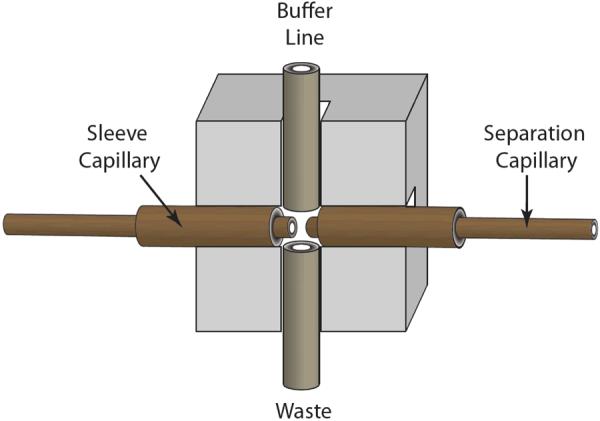
Top view diagram of a tradition 2D-CE interface.
The nicked sleeve capillary interface used a sleeve capillary (152 μm ID, 650 μm OD) that was cut approximately halfway through the inner diameter, resulting in a nick that exposed the inner diameter of the sleeve capillary, while maintaining an adequate amount of supporting capillary under the nick (Figure 2). The sleeve capillary was nicked using the micro-dicing saw and diamond blades.
Fig. 2.
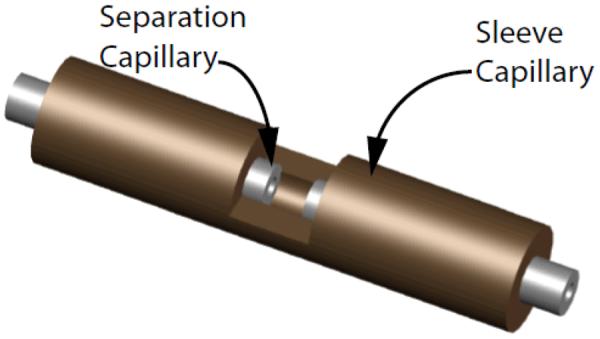
Nicked sleeve capillary with separation capillaries.
Nicking the capillary halfway through the inner diameter is straightforward when using the micro-dicing saw. The chuck is first “zeroed” by bringing the diamond blade into contact with the chuck, and the computer then stores alignment as zero elevation above the chuck. All subsequent cuts are made by telling the saw how far above that zero elevation the desired cut should be (see supporting information for figures). Since the thicknesses of the tapes being used and the capillary are accurately known, nicking of the sleeve capillary becomes trivial by programming the saw to cut an appropriate distance above the cuck.
All components in both interfaces were immobilized using an intercalating, ultraviolet light curing resin from Kemxert Corporation (York, PA). The polyimide coating was removed from both ends of the separation capillaries with a gentle flame. Coating removal eliminates interference with injections that could result from excess polyimide left over from cleaving the capillary. Removal of the polyimide coating also simplifies threading of the separation capillary into the sleeve capillary. Separation capillaries were secured in the sleeve capillaries by a drop of epoxy applied to the point where the separation capillaries exited the sleeve capillary.
Fluorescence detector
The laser-induced fluorescence detector that was used for these experiments has been described elsewhere.21 Briefly, fluorescence was excited in a sheath flow cuvette using a CW 532 nm diode-pumped laser (CrystaLaser Model CL532-025) and fluorescence was collected at right angles from the incident laser beam. Fluorescence was detected using a single-photon counting avalanche photodiode module (PerkinElmer, Montreal, PQ Canada).
Transfer Efficiency Evaluation
One-dimensional capillary electrophoresis (1D-CE) was performed in a single, intact fused silica capillary (40.0 cm long, 50 μm ID, 150 μm OD). The peak area from the 1D-CE data set was used as the threshold for 100% transfer efficiency.
Two-dimensional capillary electrophoresis (2D-CE) was performed using a traditional interface (Figure 3), and the nicked sleeve interface (Figure 4). A total of six interfaces were evaluated, three traditional and three nicked sleeve. The separation capillaries for 2D-CE interfaces were each 40.0 cm long, 50 μm ID, 150 μm OD fused silica capillaries for a total separation capillary length of 80 cm. The interfaces were subjected to two types of transfer efficiency evaluations. The first was the operation of the 2D interface in pseudo-1D mode, where potential was continuously applied across both capillaries and the same electric field strength was applied to both capillaries.
Fig. 3.
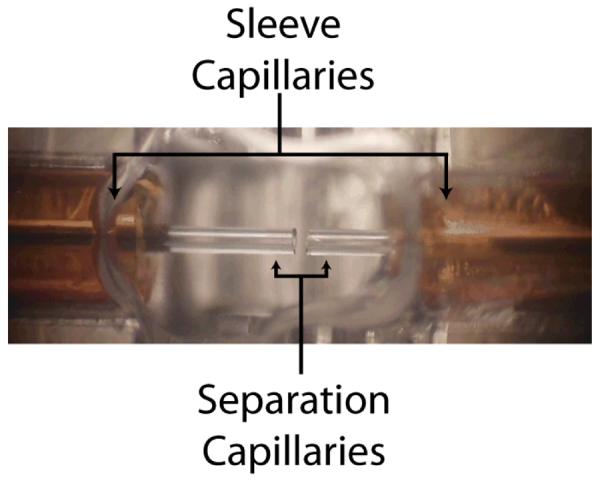
Traditional two-dimensional interface.
Fig. 4.
Nicked sleeve capillary two-dimensional interface.
Transfer efficiency was also evaluated in 2D mode. In this experiment, plugs were transferred from the first capillary to the second capillary. Upon the transfer of a plug into the second dimension, separation in the first dimension was halted by applying the same voltage at the injection block and the interface. In all experiments, the sheath flow cuvette was held at ground potential.
Electrophoresis
A 15 mM borate buffer was used for the experiment. High voltage power supplies (Spellman, Newark NJ USA) provided voltages for the separations. For the 1D-CE experiment, a constant potential of 10 kV was applied. For the 2D-CE experiments, electrical contact was made with the interface by attaching Tygon ® R-3603 tubing to the buffer line (Fig. 1), which was then placed in an Eppendorf tube with a platinum electrode that was connected to the second power supply. During pseudo-1D experiments, the injection block and the interface were held at 20 kV and 10 kV, respectively, producing uniform electric field in the capillaries. In 2D separations, a voltage program was used that held the interface at a constant potential of 10 kV, while the voltage at the injection block was varied as shown in Table 1. The sample used was 5-carboxyl tetramethylrhodamine succinimidyl ester (TAMRA) at a concentration of 100 pM (AnaSpec, Inc.; Fremont, CA USA). All sample injections were performed at 5 kV for 5 seconds; in 2D experiments the interface was held at ground potential.
Table 1.
Voltage Program for 2D Separations
| Injection Block Voltage (kV) | Interface Voltage (kV) | Time (seconds) | |
|---|---|---|---|
| Transfer | 20 | 10 | 1 |
| Separation | 10 | 10 | 10 |
Data processing
Data processing was performed with Matlab on a PC. Data were treated with a three-point median filter to remove spikes generated by particulates passing through the laser beam. The two-dimensional data was reconstructed from the one-dimensional raw data as described earlier.8
Results and Discussion
Transfer efficiency
Peak area was used to compare transfer efficiencies of the traditional and nicked sleeve interfaces. Triplicate data sets were obtained for all experiments using a total of six interfaces, three traditional and three nicked sleeve. As a comparison between 1D-CE and 2D-CE, Figure 5 shows normalized peak height and migration time for a 1D and pseudo-1D run on the same axis. The efficiency of the 1D and pseudo-1D run were 200,000 and 250,000 theoretical plates, respectively. The minor increase in the pseudo-1D operation likely is a result of the larger column volume, which reduces the contribution of injection volume as a source of extra-column band broadening. A representative 2D-CE electropherogram is shown in Figure 6.
Fig. 5.
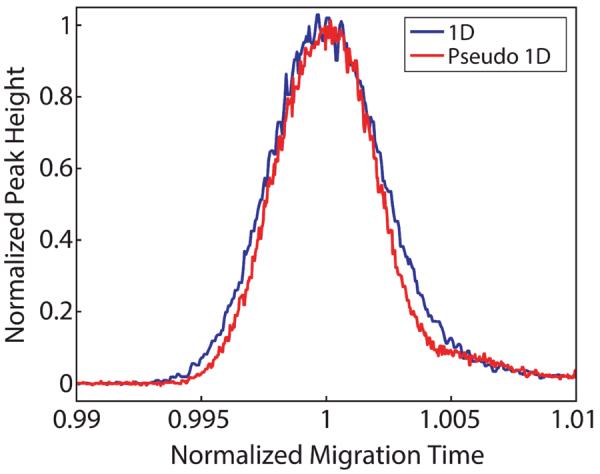
Normalized migration time and peak height to show the difference between the TAMRA peak from 1D and pseudo 1D experiments.
Fig. 6.
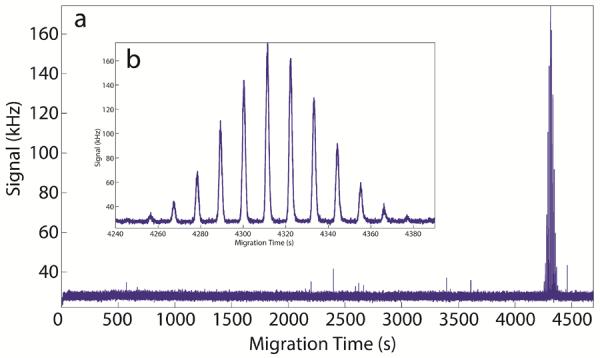
(a) Representative 2D electropherogram from the nicked sleeve capillary interface and (b) a close up of the 5-TAMRA peak.
The raw data that was collected for 2D experiments, Figure 6, was reconstructed into a two-dimensional image, Figure 7. The area of the spot on the image was calculated by simply summing the counts in the region of the spot and then subtracting the counts from the same size background.
Fig. 7.
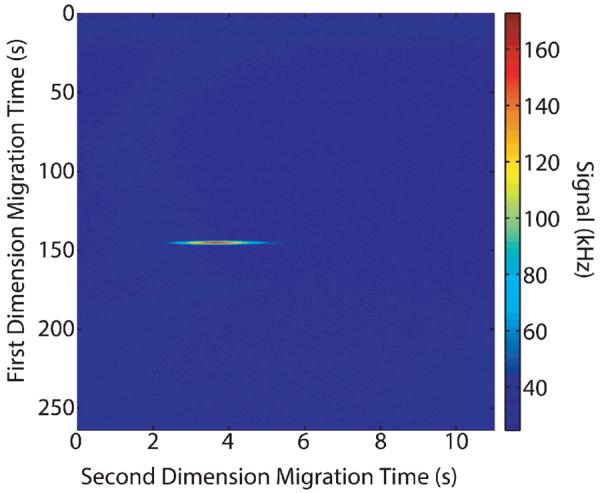
Representative 2D image plot of 2D nicked sleeve capillary data.
The results for each experiment were compared to the results of a 1D-CE experiment that used a single, intact capillary. The peak area from the 1D-CE experiment served as the threshold for 100% transfer efficiency. Table 2 and Figure 8 show results for all experiments. A marked improvement in transfer efficiency and precision was observed for the nicked sleeve capillary interface compared with the traditional interface. The nicked sleeve capillary interface produced a transfer efficiency of greater than 90% for both pseudo-1D and 2D modes with an error of 2.1% and 2.5%, respectively. On the other hand, the traditional interface leaves much to be desired with transfer efficiencies of 43 ± 11% and 68 ± 7.3 % for pseudo-1D and 2D modes, respectively.
Table 2.
Peak areas and statistics
| Peak Area (Photon Counts) | |||||
|---|---|---|---|---|---|
| 1D | Traditional Pseudo-1D | Nicked Sleeve Pseudo-1D | Traditional 2D | Nicked Sleeve 2D | |
| Average | 1132000 | 482000 | 1041000 | 766000 | 1059000 |
| Standard Error of Mean | 4000 | 52000 | 22000 | 56000 | 26000 |
| Transfer Efficiency (%) | 100 | 43 | 92 | 68 | 94 |
| Coefficient of Variation for Transfer Efficiency (%) | 0.35 | 11 | 2.1 | 7.3 | 2.5 |
data from triplicate runs on three different interfaces for each type of interface
Fig. 8.
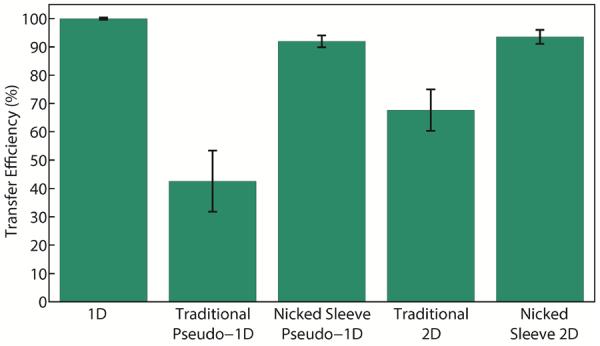
Transfer efficiencies of the various experiments performed in this investigation.
This enhanced performance likely stems from the improved alignment of the separation capillaries when using a nicked sleeve capillary. The traditional interface requires exceptional dexterity while working under a microscope to achieve adequate lateral alignment of the separation capillaries in the plane of the interface; however alignment out of the plane of the interface is not easily controlled. Using a nicked sleeve capillary maximizes the coaxial overlap of the separation capillaries and removes the need for tedious manual alignment. The farthest out of alignment the separation capillaries are permitted to be with the use of the nicked sleeve capillary cannot exceed the difference between the sleeve inner diameter and the separation capillary outer diameter (2 μm in this experiment). In addition to providing improved transfer efficiency and easier assembly, the nicked sleeve capillary interface also improved the precision of data collected. Interestingly, the transfer efficiency of the traditional interface being operated in 2D mode was greater than the transfer efficiency of the same interface being operated in pseudo-1D mode. The increase in efficiency is likely a result of an imperfect balance of electric fields during these experiments, which could result in hydrodynamic backflow that would minimize diffusional loss of analyte from the distal end of the first capillary during the second dimension separation.
Supplementary Material
Acknowledgements
This work was supported by a grant from the National Institutes of Health (R21GM103462). We also gratefully acknowledge donation of the film frame by John Vickery at Perfection Products.
References
- (1).Novotny M, Shirota O, Rice D. Abstracts of Papers of the American Chemical Society. 1991;202:19. [Google Scholar]
- (2).Jandik P, Jones WR, Weston A, Brown PR. LC GC. 1991;9:634. [Google Scholar]
- (3).Yim KW. J. Chromatogr. 1991;559:401. doi: 10.1016/0021-9673(91)80089-y. [DOI] [PubMed] [Google Scholar]
- (4).Nielsen RG, Rickard EC, Santa PF, Sharknas DA, Sittampalam GS. J. Chromatogr. 1991;539:177. doi: 10.1016/s0021-9673(01)95371-3. [DOI] [PubMed] [Google Scholar]
- (5).Liu JP, Shirota O, Wiesler D, Novotny M. Proc. Nat. Acad. Sci. (USA) 1991;88:2302. doi: 10.1073/pnas.88.6.2302. [DOI] [PMC free article] [PubMed] [Google Scholar]
- (6).Michels DA, Hu S, Schoenherr RM, Eggertson MJ, Dovichi NJ. Mol. Cell. Proteomics. 2002;1:69. doi: 10.1074/mcp.t100009-mcp200. [DOI] [PubMed] [Google Scholar]
- (7).Hu S, Michels DA, Fazal MA, Ratisoontorn C, Cunningham ML, Dovichi NJ. Anal. Chem. 2004;76:4044. doi: 10.1021/ac0498314. [DOI] [PubMed] [Google Scholar]
- (8).Michels DA, Hu S, Dambrowitz KA, Eggertson MJ, Lauterbach K, Dovichi NJ. Electrophoresis. 2004;25:3098. doi: 10.1002/elps.200405939. [DOI] [PubMed] [Google Scholar]
- (9).Chen X, Fazal MA, Dovichi NJ. Talanta. 2007;71:1981. doi: 10.1016/j.talanta.2006.09.004. [DOI] [PMC free article] [PubMed] [Google Scholar]
- (10).Giddings JC. Unified separation science. Wiley; New York: 1991. [Google Scholar]
- (11).Moseley MA, Deterding LJ, Tomer KB, Jorgenson JW. J. Chromatogr. 1989;480:197. doi: 10.1016/s0021-9673(01)84289-8. [DOI] [PubMed] [Google Scholar]
- (12).Fazal MA, Palmer VR, Dovichi NJ. J. Chromatogr. A. 2006;1130:182. doi: 10.1016/j.chroma.2006.05.053. [DOI] [PubMed] [Google Scholar]
- (13).Kraly JR, Jones MR, Gomez DG, Dickerson JA, Harwood MM, Eggertson M, Paulson TG, Sanchez CA, Odze R, Feng ZD, Reid BJ, Dovichi NJ. Anal. Chem. 2006;78:5977. doi: 10.1021/ac061029+. [DOI] [PMC free article] [PubMed] [Google Scholar]
- (14).Zhu CR, He XY, Kraly JR, Jones MR, Whitmore CD, Gomez DG, Eggertson M, Quigley W, Boardman A, Dovichi NJ. Anal. Chem. 2007;79:765. doi: 10.1021/ac061652u. [DOI] [PubMed] [Google Scholar]
- (15).Cong YZ, Zhang LH, Tao DY, Liang Y, Zhang WB, Zhang YK. J. Sep. Sci. 2008;31:588. doi: 10.1002/jssc.200700444. [DOI] [PubMed] [Google Scholar]
- (16).Dickerson JA, Ramsay LM, Dada OO, Cermak N, Dovichi NJ. Electrophoresis. 2010;31:2650. doi: 10.1002/elps.201000151. [DOI] [PMC free article] [PubMed] [Google Scholar]
- (17).Lu JJ, Wang SL, Li GB, Wang W, Pu QS, Liu SR. Anal. Chem. 2012;84:7001. doi: 10.1021/ac3017168. [DOI] [PMC free article] [PubMed] [Google Scholar]
- (18).Wojcik R, Vannatta M, Dovichi NJ. Analytical Chemistry. 2010;82:1564. doi: 10.1021/ac100029u. [DOI] [PMC free article] [PubMed] [Google Scholar]
- (19).Sun LL, Li YH, Yang P, Zhu GJ, Dovichi NJ. J. Chromatogr. A. 2012;1220:68. doi: 10.1016/j.chroma.2011.11.050. [DOI] [PMC free article] [PubMed] [Google Scholar]
- (20).Li Y, Wojcik R, Dovichi NJ. J. Chromatogr. A. 2011;1218:2007. doi: 10.1016/j.chroma.2010.10.013. [DOI] [PMC free article] [PubMed] [Google Scholar]
- (21).Dada OO, Huge BJ, Dovichi NJ. Analyst. 2012;137:3099. doi: 10.1039/c2an35321k. [DOI] [PMC free article] [PubMed] [Google Scholar]
Associated Data
This section collects any data citations, data availability statements, or supplementary materials included in this article.


