Abstract
We report load transfer and mechanical properties of chemically derived single layer graphene (SLG) as reinforcements in poly (dimethyl) siloxane (PDMS) composites. Mixing single layer graphene in polymers resulted in the marked decrease of the G’ or 2D band intensity due to doping and functionalization. A Raman G mode shift of 11.2 cm−1/% strain in compression and 4.2 cm−1/% strain in tension is reported. An increase in elastic modulus of PDMS by ~42%, toughness by ~39%, damping capability by ~673%, and strain energy density of ~43% by the addition of 1 wt. % SLG in PDMS is reported.
1. INTRODUCTION
Defect free sheets of single layer graphene (SLG) exfoliated mechanically from graphite flakes was measured to have second order elastic stiffness of 340 N/m, breaking strength of 42 N/m and Young’s modulus of 1.0 Tpa [1]. Such excellent mechanical properties of exfoliated SLG warrant their investigation as fillers in advanced polymer composites. Recently, interfacial stress transfer of exfoliated SLG transferred on top of polymer substrate was demonstrated using Raman spectroscopy [2, 3]. Significant shift in the Raman G’ or 2D bands (> −50 cm−1/% strain) were observed, demonstrating load transfer to the carbon layer [2, 3]. Several studies on exfoliated graphite based polymer composites have shown enhanced mechanical strength, toughness, glass transition temperature, increase in electrical conductivity and gas barrier properties [4-11]. The work by Coleman et al., is notable as it yielded a ~100 times increase in elastic modulus at 3% strains for 50 wt. % exfoliated graphene drop casted in polyurethane [11]. While these studies are impressive reiterating the importance of graphene as filler materials in polymer composites, current methods of fabrication of macroscopic advanced polymer composites using mechanically exfoliated graphene are quite limited. This is due to the fact that yield of mechanically exfoliated graphene at present is limited to 1 wt.% which could be increased to 7-12% with additional processing [12]. In this context, the use of chemically reduced graphene as fillers in polymer composites becomes important and warrants investigation for development of low cost and high strength advanced composites. Graphene sheets chemically derived from graphene oxide using Hummer’s method and subsequent reduction by hydrogen plasma has been heralded as one of the methods for large scale production of graphene suitable for industrial use [13]. Microscopic characterization of such graphene sheets has shown large unoxidized graphitic regions in between defective clusters and therefore could witness interesting mechanical properties [14]. Recent studies have shown that despite the defects in their lattice, such sheets have shown extraordinary stiffness with Young’s modulus E=0.25 TPa, approaching that of pristine graphene, with high flexibility and lower built-in tension [13]. Therefore, studying the interfacial load transfer and mechanical properties of reduced graphene sheets in polymers can make progress in the area of low cost, high strength and scalable composites based on graphene.
Over the years Raman spectroscopy has become a powerful tool to understand interfacial load transfer in carbon fibers and nano-carbon fillers such as carbon nanotubes in polymer composites [15, 16]. The disorder induced 2D bands and tangential mode G band has been demonstrated to be sensitive to both compressive and tensile strains in nano-carbon fillers such as carbon nanotubes [15, 16]. The Raman stress sensitivity arises from the anharmonicity of the atomic bonds [17]. By using the interatomic potentials of the harmonic bond model and including the attractive and repulsive contributions (Mie and Gruneisen parameters), past theoretical framework has demonstrated a direct relationship between the wavenumber shift in the Raman bands and bond deformation which can be expressed mathematically as: , where, a and r are positive constants depending on the bond type and εL is the strain applied [17]. Therefore, the strain induced Raman band shifts is a measure of the change in interatomic distances or bond deformation due to the load transferred from the polymer to the graphene fillers. The eventual mechanical properties of the composites are bound to depend on the extent to which the load is transferred from the polymer to the graphene filler and the graphene/polymer interface should play the most important role in efficient stress transfer. Larger the shift in Raman wavenumbers is therefore as a result of higher stress transfer from the polymer to the graphene fillers and can be mathematically expressed using the following equation: where Ef is the young’s modulus filler material, and Δw wavenumber shift. Therefore, if the filler has the same bond type and assuming that the applied strain field is constant throughout the composite matrix, the larger the Raman wavenumber shift means higher load transfer.
2. RESULTS AND DISCUSSION
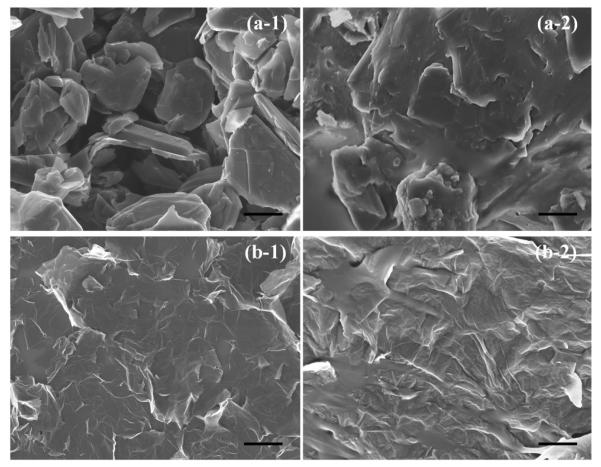
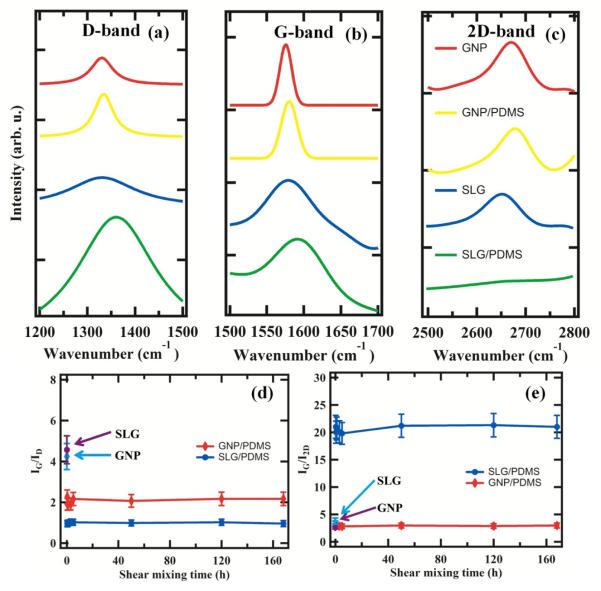
Figure 1 (a-1) presents an SEM image of GNPs, which are comprised of 3-5 graphitic layers [18]. Figure 1 (a-2) presents an SEM image of GNP/PDMS composite. One can see that the rigid stack like morphology of GNP is maintained in the polymer matrix. Figure 1 (b-1) presents an SEM of SLG. Figure 1 (b-2) presents an SEM image of SLG/PDMS composite. GNPs show a rigid stack/plate like morphology while SLG demonstrate morphology of thin ribbon but with excellent dispersion. Figure 2 presents the evolution of the Raman D, G and 2D bands for pure GNP, SLG and their polymer counterparts as a function of the mixing process. Multilayer configuration of GNPs causes a frequency shift in both peaks as compared to SLG [19]. From the Raman bands, it is seen that both G band (Figure 2(b)) and the 2D band ratios (Figure 2(c)) do not change significantly for GNP and GNP/PDMS samples. Comparing SLG and SLG/PDMS samples however, the 2D band decreases significantly (Figure 2(c)) in intensity and the D band intensity increases (Figure 2(a)) and is quite intriguing. Plausible causes of change in D and 2D band intensities may suggest damage of the SLG due to shear mixing, doping of SLG by the polymer and functionalization of SLG sheets by the polymer. In order to ascertain whether the change in Raman D and 2D band intensity was result of mechanical damage over 7 days of shear mixing or doping and functionalization, the ratio of IG/ID and IG/I2D was measured at different intervals of mixing time. Figure 2 (d & e) presents the IG/ID and IG/I2D as a function of mixing time from 5 minutes to 168 hours. It is observed that within 5 minutes of mixing, the ratio’s change and stays there even after 160 hours. As a comparison the ratio of IG/ID for pure SLG and GNP flakes are marked as such in Figure 2 (d & e). Mechanical damage due to shear mixing should demonstrate progressive increase in D band intensity due to increased number of defects between shorter and longer intervals of time, which is not observed in Figure 2 (d & e). The instantaneous change in IG/ID and IG/I2D suggests doping and functionalization of graphene sheets [20, 21]. The ratio of 2D to G band intensities (I2D/IG) is a sensitive probe to monitor the effects of electron-donor and electron-acceptor molecules on electronic properties of graphene [20]. Electron-donors markedly decrease the (I2D/IG) ratio while electron-acceptor molecules increase this ratio [20]. The ratio of ID/IG shows an opposite trend for the SLG/PDMS sample suggesting that as D band intensity increases, 2D band decreases [20]. Similarly, broadening of 2D bands and increase in D band intensities could also mean high functionalization densities of the polymer as reported in the past [21]. Table 1 presents the ID/IG ratio and I2D/IG ratio for all samples tested. This table presents evolution of Raman bands both in pure and mixed polymer composites suggesting both doping and functionalization due to charge injection from the polymer as witnessed by the marked decrease in I2D/IG for the SLG samples. Recent reports on charge injection as a function of pressure have been quantified using Raman spectroscopy [22]. A marked decrease in I2D/IG values were seen in alcohol compared to argon with increase in pressure from 0-7 GPa of SLG and BLG samples on SiO2 substrates suggesting doping of the samples [22]. Since the experiments in this case were done at ambient pressure, the doping and functionalization is a result of the mixing process of the polymer interacting with the SLG defective sites. Mixing induced folding can result in unique D band and folds can appear as defective sites that can scatter phonons [23]. All these observations show that mixing of graphene in polymer such as PDMS results in charge injection even at ambient pressure and resulted in doping and functionalization. The source of the charge injection may be due to the reactive linkers in PDMS namely silanol (Si-O-H) groups or from the methyl or ethyl groups from the side chains that have been used to link molecules to the Si-O backbones. Past work on using scanning surface potential microscopy to investigate the origins of gate hysteresis in nanotube field effect transistors have shown the charge injection from the silanol groups resulted in considerable screening of charges at the nanotube/SiO2/ambient interface [24]. So all these past reports mentioned above confirms our results on the effect of charge injection due to mixing of SLG in PDMS that resulted in shift in I2D/IG ratio.
Figure 1.
SEM images: (a-1) GNPs; (a-2) GNP/PDMS; (b-1) SLG; (b-2) SLG/PDMS; Scale bar: 1 μm in all the images.
Figure 2.
Raman spectra of (a) D band, (b) G band, (c) 2D band of GNP, SLG, GNP/PDMS and SLG/PDMS, (d-e) ratio of IG/ID and IG/I2D versus shear mixing time respectively.
Table 1.
Raman wavenumbers of D, G and 2D bands and their FWHM
| D band (cm−1) |
FWHM-D (cm−1) |
G band (cm−1) |
FWHM-G (cm−1) |
2D band (cm−1) |
FWHM-2D (cm−1) |
IG/ID | IG/I2D | |
|---|---|---|---|---|---|---|---|---|
| GNP | 1330.5 | 59.09 | 1575.8 | 18.27 | 2666.9 | 74.13 | 4.57 | 2.65 |
| GNP/PDMS | 1333.3 | 61.26 | 1580.1 | 24.38 | 2673.7 | 76.56 | 2.17 | 2.96 |
| SLG | 1336.1 | 195.25 | 1568.3 | 28.37 | 2654.6 | 84.97 | 4.24 | 3.80 |
| SLG/PDMS | 1351.6 | 222.48 | 1592.8 | 88.31 | 2673.7 | 726.72 | 0.96 | 21 |
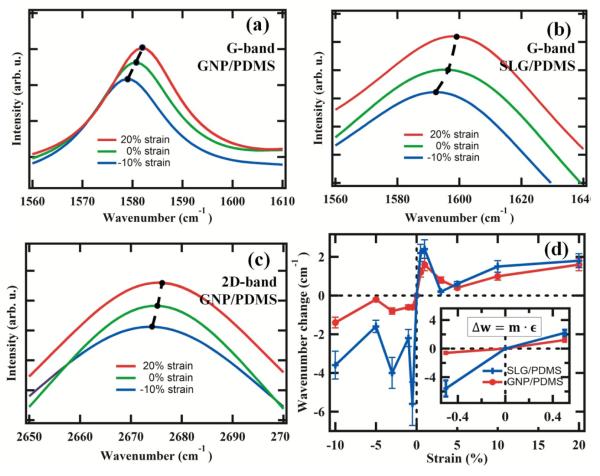
Figure 3 (a) presents the G mode shift of GNP/PDMS with application of both tensile and compressive strains. For GNP/PDMS composites, rate of peak shift with strain was ~2.4 cm−1/% strain in tension and ~1.2 cm−1/% strain under compression as shown in Figure 3(b) and rate of peak shift is similar to the earlier report [25]. In addition, we also measured the 2D band shifts that were quantified to be ~0.8 cm−1/% strain under tension and ~0.7 cm−1/% strain under compression, which was smaller than G band, however demonstrating use of 2D band shift in GNP fillers for measuring load transfer. On the contrary, the 2D bands were the most sensitive to strains in carbon nanotubes where 6 cm−1/% was witnessed in tension in our past work for the same process conditions [26]. Based on the G-band Raman shift, the interfacial stress was calculated to be ~80 GPa for the GNP/polymer interface in compression. For SLG/PDMS, rate of G-peak shift with strain was ~4.4 cm−1/% strain in tension and ~11.2 cm−1/% strain in compression suggesting enhanced load transfer in compression in bulk. The interfacial stress was calculated to be ~410 GPa for SLG interface suggesting fivefold increase in stress transfer in compression. For tension, the load transfer of SLG polymer interface was calculated to be ~3.5 times that of GNP interface. This also suggest greater load transfer of SLG compared to single wall nanotube fillers in tension [25]. Enhanced load transfer was witnessed for SLG fillers in both tension and compression compared to GNP fillers (Figure 3 (c)). Such large Raman shifts suggest large bond deformation, minimum slippage that must originate only from intimate contact of the SLG with the polymer and better dispersion through long mixing. Comparing this to past report on nanotube composites have only demonstrated either large Raman peak shift (15 cm−1 of 2D band) in compression and small peak shift in tension [27].
Figure 3.
Load transfer: (a) G band shift in GNP/PDMS, (b) G-band shift in SLG/PDMS, (c) 2D band shift of GNP/PDMS, (d) change in Raman wavenumbers with strains.
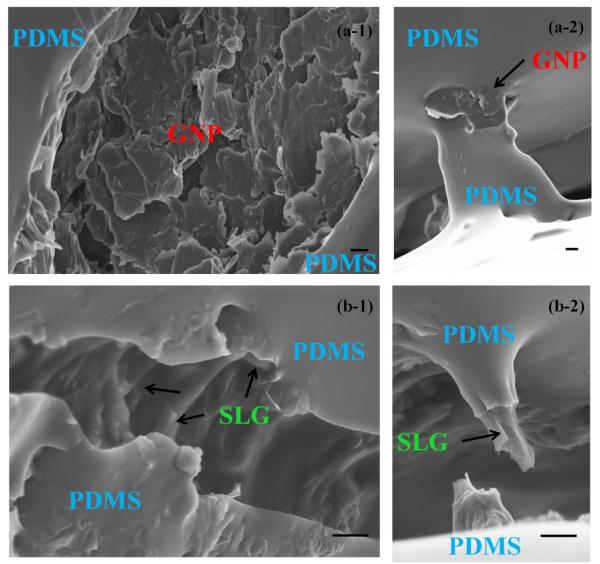
Figure 4 (a-1 & a-2) presents the fracture surface of GNP/PDMS and Figure 4 (b-1 & b-2) presents the fracture surface of SLG/PDMS samples to investigate microscopic morphology of load transfer. Two important observations were made in the images. From the morphology of Figure 4 (a), it looks like GNP fillers were pulled out of the PDMS matrix and fell onto the crater surface due to lack of flexibility. This is contrasted by other areas where GNP/PDMS is seen bridging the gaps between the cracks (Figure 4 (a-2)). These images suggest that GNPs act like reinforcers, as they assist in bridging cracks between the surfaces and aid in load transfer. However, investigations into SLG/PDMS cracks lead to different results. Most SLG (Figure 4 (b-1)) looks similar to their polymeric composite and is still seen to bridge the crack opening. However an interesting result that was seen was the fracture surface from other areas. Figure 4(b-2) presents the fractured filler inside the crack. It is clear that the layers of polymer and SLG plates are seen distinctly with the polymer pulled out of the SLG filler before complete failure of the filler. It is seen from these images that the failure mechanisms of SLG is quite different compared to nanotubes which needs to be investigated [27]. Nanotube tends to slide between the bundles much more easily than break compared to SLG fillers as seen in these SEM images [27]. This warrants further investigation depending on the strains applied, crack widths, graphene filler aspect ratio and number of graphitic layers.
Figure 4.
SEM images of the cracks (a-1) collapsed GNPs on the crater of the micro-crack; (a-2) GNPs aiding load transfer; (b-1) SLG between the crack openings; (b-2) cracking of SLG filler after peeling of PDMS. Scale bar: 500 nm in all the images.
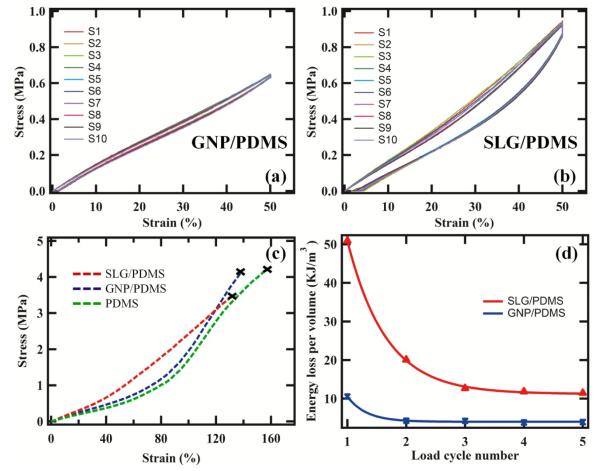
Figure 5 (a-b) presents the cyclic stress-strain curves of both the composite samples with from 10 different repeats (different samples) marked S1-S10. The area under the hysteresis curve represents energy loss during the loading and unloading cycles. The area under the hysteresis curve is larger for SLG/PDMS indicating 673% improvement in damping capability compared to pure PDMS. On the other hand, area under the hysteresis loop was smaller for GNP/PDMS matrix ~139% the area for pure PDMS. The large damping capability of SLG fillers demonstrate considerable interfacial slippage between the PDMS and fillers and high thermal conductivity [28]. This brings in an interesting question of whether the orientation of the graphene with respect to the longitudinal or transverse loading can affect energy dissipation and could serve as useful design parameter for future composites and is worth investigating in future. Figure 5 (c) presents the stress-strain curve of GNP/PDMS, SLG/PDMS and pure PDMS samples till failure. As more strain is applied, the polymeric chains in PDMS are stretched out till final failure was seen ~160%. SLG/PDMS samples exhibited a linear stress-strain curve with failure at ~120%, almost 25% lower failure strains. This suggests considerable stiffening of the matrix with addition of SLG at these low weight percentages. The increase in elastic modulus for SLG/PDMS was ~42% while that of GNP/PDMS was ~30%. Figure 5 (d) presents the calculated energy loss for SLG/PDMS and GNP/PDMS composites. An energy release of ~50.9 kJ/m3 for one cycle and lowering as the cycles are repeated. The frictional energy due to SLG interacting with the polymer on loading and recovery during unloading is clearly represented in these cycles. At the fifth cycle, the energy loss is saturated at ~11.4 kJ/m3. However, GNP/PDMS show five time small energy loss at ~10.6 kJ/m3 at first cycle and saturating quickly to ~3.8 kJ/m3 from the second to the fifth cycle. The energy loss shows that slippage and friction between polymer and filler c which can be tuned in SLG based composites to much higher level than GNPs. Investigating further, the area under the stress-strain curve also represents toughness. This was calculated at 1.92 MJ/m3 for SLG/PDMS, 1.59 MJ/m3 for GNP/PDMS and 1.38 MJ/m3 for pure PDMS at 130% end point strain. The flexibility of SLG can result in large energy absorption without failing resulting in increased toughness of the composite. Finally, energy density values were calculated as ~1.87 kJ/Kg for SLG/PDMS, ~1.52 kJ/Kg for GNP/PDMS and ~1.30 kJ/Kg for pure PDMS. This suggests an increase in strain energy density of ~43% for SLG fillers in PDMS. The high surface area of SLG sheets makes the intimate interaction with the polymer due to increased adhesion resulting in higher strain energy densities [29]. In the elastic regime, these high densities can be recovered as useful mechanical work thereby making SLG highly attractive for realization of advanced composites.
Figure 5.
Mechanical Properties: cyclic stress-strain curves of (a) GNP/PDMS, (b) SLG/PDMS, (c) stress-strain curve of all the composites tested till failure, (d) energy loss with cycling.
3. CONCLUSIONS
In summary, this report demonstrates quite interesting mechanical properties of chemically derived SLG in polymer composites. Mixing SLG in polymers resulted in doping and functionalization that was characterized using shifts in I2D/IG ratio. Significant decrease in I2D/IG was observed for SLG fillers in polymer composites. Further, the ratio was compared with those of pure SLG and GNP samples and as a function of mixing time. The ratio of I2D/IG changed within 5 minutes of mixing and stayed constant over 7 days. These results suggest doping and functionalization from the silanol and methyl/ethyl groups from the PDMS side chains which act as linkers to bond molecules to the Si-O backbone. SLG in PDMS showed enhanced load transfer, mechanical strength, damping capability, strain energy sensitivity and elastic modulus compared to their GNP counterparts. It is seen that the failure mechanisms of SLG in PDMS are quite different from those of GNPs which needs further investigation. A Raman G mode shift of 11.2 cm−1/% strain in compression and 4.2 cm−1/% strain in tension is reported suggesting enhanced load transfer in compression. An increase in elastic modulus of PDMS by ~42%, toughness by ~39%, damping capability by ~673%, and strain energy density of ~43% by the addition of 1 wt. % SLG in PDMS is reported. Such excellent mechanical property improvement for small fraction of chemically derived SLG presents opportunities for developing low cost advanced composites based on graphene.
Methods
1. Raw Materials
Commercially obtained SLG (92% carbon, <8% oxygen) produced via thermal exfoliation reduction and hydrogen reduction of single layer graphene oxide) was purchased from ACS Materials. The SLG was used in its original form and not surface modified at any time. GNPs were purchased from ACS Materials and were prepared by plasma exfoliation with >99% purity and ~3-5 layers. The number of layers were verified using SEM and was characterized in the past using layer dependent shifts in Raman spectroscopy [18]. Sylgard 184 silicone elastomer (Fisher Scientific) was chosen as the matrix because it is commonly used in industrial/scientific research and biocompatible. The term ‘wt%’ used throughout the paper refers to the ratio of carbon additive to PDMS base compound.
2. Shear Mixing Process
Homogenous dispersion of graphene (1 wt. % of SLG and GNP for comparison) in PDMS was prepared using a shear mixing process. Steps included mixing known weight percentages of graphene fillers in PDMS base compound using a laboratory shear mixer at 300 rpm for 7 days at 25 C, addition of cross linkers (10:1 base compound: curing agent ratio), degas procedures, cross-linking and polymerization, spin coating and baking for 30 min at 125 C and finally post-bake relaxation for ~12 hours [30].
3. SEM and Raman Spectroscopy Characterization
SEM imaging was conducted on a Zeiss SUPRA 35VP field emission scanning electron microscope. The ~632.8 nm line beam of a helium-neon laser in an inVia RENISHAW micro-Raman spectrometer was focused onto the sample surface through a ×50 objective lens, forming a laser spot approximately 3 μm in diameter. Strains were applied to the sample under the micro-Raman spectrometer by using a linear actuator that was able to precisely stretch or compress the sample to predetermined length. A Gaussian profile was used to fit the Raman peaks.
4. Mechanical Property Testing
Samples containing 1 wt. % SLG or GNP in PDMS were prepared and tested for their elastic modulus until failure. Stress-strain curves and cyclic stress-strain curves were measured using a Rheometric Mechanical Analyzer (RMA, TA instruments-Waters LLC) for both SLG and GNP composites. Cyclic mechanical testing was conducted on 10 samples for each SLG/PDMS sample to investigate stress-strain curves, toughness and strain energy density of the composites.
Acknowledgement
Funding for this work was partially supported by the NSF grants ECCS: 0853066, ECCS: 1202190, and CMMI: 1233996 and NIH grant: 1R15CA156322 for one of the authors (B.P.). The authors are grateful for the help extended by Dr. Roger Bradshaw in assisting with mechanical testing.
REFERENCES
- [1].Lee C, Wei XD, Kysar JW, Hone J. Measurement of the elastic properties and intrinsic strength of monolayer graphene. Science. 2008 Jul 18;vol. 321:385–388. doi: 10.1126/science.1157996. [DOI] [PubMed] [Google Scholar]
- [2].Gong L, Kinloch IA, Young RJ, Riaz I, Jalil R, Novoselov KS. Interfacial Stress Transfer in a Graphene Monolayer Nanocomposite. Advanced Materials. 2010 Jun 25;vol. 22:2694. doi: 10.1002/adma.200904264. + [DOI] [PubMed] [Google Scholar]
- [3].Young RJ, Gong L, Kinloch IA, Riaz I, Jalil R, Novoselov KS. Strain Mapping in a Graphene Monolayer Nanocomposite. Acs Nano. 2011 Apr;vol. 5:3079–3084. doi: 10.1021/nn2002079. [DOI] [PubMed] [Google Scholar]
- [4].Song PG, Cao ZH, Cai YZ, Zhao LP, Fang ZP, Fu SY. Fabrication of exfoliated graphene-based polypropylene nanocomposites with enhanced mechanical and thermal properties. Polymer. 2011 Aug 18;vol. 52:4001–4010. [Google Scholar]
- [5].El Achaby M, Arrakhiz FE, Vaudreuil S, Qaiss AE, Bousmina M, Fassi-Fehri O. Mechanical, thermal, and rheological properties of graphene-based polypropylene nanocomposites prepared by melt mixing. Polymer Composites. 2012 May;vol. 33:733–744. [Google Scholar]
- [6].Kalaitzidou K, Fukushima H, Drzal LT. Mechanical properties and morphological characterization of exfoliated graphite-polypropylene nanocomposites. Composites Part a- Applied Science and Manufacturing. 2007;vol. 38:1675–1682. [Google Scholar]
- [7].Wakabayashi K, Brunner PJ, Masuda J, Hewlett SA, Torkelson JM. Polypropylene-graphite nanocomposites made by solid-state shear pulverization: Effects of significantly exfoliated, unmodified graphite content on physical, mechanical and electrical properties. Polymer. 2010 Oct 29;vol. 51:5525–5531. [Google Scholar]
- [8].Raghu AV, Lee YR, Jeong HM, Shin CM. Preparation and Physical Properties of Waterborne Polyurethane/Functionalized Graphene Sheet Nanocomposites. Macromolecular Chemistry and Physics. 2008 Dec 18;vol. 209:2487–2493. [Google Scholar]
- [9].Nguyen DA, Lee YR, Raghu AV, Jeong HM, Shin CM, Kim BK. Morphological and physical properties of a thermoplastic polyurethane reinforced with functionalized graphene sheet. Polymer International. 2009 Apr;vol. 58:412–417. [Google Scholar]
- [10].Kim H, Miura Y, Macosko CW. Graphene/Polyurethane Nanocomposites for Improved Gas Barrier and Electrical Conductivity. Chemistry of Materials. 2010 Jun 8;vol. 22:3441–3450. [Google Scholar]
- [11].Khan U, May P, O’Neill A, Coleman JN. Development of stiff, strong, yet tough composites by the addition of solvent exfoliated graphene to polyurethane. Carbon. 2010 Nov;vol. 48:4035–4041. [Google Scholar]
- [12].Hernandez Y, Nicolosi V, Lotya M, Blighe FM, Sun ZY, De S, McGovern IT, Holland B, Byrne M, Gun’ko YK, Boland JJ, Niraj P, Duesberg G, Krishnamurthy S, Goodhue R, Hutchison J, Scardaci V, Ferrari AC, Coleman JN. High-yield production of graphene by liquid-phase exfoliation of graphite. Nature Nanotechnology. 2008 Sep;vol. 3:563–568. doi: 10.1038/nnano.2008.215. [DOI] [PubMed] [Google Scholar]
- [13].Gomez-Navarro C, Burghard M, Kern K. Elastic properties of chemically derived single graphene sheets. Nano Letters. 2008 Jul;vol. 8:2045–2049. doi: 10.1021/nl801384y. [DOI] [PubMed] [Google Scholar]
- [14].Lerf A, He HY, Forster M, Klinowski J. Structure of graphite oxide revisited. Journal of Physical Chemistry B. 1998 Jun 4;vol. 102:4477–4482. [Google Scholar]
- [15].Schadler LS, Giannaris SC, Ajayan PM. Load transfer in carbon nanotube epoxy composites. Applied Physics Letters. 1998 Dec 28;vol. 73:3842–3844. [Google Scholar]
- [16].Mu MF, Osswald S, Gogotsi Y, Winey KI. An in situ Raman spectroscopy study of stress transfer between carbon nanotubes and polymer. Nanotechnology. 2009 Aug 19;vol. 20 doi: 10.1088/0957-4484/20/33/335703. [DOI] [PubMed] [Google Scholar]
- [17].Gouadec G, Colomban P. Raman Spectroscopy of nanomaterials: How spectra relate to disorder, particle size and mechanical properties. Progress in Crystal Growth and Characterization of Materials. 2007;vol. 53:1–56. [Google Scholar]
- [18].Loomis J, King B, Panchapakesan B. Layer dependent mechanical responses of graphene composites to near-infrared light. Applied Physics Letters. 2012 Feb 13;vol. 100 doi: 10.1063/1.3698343. [DOI] [PMC free article] [PubMed] [Google Scholar]
- [19].Ferrari AC. Raman spectroscopy of graphene and graphite: Disorder, electron-phonon coupling, doping and nonadiabatic effects. Solid State Communications. 2007 Jul;vol. 143:47–57. [Google Scholar]
- [20].Rao CNR, Biswas K, Subrahmanyam KS, Govindaraj A. Graphene, the new nanocarbon. Journal of Materials Chemistry. 2009;vol. 19:2457–2469. [Google Scholar]
- [21].Englert JM, Dotzer C, Yang GA, Schmid M, Papp C, Gottfried JM, Steinruck HP, Spiecker E, Hauke F, Hirsch A. Covalent bulk functionalization of graphene. Nature Chemistry. 2011 Apr;vol. 3:279–286. doi: 10.1038/nchem.1010. [DOI] [PubMed] [Google Scholar]
- [22].Nicolle J, Machon D, Poncharal P, Pierre-Louis O, San-Miguel A. Pressure-Mediated Doping in Graphene. Nano Letters. 2011 Sep;vol. 11:3564–3568. doi: 10.1021/nl201243c. [DOI] [PubMed] [Google Scholar]
- [23].Gupta AK, Nisoli C, Lammert PE, Crespi VH, Eklund PC. Curvature-induced D-band Raman scattering in folded graphene. Journal of Physics-Condensed Matter. 2010 Aug 25;vol. 22 doi: 10.1088/0953-8984/22/33/334205. [DOI] [PubMed] [Google Scholar]
- [24].Lee JS, Ryu S, Yoo K, Choi IS, Yun WS, Kim J. Origin of gate hysteresis in carbon nanotube field-effect transistors. Journal of Physical Chemistry C. 2007 Aug 30;vol. 111:12504–12507. [Google Scholar]
- [25].Srivastava I, Mehta RJ, Yu ZZ, Schadler L, Koratkar N. Raman study of interfacial load transfer in graphene nanocomposites. Applied Physics Letters. 2011 Feb 7;vol. 98 [Google Scholar]
- [26].Xu P, Loomis J, Panchapakesan B. Photo-thermal polymerization of nanotube/polymer composites: Effects of load transfer and mechanical strength. Applied Physics Letters. 2012 Mar 26;vol. 100 doi: 10.1063/1.3698343. [DOI] [PMC free article] [PubMed] [Google Scholar]
- [27].Ajayan PM, Schadler LS, Giannaris C, Rubio A. Single-walled carbon nanotube-polymer composites: Strength and weakness. Advanced Materials. 2000 May 17;vol. 12:750. + [Google Scholar]
- [28].Ci L, Suhr J, Pushparaj V, Zhang X, Ajayan PM. Continuous carbon nanotube reinforced composites. Nano Letters. 2008 Sep;vol. 8:2762–2766. doi: 10.1021/nl8012715. [DOI] [PubMed] [Google Scholar]
- [29].El-Lawindy AMY, El-Guiziri SB. Strain energy density of carbon-black-loaded rubber vulcanizates. Journal of Physics D-Applied Physics. 2000 Aug 7;vol. 33:1894–1901. [Google Scholar]
- [30].Loomis J, King B, Panchapakesan B. Layer dependent mechanical responses of graphene composites to near infrared light. Applied Physics Letters. 2012;vol. 100 [Google Scholar]


