

Abstract
Hydramacin-1 (HM1) from the metazoan Hydra exerts antimicrobial activity against a wide range of bacterial strains. Notably, HM1 induces the aggregation of bacterial cells, accompanied by precipitation. To date, the proposed mechanism of peptide-lipid interaction, termed the barnacle model, has not been described on the molecular level. Here, we show by biochemical and biophysical techniques that the lipid-peptide interactions of HM1 are initiated by electrostatic and hydrophobic effects, in particular, by tryptophan and neighboring polar amino acid residues that cause an interfacial localization of the peptide between two self-contained lipid bilayers. The high binding constants of HM1 upon lipid interaction are in the range of other potent antimicrobial peptides, e.g., magainin, and can be reasonably explained by two distinct epitopes on the surface of the peptide's global structure, which both contain SWT(K/R) motifs. The residues of this motif favor localization of the peptide in the head group region of phospholipid bilayers up to a penetration depth of 4 Å and a minor participation of the lipids' hydrocarbon regions. Our results expand the knowledge about the molecular modes of action antimicrobial peptides use to tackle their target cells. Furthermore, the aggregation of living bacteria by HM1 was observed for a broad range of Gram-positive and Gram-negative bacteria. Therefore, the detailed view of peptide-lipid interactions described by the barnacle model consolidates it among the established models.
INTRODUCTION
Various antimicrobial peptides and proteins exert their antimicrobial activities by directly targeting the microbial membrane (1). Currently, only a few mechanistic models describe the peptides' modes of action in detail. Certain peptides form transient or stable membrane pores, as represented by the aggregate model, the toroidal-pore model, or the barrel stave model (2), or lead to micellization of membrane lipids, as specified by the carpet model (3). Furthermore, the peptides can translocate via the microbial membrane (aggregate model) and disturb essential intracellular processes. In addition, some antimicrobial peptides are reported to exert their modes of action more specifically, for example, by binding particular membrane compounds, such as lipid II, leading to inhibition of cell wall synthesis (4).
Recently, members of a new antimicrobial protein family, the macins, were pronounced to exhibit a mode of action that clearly deviates from well-established mechanisms of membrane permeabilization. Peptides from this family lead to aggregation of bacteria, which originates from their striking molecular surface properties comprising two uncharged and hydrophobic hemispheres that sandwich a belt of positive charges (5, 6). The corresponding mechanistic model was termed the barnacle model and was described for the first time for hydramacin-1 (HM1), the macin family founder (5). It suggested a dual electrostatic, as well as hydrophobic, peptide-membrane interaction applied in parallel to two individual bacterial cells. Therefore, each bacterial cell can adhere to several others, leading to the formation of huge cellular aggregates. The term “barnacle” was chosen because the manner in which HM1 holds bacterial cells together evokes both how a thornapple (the burr fruit of Datura stramonium) sticks to clothes and how a barnacle adheres to surfaces. Besides aggregation, we showed in a previous work that HM1 can permeabilize bacterial cells, as exemplified by Bacillus megaterium. Permeabilization (50%) has been observed at peptide concentrations of ∼700 nM (5 μg/ml) using ∼106 cells/ml (5). This matched the 90% lethal dose (LD90) and minimal bactericidal concentration (MBC), respectively, which were in the range of ∼100 to 200 nM (0.7 to 1.4 μg/ml) using ∼105 cells/ml (which is 10 times fewer cells than in the permeabilization assay) (7). The phenomenon of permeabilization does not conflict with that of aggregation and apparently is a consequence of membrane insertion and subsequent disturbance of the membrane's integrity after reaching a certain concentration of HM1 at the cell's surface.
Although, the barnacle model reasonably describes the aggregation effect exerted by the macin peptides, the details of the peptide-membrane interaction on the molecular level were still under investigation. Accordingly, we analyzed this interaction using a combination of biophysical and biochemical techniques, such as solution and solid-state nuclear magnetic resonance (NMR), fluorescence and circular-dichroism (CD) spectroscopy, and dynamic (DLS) and static light scattering (SLS), and showed the aggregation of various living bacterial strains. We identified two distinct membrane-binding epitopes of hydramacin-1 and described the peptides' spatial orientation during interaction and their mechanism of membrane binding in detail. The results both corroborate and refine the barnacle model as the peptides' mode of action.
MATERIALS AND METHODS
All unlabeled, deuterated, and brominated lipids and Escherichia coli total lipid extract were purchased from Avanti Polar Lipids. Deuterated dodecylphosphocholine-d38 (DPC-d38) was purchased from Cambridge Isotope Laboratories.
Recombinant expression and purification of hydramacin-1.
Unlabeled and uniformly 15N-labeled HM1 from Hydra magnipapillata was recombinantly expressed and subsequently purified as previously described (5). (For the polypeptide sequence, see Fig. 7.)
Fig 7.
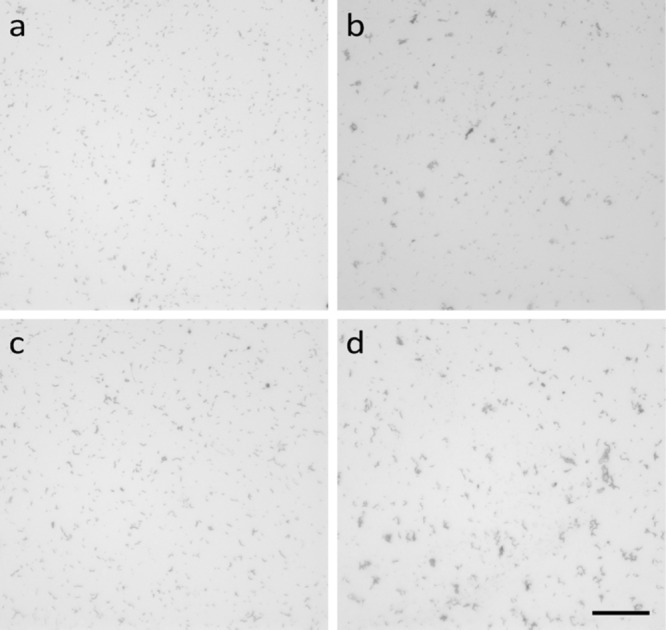
Aggregation of living bacteria by HM1. Depicted are micrographs of Gram-negative E. coli ATCC 25922 (top) and of Gram-positive Streptococcus pyogenes ATCC 12344 (bottom) in the absence (a and c) or presence (b and d) of sublethal dosages of HM-1 after 10 min of incubation. HM1 led to the formation of cell aggregates of both E. coli (b) and S. pyogenes (d), whereas untreated control samples showed a uniform distribution of bacterial cells.
Lipid vesicle preparation.
Lipid mixtures composed of 1-palmitoyl-2-oleoyl-sn-glycero-3-phosphocholine–1-palmitoyl-2-oleoyl-sn-glycero-3-phospho(1′-rac-glycerol) (POPC-POPG) (3:1 [mol/mol]), 1-palmitoyl-2-oleoyl-sn-glycero-3-phosphoethanolamine (POPE)-POPG (3:1 [mol/mol]), or E. coli total lipid extract were dissolved in chloroform and subsequently evaporated under a stream of nitrogen to produce a thin lipid film. Residual solvent was removed by lyophilization, followed by rehydration for 1.5 h under continuous vortexing in 20 mM sodium phosphate buffer, pH 6.0. The suspension was subjected to three freeze-thaw cycles using liquid nitrogen and a water bath of 37°C. Finally, small unilamellar vesicles (SUV) were produced by extrusion through 50-nm polycarbonate membranes (Avestin) 21 times.
Tryptophan emission fluorescence spectroscopy and collisional-quenching experiments.
Tryptophan emission fluorescence measurements were performed on a Fluorolog fluorescence spectrometer (Horiba Jobin Yvon) at an excitation wavelength of 290 nm at 20°C or 37°C. SUV lipid mixtures or micelles were added to a solution of HM1 (3.5 μM final concentration) in 20 mM sodium phosphate buffer, pH 6.0, and continuously stirred in quartz cuvettes of 1-cm path length (Hellma Analytics). Emission and excitation band passes were set to 4 nm, and emission spectra were recorded from 300 to 450 nm, averaging 3 scans. Spectra were corrected for light scattering, baseline, and dilution after adding lipid vesicles for each titration step. Blue shifts were calculated from the emission maxima of peptide and peptide-lipid mixture samples. The standard deviation of the blue shift was 1 nm. Lipid binding by HM1 is described by the following equations with the fraction of bound peptide, ϴ (8): ϴ = ([λ] − [λmin])/([λmax] − [λmin]) and [λ] = ([L/Kd]n × [λmax] + [λmin])/(1 + [L/Kd]n), where [L] is the lipid concentration, Kd is the apparent dissociation constant, and [λmin] and [λmax] are the emission maxima of the unbound and the bound peptides, respectively. The dissociation constant can be determined by plotting the maximum wavelength of each titration step, [λ], of added lipid concentration, with n being the Hill coefficient, which describes cooperative binding of the peptide, with an n value of >1.
Quenching of tryptophan emission by water-soluble acrylamide was detected at an excitation wavelength of 290 nm in the same experimental setting described above. Aliquots from a 5.6 M acrylamide stock solution were added stepwise to 3.5 μM HM1 in the absence and presence of 7 mM DPC, 56 μM lipopolysaccharide (LPS), or 155 μM POPC-POPG (3:1) lipid mixtures. Spectra were corrected for baseline, containing no peptide, and dilution. The integrals of the emission spectra were analyzed using the Stern-Vollmer equation (9): F0/F = (1 + Ksv[Q]) exp(V[Q]), where F0 and F are the fluorescence intensities in the absence and presence of quencher, Q, respectively, and V is a static quencher constant. The Stern-Vollmer quenching constant, Ksv, facilitates the comparison of the quencher's accessibility to the tryptophan residues in aqueous solution or the membrane environment.
Brominated phosphatidylcholines cause only minor perturbations of the membrane and can therefore be used to analyze the depth of tryptophan insertion into the lipid bilayer (10). SUVs containing POPC-POPG (3:1 [mol/mol]), including 30% dibromo-POPC (155 μM final concentrations) were added to 3.5 μM HM1 in 20 mM sodium phosphate buffer, pH 6.0, and incubated at 20°C for 2 h. Emission spectra from 300 to 400 nm were recorded and averaged from 3 scans. The spectra were corrected from the baseline (the solution in the absence of peptide), and the integrals of the intensity spectra were taken for analyzing quenching effects. The depth of the tryptophan insertion was calculated by fitting the data using the distribution analysis method (11): ln(F0/Fh) × c(h) = [S/σ(2π)1/2] × exp[−(h − hm)2/2σ2], where F0 and Fh represent the intensities in the absence and presence of quencher (h), with c(h) being the concentration of the quencher (which is equal for all brominated lipids used). S is the area under the curve (effectiveness of quenching), σ is the dispersion of the depth in the bilayer, hm is the distance of tryptophan and h is the distances of the bromines from the center of the bilayer, which are 10.8, 8.3, and 6.3 Å for dibromo-(6,7)-, (9,10)-, and (11,12)-POPC, respectively (12).
Circular dichroism spectropolarimetry.
Circular dichroism spectropolarimetry was performed in 20 mM sodium phosphate buffer, pH 6.0, on a J-810 CD spectrometer (Jasco) with a bandwidth of 1 nm and a cuvette of 1-mm path length. SUV, DPC, or LPS micelles were gradually added to a 7 μM HM1 solution. The corresponding dilution factor was considered for each experiment. Eight scans with a scan speed of 100 nm/min were averaged, and the CD signal of the buffer was subtracted subsequently. Analysis of spectra was performed using Origin 6.0.
Heteronuclear solution NMR spectroscopy.
Two-dimensional (2D) 1H-15N heteronuclear single quantum coherence (HSQC) spectra and heteronuclear nuclear Overhauser effect (NOE) measurements were recorded for 0.3 mM uniformly 15N-labeled HM1 in 20 mM sodium phosphate buffer, 0.05% NaN3, 10% D2O, pH 6.0, on a Bruker Avance 600-MHz NMR spectrometer equipped with a 5-mm BBI (broadband inverse) 1H-2H probe with z gradient at 280, 293, and 313 K. Proton chemical shifts were referenced to the internal water signal, and nitrogen (15N) was calibrated indirectly to the water signal using the gyromagnetic ratios (13). The same experimental settings were used to investigate the stepwise addition of DPC-d38 to final concentrations of 2 mM, 10 mM, and 50 mM, recorded at 313 K. 15N-heteronuclear NOE relaxation measurements were acquired by standard techniques based on those of Farrow et al. (14), with a proton saturation period of 3.3 s. Spectra were processed using NMRPipe (15) and analyzed using NMRView (16) and Sparky 3 (T. Goddard and D. G. Kneller, University of California, San Francisco, CA). Normalized chemical shift perturbations, Δav, derived from 2D 1H-15N HSQC spectra, were calculated using the following equation (17): Δav = [(ΔδHN)2 + (ΔδN/5)2]1/2, where Δδ is the change of the chemical shift in parts per million.
The 1H-15N NOE values were calculated from the ratios of signal intensities in the saturated 2D spectrum to those in the unsaturated 2D spectrum, with evaluated errors described elsewhere (14). Assignments were derived from NMR data of the solution structure (Protein Data Bank [PDB] 2K35).
Solid-state NMR measurements.
Oriented sample preparations for solid-state NMR spectroscopic investigations were prepared by adding 1.5 mg of uniformly 15N-labeled HM1 in 20 mM sodium phosphate buffer, pH 6.0, to 60 mg of POPC-POPG (3:1 [mol/mol]) SUV suspension prepared in filter-sterilized water. The two solutions were mixed and subsequently dialyzed against water for 24 h at 22°C. Samples were subjected to ultracentrifugation at 110,000 × g and 4°C for 1.5 h. The supernatant was discarded, and the pellet was resuspended in H2O containing 0.05% NaN3. This suspension was carefully transferred onto 16 ultrathin cover glasses (6 by 11 mm; Paul Marienfeld GmbH & Co. KG) as described previously (18), and the solvent was evaporated at 22°C for 2 days, followed by rehydration in a chamber at 93% relative humidity for 4 days. Unoriented samples were prepared similarly without the ultracentrifugation steps and application on glass plates. Proteoliposome suspensions were directly applied to magic-angle spinning rotors for measurements.
Solid-state NMR spectra were recorded on Bruker Avance wide-bore NMR spectrometers equipped with a commercial double-resonance solid-state NMR probe modified with flattened coils of 15 by 4 by 9 mm. Proton-decoupled 15N solid-state NMR spectra were acquired at 17.6 T using a cross-polarization sequence and processed as described previously (19). NH4Cl (40.0 ppm) was used as an external reference corresponding to 0 ppm for liquid NH3. An exponential apodization function corresponding to a line broadening of 500 Hz was applied before Fourier transformation.
Proton-decoupled 31P solid-state NMR spectra were acquired at 9.4 T and 310 K using a phase-cycled Hahn echo pulse sequence, as described previously (19). The spectra were referenced externally to 85% H3PO4 at 0 ppm.
Deuterium solid-state NMR spectra were recorded at 7.1 T and 310 K using a quadrupolar echo pulse sequence, as detailed previously (20). The spectra were referenced relative to D2O (0 ppm). An exponential apodization function corresponding to a line broadening of 100 Hz was applied before Fourier transformation. The deuterium order parameters were analyzed according to the method of Bechinger and Salnikov (21).
Dynamic-light-scattering and static-light-scattering measurements.
Dynamic- and static-light-scattering measurements were performed on a Laser-Spectroscatter 201 (RiNA) at an angle of 90° and a temperature of 22°C. SUV suspensions were gradually applied to 100 μM HM1 in 50 mM sodium phosphate buffer, pH 5.6, mixed carefully, and incubated for 5 min. Subsequently, after centrifugation for 5 min at 5,000 × g at room temperature (RT), 10 μl was placed in a quartz cuvette and the size distribution was depicted as the median of 10 measurements for each titration step. For data interpretation, particles with an occurrence of <0.1 were ignored. The final particle size was expressed as the median.
SLS measurements were used for analyzing the formation of aggregates. For monodispersed suspensions, the intensity is proportional to the number of added vesicles, and deviations from linearity indicate samples with particles of different sizes, as described previously (22).
Aggregation of bacteria.
Bacterial strains were grown in brain heart infusion broth at 37°C for 2 to 3 h. The cells were washed twice in 10 mM sodium phosphate buffer, pH 7.2, supplemented with 1% (vol/vol) tryptic soy broth, and the cell number was adjusted to 107 to 108 cells/ml. From the prepared cell suspension, 2 μl was mixed with 2 μl of HM1 (1-μg/μl stock) dissolved in acidified water (0.01% [vol/vol] trifluoroacetic acid). As negative controls, bacterial suspensions mixed with 2 μl of peptide solvent were used. After incubation at 22°C for 10 min, 1 μl of sample was spotted on an object slide and left for air drying before micrographs were recorded (Keyence; BZ9000 Biorevo).
RESULTS
In this study, experiments were performed using lipid mixtures of POPC-POPG (3:1 [mol/mol]) or POPE-POPG (3:1 [mol/mol]), and the results were compared to those of studies with E. coli total lipid extract to mimic the best model membranes of prokaryotic cytoplasmic membranes.
Aggregation of lipid vesicles induced by HM1.
DLS and SLS experiments were performed to analyze the aggregation process of lipid vesicles upon HM1 binding as a function of membrane lipid composition. By stepwise addition of SUV suspensions composed of E. coli total lipid extract (Fig. 1a), POPC-POPG (3:1 [mol/mol]) (Fig. 1b), or POPE-POPG (3:1 [mol/mol]) (Fig. 1c), the hydrodynamic radii of particles alone or in the presence of a constant amount of HM1 and the corresponding static light scattering were recorded. At a lipid-to-peptide (L/P) ratio of 1.2, DLS measurements already revealed aggregates twice the size of the untreated vesicles. Further addition of vesicles resulted in higher molecular aggregates with radii of >1 μm at L/P ratios of 10.5, 8.8, and 7.1 for SUVs containing E. coli total lipid extract, POPC-POPG (3:1 [mol/mol]), or POPE-POPG (3:1 [mol/mol]), respectively. Interestingly, despite all vesicles sharing the same initial size, maximal binding and precipitation were reached at L/P ratios of ∼37 only for E. coli total lipid extract and POPC-POPG (3:1 [mol/mol]) vesicles, but not for POPE-POPG (3:1 [mol/mol]), even up to the end of the titration experiment (Fig. 1).
Fig 1.

Aggregation of lipid vesicles induced by HM1. DLS (top) and SLS (bottom) measurements were performed with 100 μM HM1 at pH 5.6 at RT in the presence of increasing concentrations of lipid SUVs composed of E. coli total lipid extract (a), POPC-POPG (3:1 [mol/mol]) (b), or POPE-POPG (3:1 [mol/mol]) (c) (circles). As controls, all vesicle concentrations were also measured in the absence of HM1 (squares). For DLS measurements, the data points indicate the medians of maximal and minimal particle sizes (error bars) out of 10 measurements. SLS data points are expressed as mean values of 10 measurements, with the error bars indicating the corresponding standard deviations. rh, hydrodynamic radius.
The corresponding SLS spectra of the DLS titration experiments revealed distinct scattering by high-molecular-weight particles at L/P ratios between 8.8 and 37 for SUVs composed of E. coli total lipid extract (Fig. 1a) or POPC-POPG (3:1 [mol/mol]) (Fig. 1b), respectively, in the presence of HM1. Here, SLS intensities initially decreased due to vesicle aggregation but started to increase at ratios of 37 and 50, indicating that all of the protein was associated with membranes. Therefore, the addition of vesicle stock suspension resulted in an increase in the SLS intensity. On the other hand, measurements with SUVs composed of POPE-POPG (3:1 [mol/mol]) showed low SLS intensities up to the very end of the experiment (Fig. 1c), indicating lower binding affinity.
The monodispersity of the SUV suspensions in the absence of HM1 was coherent with the progression of the SLS spectra and the uniform size distribution found by DLS measurements.
Conformational analysis of HM1 lipid binding by CD spectropolarimetry.
In order to analyze changes in the secondary overall structure of HM1 upon lipid-peptide interaction, CD spectropolarimetry investigations were performed using lipid vesicles and DPC micelles. Interpretation of the spectra must be done cautiously. The aggregation and subsequent precipitation of lipid-peptide aggregates that occurred upon interaction with each of the lipid compounds resulted in light scattering and therefore caused an artificial decrease of the ellipticity due to loss of peptide concentration. However, whereas the titration experiments using E. coli total lipid extract (Fig. 2a) and POPC-POPG (3:1 [mol/mol]) (Fig. 2b) exhibited similar spectra for HM1, the decrease in ellipticity was less pronounced upon interaction with POPE-POPG (3:1 [mol/mol]) (Fig. 2c) vesicles. In the case of DPC micelles, the ellipticity slightly increased at the beginning, when the concentrations were below the critical micelle concentration (cmc) (∼1 mM) (Fig. 2d). Above this concentration, the ellipticity decreased, as observed with the SUVs. As the DPC micelles represent a minimalist lipid-membrane system and the precipitation appeared to be less pronounced than for the lipid vesicles, they were used for further structural investigations by solution NMR spectroscopy. In summary, the overall shapes of the CD spectra at low L/P ratios (7 to 17 μM lipid concentration, or below the cmc of DPC) showed only small variations, which indicates minor conformational alterations of secondary-structure elements of HM1 upon lipid interaction.
Fig 2.

CD spectra of HM1 with increasing concentrations of mixed SUVs. (a to c) CD spectra were collected for 7 μM HM1 at pH 6.0 at 37°C and lipid SUVs composed of E. coli total lipid extract (a), POPC-POPG (3:1 [mol/mol]) (b), and POPE-POPG (3:1 [mol/mol]) (c) were gradually added. (d) HM1 was associated with DPC micelles at increasing concentrations. The spectra represent the averages of eight measurements. MRW, mean residue weight.
Tryptophan fluorescence analysis of HM1 upon lipid binding.
HM1 possesses five solvent-exposed tryptophan residues, facilitating peptide-lipid interaction studies by tryptophan emission fluorescence spectroscopy. In general, tryptophan emission maxima undergo a shift to shorter wavelengths (blue shift) and show an increase of fluorescence intensity upon lipid interaction, caused by polarity changes in the environment of the indole rings. Here, the emission fluorescence intensity of HM1 decreased upon binding to lipid vesicles composed of E. coli total lipid extract (Fig. 3a), POPC-POPG (3:1 [mol/mol]) (Fig. 3b), and POPE-POPG (3:1 [mol/mol]) (Fig. 3c) at 37°C originating from visible precipitation events. Since the precipitation does not interfere with measurements of the fluorescence emission wavelength, the observed blue shift was analyzed to quantify the binding process of HM1 to SUVs and micelles. Considering the phase transition temperature (25°C) of POPE, experiments were performed at room temperature and at 37°C. The overall blue shifts of the tryptophan emission fluorescence maxima of HM1 upon interaction with vesicles composed of POPC-POPG (3:1 [mol/mol]) or E. coli total lipid extract were not affected by temperature and amounted to 7 to 8 nm at an L/P ratio of ∼32 (115 μM lipid concentration) (Fig. 3d). Comparable shifts were observed in the presence of DPC (Fig. 3e) and LPS (Fig. 3f) micelles, indicating equal changes of the environmental polarity. On the other hand, upon interaction with POPE-POPG (3:1 [mol/mol]) vesicles, tryptophan fluorescence emission maxima shifted only to 4 nm (Fig. 3d).
Fig 3.

Tryptophan emission fluorescence measurements of HM1 upon lipid interaction. (a to d) Tryptophan emission fluorescence spectra are shown for 3.5 μM HM1 at pH 6.0 at 37°C with various concentrations of lipid SUVs composed of E. coli total lipid extract (a), POPC-POPG (3:1 [mol/mol]) (b), or POPE-POPG (3:1 [mol/mol]) (c) with sigmoidal fitting of the shifts of the emission maxima (d). (e and f) HM1 was also incubated with the stepwise addition of DPC (e) or LPS (f) micelles, and the binding data were fitted sigmoidally. The data points show the averages of three measurements. a.u., arbitrary units.
To quantitatively analyze the titration experiments, data were fitted sigmoidally to obtain apparent dissociation constants and Hill coefficients of the HM1-lipid interaction (Table 1). In SUVs composed of E. coli total lipid extract and POPC-POPG (3:1 [mol/mol]), the dissociation constants and Hill coefficients were in a similar range (∼50 to 75 μM and ∼3.2 to 4.5), showing minor temperature sensitivity. The results indicate comparable insertion modes for these lipid mixtures. Moreover, the strong peptide-lipid interactions of HM1 are equivalent to previously reported apparent binding constants of antimicrobial peptides (23–25). On the other hand, binding of HM1 to POPE-POPG (3:1 [mol/mol]) was 2 to 3 times less effective.
Table 1.
Kd and Hill coefficients calculated for HM1 upon various peptide-lipid interactions at different temperatures
| Condition | Ta | Kd | nb |
|---|---|---|---|
| DPC | RT | 15.65 ± 4.12 mM | 5.47 ± 0.45 |
| LPS | RT | 11.92 ± 2.46 μM | 2.13 ± 0.15 |
| 37 | 8.86 ± 1.47 μM | 1.99 ± 0.12 | |
| E. coli extract | RT | 75.07 ± 2.38 μM | 4.46 ± 0.51 |
| 37 | 63.87 ± 2.51 μM | 3.23 ± 0.35 | |
| POPE-POPG (3:1) | 37 | 155.5 ± 3.13 μM | 2.72 ± 0.18 |
| POPC-POPG (3:1) | RT | 55.93 ± 1.77 μM | 3.24 ± 0.30 |
| 37 | 49.48 ± 2.01 μM | 4.57 ± 0.79 |
T, temperature (°C).
n, Hill coefficient.
The sigmoidal shape of the fitting curves reflects a strong positive cooperativity upon insertion of tryptophan residue side chains into lipid membranes. The interaction of HM1 with DPC micelles showed similar progression (Fig. 3e), whereas the interaction with LPS micelles was less pronounced (Fig. 3f).
Insertion of HM1 into lipid vesicles.
Insertion of tryptophan residues of HM1 was investigated by tryptophan emission fluorescence intensity quenching with acrylamide as the collisional quencher. Acrylamide was gradually added to HM1 in solution, alone or together with 7 mM DPC or 56 μM LPS micelles or 155 μM POPC-POPG (3:1 [mol/mol]) vesicles at pH 6.0 (Fig. 4a). From the plot of the fluorescence intensity decrease and the quencher concentration, Stern-Vollmer constants were calculated for each condition. The Ksv value of 7.53 ± 0.13 M−1 for tryptophan residues of HM1 in solution was between reported constants of fully exposed (e.g., N-acetyl-l-tryptophan amide, 17.5 M−1) (26) and buried (e.g., Staphylococcus aureus alpha toxin, 0.58 M−1) (27) tryptophan residues. This implies localization at the interface between the hydrophobic core of the peptide and the aqueous environment, consistent with the structural data (5). Upon micelle or SUV interaction, the tryptophan residues became protected by insertion into the lipid bilayer accompanied by quenching constants of 1.6 ± 0.03 M−1 and 1.97 ± 0.22 M−1 for POPC-POPG (3:1 [mol/mol]) SUVs and LPS micelles, respectively. The more pronounced quenching of tryptophan residues within DPC micelles (3.60 ± 0.07 M−1) was apparent due to the partial permeability of acrylamide in DPC (28).
Fig 4.
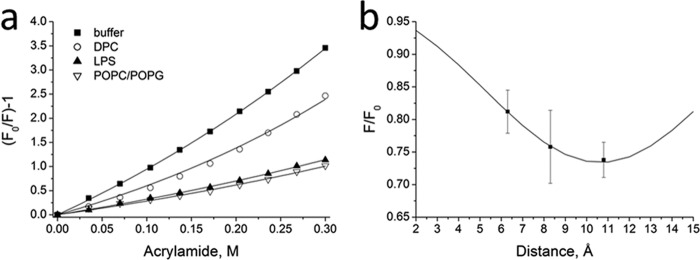
Tryptophan emission fluorescence quenching measurements reveal tryptophan insertion depths of HM1 into lipid bilayers. (a) Stern-Vollmer plot for 3.5 μM HM1 in the absence or in the presence of 7 mM DPC, 56 μM LPS, or 155 μM POPC-POPG (3:1) SUVs at pH 6.0, respectively. Stern-Vollmer quenching constants were calculated according to the fit of the experimental data (see the text for details). (b) Collisional quenching of HM1 tryptophan residues by brominated POPC. Shown is a plot of the fluorescence intensity as a function of quencher distance from the bilayer center. The solid line represents the best fit of the mean of three experiments, with the error bars indicating standard deviations.
Furthermore, the overall penetration depth for all tryptophan residues was investigated by emission fluorescence quenching using brominated phosphatidylcholine substituted at different acyl-chain positions. HM1 was associated with vesicles composed of bromine-substituted POPC lipids in a mixture of POPC-POPG (3:1 [mol/mol]) at an L/P ratio of 50, and the tryptophan emission fluorescence intensity was compared to that of pure POPC-POPG vesicles (Fig. 4b). The plot of the fluorescence intensity against the distance of the bromide groups allowed the calculation of the overall penetration depth of tryptophan side chains by distribution analysis. The fitting of the data revealed an average most probable distance from the center of the POPC-POPG bilayer of 10.64 ± 0.1 Å. The tryptophan residue side chains, therefore, penetrate the interfacial region at most up to ∼4 Å into the hydrocarbon region, which indicates an overall localization of HM1 in the head group region of the membrane bilayer.
Determination of lipid binding epitopes of HM1 by solution NMR spectroscopy.
To investigate the amino acid residues participating in lipid binding upon HM1 interaction, 2D 1H-15N HSQC spectra and 15N-heteronuclear NOE experiments were recorded with uniformly 15N-labeled HM1 alone or in the presence of increasing concentrations of deuterated DPC micelles and as a function of temperature. DPC micelles were applied to provide a minimalist membrane environment that reflects HM1-lipid interactions reasonably well (Fig. 2 and 3). The 15N-heteronuclear NOE relaxation data revealed fast motion of the monomeric HM1 in solution at the N terminus and loop regions encompassing residues 18 to 25 and 44 to 50, with NOE values of <0.8 (Fig. 5a). By increasing the experimental temperature from 283 K to 313 K, this effect became even more pronounced, in particular for the loop region of residues 18 to 25, with values as low as 0.2 to 0.3. Secondary-structure elements of residues 9 to 14 and 26 to 32 (α-helices) and 39 to 43 and 55 to 60 (β-sheets) are restricted in motion, with heteronuclear NOE values approaching 0.7 at 313 K.
Fig 5.

15N relaxation and chemical-shift measurements of HM1 in solution and in the presence of DPC micelles. (a and b) 15N-heteronuclear NOE experiments with 0.3 mM uniformly 15N-labeled HM1 in solution at various temperatures (a) and in the presence of various DPC-d38 micelle concentrations at 313 K (b). (c and d) Normalized chemical shift perturbations (Δav) were calculated for 0.3 mM uniformly 15N-labeled HM1 in solution at different temperatures (c) and in the presence of various DPC-d38 micelle concentrations derived from 2D 1H-15N HSQC spectra and referenced to HM1 in solution at 313 K (d). The vertical dotted lines indicate proline residue locations. (e) 2D 1H-15N HSQC spectra of HM1 alone (blue) or in the presence of various concentrations of DPC-d38. The inset shows the chemical-shift perturbation of indole rings of tryptophan side chains of HM1 upon lipid interaction. (f) Ribbon representations of HM1 (PDB 2K35) summarizing amides and corresponding side chains of amino acid residues that exert significantly increased (green) or decreased (blue) 15N heteronuclear NOE values upon interaction with 50 mM DPC micelles. At 2 mM DPC concentration, the loop region from residues 18 to 25 (orange) revealed lipid binding participation. Residues that did not show significant changes are depicted in gray. (g) Ribbon representations of HM1 showing amides and corresponding side chains of amino acid residues that exert chemical perturbations of >0.1 ppm (green) or >0.2 ppm (orange) caused by interaction with 10 mM DPC micelles. Undetectable resonances caused by fast exchange between HM1 and 50 mM DPC micelles are colored blue. Residues that did not show significant changes are depicted in gray.
Upon the stepwise addition of DPC at 313 K, lipid-interacting residues showed slower motion and therefore higher heteronuclear NOE values (Fig. 5b). In the presence of 50 mM DPC micelles, significantly increased heteronuclear NOE values were observed, particularly for Trp (6, 9, 24, and 55), Lys (25, 52, and 53), Ser (26 and 51), Arg (38 and 47), and Tyr (60) residues. Additionally, decreased values, implying greater motion upon lipid interaction, were measured, in particular for Asp residues (4 and 29), apparently caused by the opening of salt bridges with residues participating in lipid binding (e.g., Arg47 and Lys25). Remarkably, the loop region, residues 18 to 25, revealed low NOE values in the presence of 2 mM DPC that have not been observed without micelles or at higher micelle concentrations, indicating initial micelle binding events that restrict motion but lead to an exchange between the amides of these residues and the micellar interface at higher detergent concentrations.
Normalized chemical-shift differences of HM1 in solution were calculated from the 2D 1H-15N HSQC spectra at different temperatures and referenced to the chemical shifts at 313 K (Fig. 5c). Strong intrinsic changes in the amides' surrounding chemical environment approaching chemical-shift differences of >0.2 ppm were detected for residues Val3, Trp24, and Leu50, which corroborates the flexibility of the corresponding regions mentioned above (the N terminus and loop regions 18 to 25 and 44 to 50).
In the presence of DPC micelles, several chemical-shift differences could be observed, indicating structural changes of amino acid residues upon lipid interaction and the formation/opening of salt bridges (Fig. 5d and e). At 10 mM DPC, all Trp residues (6, 9, 15, 24, and 55), as well as neighboring amino acid residues (Asp4, Cys5, Thr8, Ser10, Thr13, Leu23, Lys25, Arg30, Cys 41, Glu42, Glu43, Ser46, Arg47, Lys53, and Thr56), were affected by interactions with the micellar surface (chemical shift difference, >0.2 ppm). At 50 mM DPC, several resonances disappeared due to exchange between the micellar interface and HM1. Most affected were the amide groups of residues Glu7, Trp15, Gly18, Gly21, Thr22, Leu23, and Asn28, again emphasizing the participation of the loop region (residues 18 to 25) in the lipid binding process.
The corresponding 2D 1H-15N HSQC spectra for HM1 alone or upon increasing DPC concentrations are shown in Fig. 5e. In particular, the shifts of all tryptophan indole ring resonances upon lipid interaction are emphasized. Figure 5f and g summarize graphically the results of the 15N-heteronuclear NOE relaxation experiments (Fig. 5f) and the normalized chemical-shift differences from 2D 1H-15N HSQC spectra (Fig. 5g) of HM1 with DPC micelles at 313 K. Both experiments revealed two distinct epitopes on opposite sides of the molecule, consisting of Asp4, Trp6, Trp15, Gln17, Trp24, Leu23, Trp24, Lys25, Ser26, Arg30, and Lys53 and of Thr8, Thr13, Trp9, Ser10, Arg38, Gln40, Cys41, Glu42, Glu43, Ser46, Arg47, Trp55, Thr56, Ile58, and Tyr60, respectively. These epitopes are separated by residues that showed no significant effect on motion or the chemical environment in the presence of DPC micelles.
Topological analysis of HM1 on lipid membranes by solid-state NMR spectroscopy.
To analyze the topology of HM1 on model membranes of Gram-negative bacteria, phospholipid mixtures comprised of POPC-POPG (3:1 [mol/mol]) were applied, where HM1 exerted binding affinities and vesicle aggregation comparable with E. coli total lipid mixtures derived from previous measurements (Fig. 1, 2, and 3). Proton-decoupled 1D 15N and 31P spectra, as well as 2H quadrupolar-splitting experiments, were performed by solid-state NMR spectroscopy to analyze the spatial orientation of the α-helices of HM1 on the membrane and the effect of the organization of lipid bilayers upon peptide-lipid interaction. The proton-decoupled 1D 15N spectrum of uniformly labeled HM1 reconstituted into oriented POPC-POPG (3:1 [mol/mol]) membranes revealed anisotropic chemical shifts of predominantly <100 ppm (Fig. 6a). This region is characteristic of 15N resonances originating from isotropic side chain resonances of arginine (74 and 88 ppm), tryptophan (84 ppm), lysine (37 ppm), and asparagine and glutamine (118 ppm) residues (29), as well as 15N-H amide bonds that are oriented approximately parallel to the membrane surface (30). Due to the geometry of α-helical secondary structures and the unique properties of the amide 15N chemical-shift tensor, the 15N chemical-shift measurements obtained from such uniaxially oriented samples provide a direct indicator of the approximate tilt angle of helical elements. Figure 6a (bottom) shows a simulated 15N solid-state NMR spectrum of uniformly labeled HM1, in agreement with the experimental spectrum, indicating that most of the α-helices of HM1 apparently adopted a parallel orientation relative to the membrane surface upon peptide-lipid interaction, which corroborates the observation that micelle-interacting amino acid residues are located at these regions which were already determined by 1H-15N-heteronuclear solution NMR measurements (Fig. 5f and g).
Fig 6.

Topological analysis and lipid interaction measured by solid-state NMR spectroscopy. (a) (Top) Proton-decoupled 1D 15N spectrum of 1.5 mg uniformly 15N-labeled HM1 reconstituted into 60 mg POPC-POPG (3:1 [mol/mol]) oriented bilayers for the membrane normal in parallel orientation to the external magnetic field direction. (Inset) The corresponding simulated 15N spectrum was obtained from the PDB file 2K35 in the manner indicated, with the x axis in plane with the bilayer normal. (b) Proton-decoupled 1D 31P spectra of oriented phospholipid bilayers composed of POPE-POPG (3:1) (top) or POPC-POPG (3:1) (bottom) alone (gray) or in the presence of 0.1 mol% HM1 (black) at 310 K. (c) 1D 2H quadrupolar-splitting spectra of unoriented POPC-d31–POPG (3:1) vesicles were recorded alone (black solid line) or in the presence of 0.1 (black dotted line), 0.5 (gray dotted line), or 1.0 (gray solid line) mol% HM1 at 310 K. (d) Corresponding plot of the order parameter (SCD) for each chain position of the membrane alone or in the presence of increasing HM1 concentrations.
The corresponding proton-decoupled 31P spectra of oriented POPC-POPG (3:1 [mol/mol]) alone and with 0.1 mol% HM1 are shown in Fig. 6b (bottom). The membranes exhibit predominant 31P solid-state NMR resonances in the 25-ppm region, indicative of well-aligned phospholipid membranes with their long axes parallel to the bilayer normal. Upon interaction with HM1, additional intensities appear that reach into the −15 ppm region, indicating perturbations in the lipid packing and/or conformational rearrangements of the phospholipid head groups. In contrast, the anisotropic 31P spectrum of oriented POPE-POPG (3:1 [mol/mol]) membranes alone and in the presence of 0.1 mol% HM1 exhibited significantly broader line shapes (Fig. 6b, top) with a smaller extent of resonance intensities in the −15-ppm region than POPC-POPG.
In order to analyze the motion and structural interference of HM1 at the level of phospholipid acyl chains, 2H quadrupolar-splitting data were recorded for unoriented POPC-d31/POPG (3:1 [mol/mol]) vesicles at different HM1 concentrations (Fig. 6c). The corresponding order parameters for the chain positions are summarized in Fig. 6d. Even at high HM1 concentrations (0.5 to 1.0 mol%), only minor effects of the acyl chain order parameters could be detected. Together with the results from 31P measurements, already showing perturbations of phospholipid head groups induced by 0.1 mol% HM1, these data suggested binding of HM1 at the lipid interfacial head group region without deeper insertion of the α-helices or other parts of the peptide into the membrane bilayer.
Aggregation of living bacteria by HM1.
Several Gram-negative and Gram-positive bacteria that have been shown to be sensitive to HM1 (5, 7) were screened in order to investigate the formation of cell aggregates upon administration of dosages of HM1 (0.14 μM peptide [∼2 μg/ml] per 104 to 105 cells/ml) less than or equal to the corresponding MBC/LD90 values (see Table S1 in the supplemental material). The results show that cell aggregation occurred with most of the test strains throughout both of the groups examined (Fig. 7; see Fig. S1 in the supplemental material). The Gram-negative bacterial strains Burkholderia cepacia ATCC 17759 (data not shown) and Proteus mirabilis ATCC 21100 (see Fig. S1c in the supplemental material), as well as the Gram-positive strains Staphylococcus haemolyticus ATCC 29970 (see Fig. S1h in the supplemental material), Staphylococcus hominis ATTC 27844 (data not shown), and Streptococcus pneumoniae ATTC 33400 (data not shown), did not show the formation of cell aggregates after treatment with HM1.
DISCUSSION
Hydramacin-1 exerts broad antimicrobial activity against Gram-negative and Gram-positive bacteria (5, 7). However, in some cases, the concentration (0.14 μM HM1 [∼2 μg/ml] per 104 to 105 cells/ml) used in the current study to screen for aggregation-sensitive bacteria was 100 times smaller than the determined LD90/MBC (see Table S1 in the supplemental material), and in particular, the incubation time did not exceed 10 min. Consequently, the corresponding HM1-treated bacterial strains still contain viable cells. Besides the ultimate eradication of bacteria, the biological purpose of the aggregation effect by HM1 might be to reduce the chance of single bacterial cells invading the host. If bacteria stick together, they are focused in a constricted compartment, which might support a concerted attack by other defense molecules. Such a concerted attack of bacterial aggregates at a focused location would reduce the necessary amount of defense molecules compared to a situation where bacteria can scatter freely over wide host compartments.
The proposed model for HM1-membrane interaction is termed the barnacle model, in which bacteria become agglutinated by peptide-lipid interaction due to the unique distribution of hydrophobic and cationic amino acid side chains on the surface of the peptide. We focused on scrutinizing the barnacle model in detail, as commonly established models describing pore formation (e.g., barrel stave and toroidal-pore models) or membrane permeabilization by micellization (e.g., the carpet model) insufficiently explain HM1 membrane interactions. The aggregating activity of HM1 on lipid membranes, as well as living Gram-positive and Gram-negative bacterial strains, is caused by two distinct epitopes, mostly comprising tryptophan, serine, or threonine and the cationic amino acid residues lysine and arginine. The primary structure of HM1 contains four regions that include tryptophan residues in close proximity to serine/threonine and cationic amino acid residues in the arrangement (S/T)(X)W(K/R)(S/T)(K/R), which we named the SWT(K/R) motif (Fig. 8a). In particular, residues of this motif were reported to favor interaction and localization in the membrane interface (31). Lysine and arginine residues facilitate initial electrostatic interaction with anionic lipids, and tryptophan residues are preferentially localized in the head group region of bilayers governed and stabilized by cation-π and hydrophobic interactions (32–34). Moreover, serine and threonine residues stabilize peptide-lipid binding by hydrogen bonding with phospholipid head groups (31). Our data demonstrate the participation of various of these SWT(K/R) motif residues in lipid binding. This reasonably accounts for the high apparent binding constants of HM1 with model membranes of Gram-negative bacteria (e.g., E. coli total lipid extract and POPC-POPG [3:1]), which are in a range of apparent partition constants described for magainin 2 (70,000 M−1) (23), melittin (60,000 M−1) (24), or cecropin P1 (157,000 M−1) (25). The sigmoidal progression of the tryptophan binding reflects the cooperative insertion of indole side chains, alleviating penetration of further residues. This effect was less pronounced for HM1-LPS interaction, suggesting a different mode of binding arrangement governed by high affinity. However, we observed an interfacial localization of the tryptophan residue side chains down to a maximal insertion 4 Å deep into the membrane bilayer without affecting the acyl chain order parameter (Fig. 8b). This observation has previously been made by solid-state NMR measurements (35), where membrane-associated tryptophan analogues showed minor effects on the bilayers' order parameter, as well.
Fig 8.
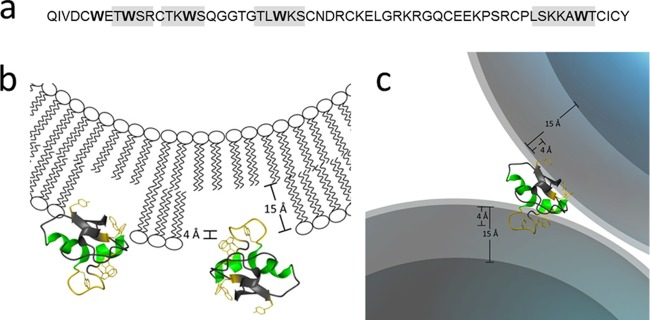
Refined barnacle model for the HM1-lipid interaction. (a) The primary structure of hydramacin-1 contains four SWT(K/R) motifs (gray boxes) located around tryptophan residues (boldface). The amino acid residues of the motif favor an interfacial insertion upon lipid interaction. (b) Hydramacin-1 contains two distinct epitopes (see the text for details) located on opposite sides of the molecule (yellow) comprising SWT(K/R) motifs. The epitopes consist of amino acid residues that favor interfacial insertion upon peptide-lipid interaction accompanied by parallel orientation of the small alpha helices toward the bilayer. (c) The HM1-lipid interaction causes aggregation of lipid particles (e.g., Gram-negative bacteria), finally resulting in precipitation.
Assuming an average size of 45 nm for unilamellar lipid vesicles derived from DLS measurements, one can calculate the amount of bound HM1 per vesicle. The maximal concentration of lipid-bound HM1 was reached at L/P ratios of 32 or 50, determined by tryptophan emission fluorescence and DLS measurements, respectively. With a cross-sectional area of 70 Å2 for phospholipid molecules and a bilayer thickness of 40 Å, a single vesicle contains approximately 66,000 phospholipid molecules. Although HM1 faces only lipid molecules of the outer lipid layer, one molecule is sufficient for interaction with two vesicles, indicating that 1,320 to 2,060 peptide molecules cover a single lipid vesicle with a 45-nm radius. In this case, the available lipid surface area for one HM1 molecule appears to be 12.4 to 19.3 nm2 (35 by 35 Å to 44 by 44 Å), which is consistent with a single peptide molecule binding and inserting, even when accompanied by conformational changes in the loop regions, requiring more space.
Another macin family member, neuromacin, was also shown to aggregate bacteria and liposomes (6). The designated SWTK/R motif is also present in neuromacin, although it is not as prominent as in HM1. Nevertheless, both peptides show very similar molecular surface properties comprising two uncharged/hydrophobic hemispheres that sandwich a ring of cationic charges (6). Though the SWTK/R motif is well suited to explain the HM1-membrane interaction and subsequent aggregation in the case of neuromacin, the characteristic composition of the overall molecular surface of the peptide consequently must be partially complemented by alternative amino acid residues. However, the SWT(K/R) structural motif, to our knowledge, has not been described in the literature so far, but the functional properties of aromatic patches consisting of several tryptophan residues were already outlined for domains of pore-forming toxins (PFTs). For instance, domain 4 (D4) of perfringolysin O, a cholesterol-specific cytolysin from Clostridium perfringens, enables the initial recognition of cholesterol inside the membrane. The localization of the whole domain on the surface of the membrane is accomplished by the insertion of a short hydrophobic loop consisting of three tryptophan residues into the interfacial region of the membrane bilayer (36). The pore formation is therefore a consequence of the initial cholesterol-dependent attachment of D4.
Moreover, aromatic clusters comprising tryptophan and tyrosine residues facilitate the toxin-lipid interaction of equinatoxin II, a sphingomyelin-dependent actinoporin from sea anemones. The two-step process of pore formation is induced by two aromatic clusters responsible for the initial attachment of the toxin to the membrane surface. Lipid binding allows translocation of an amphipathic N-terminal helix, which induces pore formation (37). It is noteworthy that, based on a homology search of conserved P-(WYF)-D patterns, proteins from Hydra spp. show phylogenetic similarities to AL (actinoporin-like) proteins (ALPs) comprising the so called AF (actinoporin-like proteins/fruiting body lectin) domain (38). Although HM1 does not form pores (5), the lipid binding properties shown by tryptophan-rich regions of ALPs are also conserved. Functional differences can therefore be explained by the lack of membrane-penetrating structural features, like sufficiently long amphipathic helices. HM1 from H. magnipapillata might therefore resemble an ancestral peptide for the evolution and function of pore-forming toxins.
However, HM1 contains two lipid binding epitopes, and by the SWT(K/R) motif, the whole peptide is localized efficiently at the surface of the membrane, mediated by various intermolecular interactions with phospholipid head groups (Fig. 8c). The stabilization and attachment in the interfacial membrane region is essential for the aggregating function of HM1, since deeper insertion prevents the small peptide from associating with another lipid bilayer. It is speculative to prefer the initial lipid insertion of one epitope to that of the other, but this will be the basis for further scientific investigations. Finally, our data expand the knowledge of the molecular modes of action antimicrobial peptides use to tackle their target cells and consolidates the barnacle model among the established models. Furthermore, the revelation of the SWT(K/R) motif clearly shows the direction for future approaches in antimicrobial peptide design with respect to amino acid selection and arrangement. The barnacle effect may be relevant to the coating of surfaces in order to increase their adhesion to bacteria, e.g., in biosensors, filters, and disposable towels.
Supplementary Material
ACKNOWLEDGMENTS
We express our gratitude to Jesus Raya, Evgeniy S. Salnikov, and Christopher Aisenbrey for support with the solid-state NMR measurements and simulations. We thank Silvia Voss for excellent technical assistance.
M.M. conceived the study and performed experiments, data analysis, and interpretation. S.J. produced recombinant peptides and performed bacterial-aggregation assays, together with R.P. B.V. contributed to solution NMR experiments. J.G., B.B., and S.J. directed the study. M.M. and S.J. wrote the manuscript.
We declare no conflict of interest.
We gratefully acknowledge financial support for M.M. by the Deutsche Forschungsgemeinschaft (DFG) (MI 1472/1-1). This work was also supported by the excellence cluster Inflammation at Interfaces, the CNRS (Centre National de la Recherche Scientifique), and the Laboratory of Excellence Chemistry of Complex Systems, supported by the French Ministry of Research.
Footnotes
Published ahead of print 15 April 2013
Supplemental material for this article may be found at http://dx.doi.org/10.1128/AAC.02498-12.
REFERENCES
- 1. Zasloff M. 2002. Antimicrobial peptides of multicellular organisms. Nature 415:389–395 [DOI] [PubMed] [Google Scholar]
- 2. Jenssen H, Hamill P, Hancock RE. 2006. Peptide antimicrobial agents. Clin. Microbiol. Rev. 19:491–511 [DOI] [PMC free article] [PubMed] [Google Scholar]
- 3. Shai Y. 1999. Mechanism of the binding, insertion and destabilization of phospholipid bilayer membranes by alpha-helical antimicrobial and cell non-selective membrane-lytic peptides. Biochim. Biophys. Acta 1462:55–70 [DOI] [PubMed] [Google Scholar]
- 4. Wilmes M, Cammue BP, Sahl HG, Thevissen K. 2011. Antibiotic activities of host defense peptides: more to it than lipid bilayer perturbation. Nat. Prod. Rep. 28:1350–1358 [DOI] [PubMed] [Google Scholar]
- 5. Jung S, Dingley AJ, Augustin R, Anton-Erxleben F, Stanisak M, Gelhaus C, Gutsmann T, Hammer MU, Podschun R, Bonvin AM, Leippe M, Bosch TC, Grötzinger J. 2009. Hydramacin-1, structure and antibacterial activity of a protein from the basal metazoan Hydra. J. Biol. Chem. 284:1896–1905 [DOI] [PubMed] [Google Scholar]
- 6. Jung S, Sönnichsen FD, Hung CW, Tholey A, Boidin-Wichlacz C, Haeusgen W, Gelhaus C, Desel C, Podschun R, Waetzig V, Tasiemski A, Leippe M, Grötzinger J. 2012. Macin family of antimicrobial proteins combines antimicrobial and nerve repair activities. J. Biol. Chem. 287:14246–14258 [DOI] [PMC free article] [PubMed] [Google Scholar]
- 7. Bosch TC, Augustin R, Anton-Erxleben F, Fraune S, Hemmrich G, Zill H, Rosenstiel P, Jacobs G, Schreiber S, Leippe M, Stanisak M, Grötzinger J, Jung S, Podschun R, Bartels J, Harder J, Schröder JM. 2009. Uncovering the evolutionary history of innate immunity: the simple metazoan Hydra uses epithelial cells for host defence. Dev. Comp. Immunol. 33:559–569 [DOI] [PubMed] [Google Scholar]
- 8. Dubreil L, Compoint JP, Marion D. 1997. Interaction of puroindolines with wheat flour polar lipids determines their foaming properties. J. Agric. Food Chem. 45:108–116 [Google Scholar]
- 9. Chang YC, Ludescher RD. 1994. Local conformation of rabbit skeletal myosin rod filaments probed by intrinsic tryptophan fluorescence. Biochemistry 33:2313–2321 [DOI] [PubMed] [Google Scholar]
- 10. Bolen EJ, Holloway PW. 1990. Quenching of tryptophan fluorescence by brominated phospholipid. Biochemistry 29:9638–9643 [DOI] [PubMed] [Google Scholar]
- 11. Ladokhin AS, Wang L, Steggles AW, Malak H, Holloway PW. 1993. Fluorescence study of a temperature-induced conversion from the “loose” to the “tight” binding form of membrane-bound cytochrome b5. Biochemistry 32:6951–6956 [DOI] [PubMed] [Google Scholar]
- 12. McIntosh TJ, Holloway PW. 1987. Determination of the depth of bromine atoms in bilayers formed from bromolipid probes. Biochemistry 26:1783–1788 [DOI] [PubMed] [Google Scholar]
- 13. Markley JL, Bax A, Arata Y, Hilbers CW, Kaptein R, Sykes BD, Wright PE, Wüthrich K. 1998. Recommendations for the presentation of NMR structures of proteins and nucleic acids. J. Mol. Biol. 280:933–952 [DOI] [PubMed] [Google Scholar]
- 14. Farrow NA, Muhandiram R, Singer AU, Pascal SM, Kay CM, Gish G, Shoelson SE, Pawson T, Forman-Kay JD, Kay LE. 1994. Backbone dynamics of a free and phosphopeptide-complexed Src homology 2 domain studied by 15N NMR relaxation. Biochemistry 33:5984–6003 [DOI] [PubMed] [Google Scholar]
- 15. Delaglio F, Grzesiek S, Vuister GW, Zhu G, Pfeifer J, Bax A. 1995. NMRPipe: a multidimensional spectral processing system based on UNIX pipes. J. Biomol. NMR 6:277–293 [DOI] [PubMed] [Google Scholar]
- 16. Johnson BA. 2004. Using NMRView to visualize and analyze the NMR spectra of macromolecules. Methods Mol. Biol. 278:313–352 [DOI] [PubMed] [Google Scholar]
- 17. Grzesiek S, Stahl SJ, Wingfield PT, Bax A. 1996. The CD4 determinant for downregulation by HIV-1 Nef directly binds to Nef. Mapping of the Nef binding surface by NMR. Biochemistry 35:10256–10261 [DOI] [PubMed] [Google Scholar]
- 18. Aisenbrey C, Bertani P, Bechinger B. 2010. Solid-state NMR investigations of membrane-associated antimicrobial peptides. Methods Mol. Biol. 618:209–233 [DOI] [PubMed] [Google Scholar]
- 19. Salnikov ES, Aisenbrey C, Balandin SV, Zhmak MN, Ovchinnikova TV, Bechinger B. 2011. Structure and alignment of the membrane-associated antimicrobial peptide arenicin by oriented solid-state NMR spectroscopy. Biochemistry 50:3784–3795 [DOI] [PubMed] [Google Scholar]
- 20. Aisenbrey C, Bechinger B. 2004. Tilt and rotational pitch angle of membrane-inserted polypeptides from combined 15N and 2H solid-state NMR spectroscopy. Biochemistry 43:10502–10512 [DOI] [PubMed] [Google Scholar]
- 21. Bechinger B, Salnikov ES. 2012. The membrane interactions of antimicrobial peptides revealed by solid-state NMR spectroscopy. Chem. Phys. Lipids 165:282–301 [DOI] [PubMed] [Google Scholar]
- 22. Marquette A, Lorber B, Bechinger B. 2010. Reversible liposome association induced by LAH4: a peptide with potent antimicrobial and nucleic acid transfection activities. Biophys. J. 98:2544–2553 [DOI] [PMC free article] [PubMed] [Google Scholar]
- 23. Dathe M, Nikolenko H, Meyer J, Beyermann M, Bienert M. 2001. Optimization of the antimicrobial activity of magainin peptides by modification of charge. FEBS Lett. 501:146–150 [DOI] [PubMed] [Google Scholar]
- 24. Beschiaschvili G, Seelig J. 1990. Melittin binding to mixed phosphatidylglycerol/phosphatidylcholine membranes. Biochemistry 29:52–58 [DOI] [PubMed] [Google Scholar]
- 25. Gazit E, Boman A, Boman HG, Shai Y. 1995. Interaction of the mammalian antibacterial peptide cecropin P1 with phospholipid vesicles. Biochemistry 34:11479–11488 [DOI] [PubMed] [Google Scholar]
- 26. Eftink MR, Ghiron CA. 1976. Exposure of tryptophanyl residues in proteins. Quantitative determination by fluorescence quenching studies. Biochemistry 15:672–680 [DOI] [PubMed] [Google Scholar]
- 27. Raja SM, Rawat SS, Chattopadhyay A, Lala AK. 1999. Localization and environment of tryptophans in soluble and membrane-bound states of a pore-forming toxin from Staphylococcus aureus. Biophys. J. 76:1469–1479 [DOI] [PMC free article] [PubMed] [Google Scholar]
- 28. Tortech L, Jaxel C, Vincent M, Gallay J, de Foresta B. 2001. The polar headgroup of the detergent governs the accessibility to water of tryptophan octyl ester in host micelles. Biochim. Biophys. Acta 1514:76–86 [DOI] [PubMed] [Google Scholar]
- 29. Aisenbrey C, Prongidi-Fix L, Chenal A, Gillet D, Bechinger B. 2009. Side chain resonances in static oriented proton-decoupled 15N solid-state NMR spectra of membrane proteins. J. Am. Chem. Soc. 131:6340–6341 [DOI] [PubMed] [Google Scholar]
- 30. Sizun C, Bechinger B. 2002. Bilayer sample for fast or slow magic angle oriented sample spinning solid-state NMR spectroscopy. J. Am. Chem. Soc. 124:1146–1147 [DOI] [PubMed] [Google Scholar]
- 31. Qin L, Sharpe MA, Garavito RM, Ferguson-Miller S. 2007. Conserved lipid-binding sites in membrane proteins: a focus on cytochrome c oxidase. Curr. Opin. Struct. Biol. 17:444–450 [DOI] [PMC free article] [PubMed] [Google Scholar]
- 32. Esbjörner EK, Caesar CE, Albinsson B, Lincoln P, Norden B. 2007. Tryptophan orientation in model lipid membranes. Biochem. Biophys. Res. Commun. 361:645–650 [DOI] [PubMed] [Google Scholar]
- 33. Gaede HC, Yau WM, Gawrisch K. 2005. Electrostatic contributions to indole-lipid interactions. J. Phys Chem. B 109:13014–13023 [DOI] [PubMed] [Google Scholar]
- 34. Wimley WC, White SH. 1996. Experimentally determined hydrophobicity scale for proteins at membrane interfaces. Nat. Struct. Biol. 3:842–848 [DOI] [PubMed] [Google Scholar]
- 35. Yau WM, Wimley WC, Gawrisch K, White SH. 1998. The preference of tryptophan for membrane interfaces. Biochemistry 37:14713–14718 [DOI] [PubMed] [Google Scholar]
- 36. Ramachandran R, Heuck AP, Tweten RK, Johnson AE. 2002. Structural insights into the membrane-anchoring mechanism of a cholesterol-dependent cytolysin. Nat. Struct. Biol. 9:823–827 [DOI] [PubMed] [Google Scholar]
- 37. Hong Q, Gutierrez-Aguirre I, Barlic A, Malovrh P, Kristan K, Podlesek Z, Macek P, Turk D, Gonzalez-Manas JM, Lakey JH, Anderluh G. 2002. Two-step membrane binding by Equinatoxin II, a pore-forming toxin from the sea anemone, involves an exposed aromatic cluster and a flexible helix. J. Biol. Chem. 277:41916–41924 [DOI] [PubMed] [Google Scholar]
- 38. Gutierrez-Aguirre I, Trontelj P, Macek P, Lakey JH, Anderluh G. 2006. Membrane binding of zebrafish actinoporin-like protein: AF domains, a novel superfamily of cell membrane binding domains. Biochem. J. 398:381–392 [DOI] [PMC free article] [PubMed] [Google Scholar]
Associated Data
This section collects any data citations, data availability statements, or supplementary materials included in this article.