

Abstract
Survival rates of Escherichia coli and Staphylococcus aureus after high-pressure treatment in buffers that had large or small reaction volumes (ΔV°), and which therefore underwent large or small changes in pH under pressure, were compared. At a low buffer concentration of 0.005 M, survival was, as expected, better in MOPS (morpholinepropanesulfonic acid), HEPES, and Tris, whose ΔV° values are approximately 5.0 to 7.0 cm3 mol−1, than in phosphate or dimethyl glutarate (DMG), whose ΔV° values are about −25 cm3 mol−1. However, at a concentration of 0.1 M, survival was unexpectedly better in phosphate and DMG than in MOPS, HEPES, or Tris. This was because the baroprotective effect of phosphate and DMG increased much more rapidly with increasing concentration than it did with MOPS, HEPES, or Tris. Further comparisons of survival in solutions of salts expected to cause large electrostriction effects (Na2SO4 and CaCl2) and those causing lower electrostriction (NaCl and KCl) were made. The salts with divalent ions were protective at much lower concentrations than salts with monovalent ions. Buffers and salts both protected against transient membrane disruption in E. coli, but the molar concentrations necessary for membrane protection were much lower for phosphate and Na2SO4 than for HEPES and NaCl. Possible protective mechanisms discussed include effects of electrolytes on water compressibility and kosmotropic and specific ion effects. The results of this systematic study will be of considerable practical significance in studies of pressure inactivation of microbes under defined conditions but also raise important fundamental questions regarding the mechanisms of baroprotection by ionic solutes.
INTRODUCTION
High hydrostatic pressure (HHP) is one of the more promising nonthermal food preservation techniques because it is capable of extending the shelf life of foods with minimal effects on their sensory and nutritional properties. This technology consists of the application of pressure in the range of 100 to 1,000 MPa in order to inactivate food-borne pathogens, spoilage microorganisms, and deteriorative enzymes without affecting food quality (1). Full exploitation of HHP in the industry requires a reasonably detailed knowledge of the resistance of different microbial species of interest in food safety, their inactivation kinetics, the external factors that influence resistance to pressure killing, and the effects of high pressure on microbial stress responses (2).
Biological research on the effects of HHP on microbial inactivation is often carried out using buffered solutions to keep medium properties, such as pH, chemical composition, and energetic characteristics of the system, constant. However, it is well known that pressure affects ionization equilibria, particularly the dissociation of weak acids and bases, causing pH changes (3). Moreover, previous investigations have shown that pH strongly influences the inactivation of vegetative cells (4, 5) and affects the pressure-induced germination and mortality of bacterial spores (6, 7). Therefore, a quantitative description of pressure-induced changes in the pH buffer is required to understand cell responses under pressure.
The acid dissociation constant depends on the pressure and temperature to various degrees for different weak acids and is described by Plank's equation (3):
| (1) |
Here, Ka is the dissociation constant, P is the pressure (MPa), T is the absolute temperature (K), and R is the gas constant (8.3145 cm3 · MPa · K−1 · mol−1). ΔV° (cm3 mol−1) is the reaction volume and is equal to the difference in the partial molal volumes of the acid and the ionized products. Water molecules pack more closely around free ions, a phenomenon known as electrostriction, resulting in a net reduction in volume of the system. According to the principle of Le Chatelier and Braun, the equilibrium will shift to minimize the effect of pressure, thus favoring the ionization of weak acids in water. The pressure dependence of pH has been determined for a large number of weak acids and bases (8–16).
In general, anionic buffers, such as phosphate and dimethyl glutarate (DMG), have negative and relatively high ΔV° values, resulting in large decreases in pH under pressure. In contrast, cationic and zwitterionic buffering agents (ACES [N-(2-acetamido)-2-aminoethanesulfonic acid], HEPES, MES [morpholineethanesulfonic acid], Tris, and sulfanilate), described by Good et al. (17), have positive and relatively low ΔV° values and are considered pH pressure insensitive (9). Phosphate buffer undergoes a decrease of about 0.4 pH unit for every 100-MPa increase in pressure, and for this reason, many authors have raised concerns about its use in biological studies (18, 19). However, the effect of differences in ΔV° values on microbial inactivation in different buffers has been rarely investigated despite its obvious practical importance. There has been one detailed study of the effect of buffer composition on pressure and heat inactivation of spores of Geobacillus stearothermophilus (20), but there appear to be no studies on vegetative cells. Thus, the purpose of this work was to investigate the impact of the change in the dissociation constant under pressure on the inactivation of Staphylococcus aureus and Escherichia coli, as examples of Gram-positive and Gram-negative microorganisms, respectively, in five buffer solutions commonly used in biological research.
MATERIALS AND METHODS
Bacterial strain and growth conditions.
Escherichia coli BW25113 rrnB3 ΔlacZ4787 hsdR514 Δ(araBAD)567 Δ(rhaBAD)568 rph-1, the parental strain of the Keio collection (21), was supplied by H. Mori, Keio University, Japan. This strain was chosen because it would facilitate any future genetic studies and because its pressure resistance has been examined previously (22). Escherichia coli J1 is a commensal strain with moderately high pressure resistance (23). Staphylococcus aureus SH1000 was provided by S. Foster, University of Sheffield, United Kingdom. All strains were stored at −70°C in bead vials (Protect Technical Service Consultants Limited, Lancashire, United Kingdom). To activate the strains, one frozen bead was plated on tryptone soya agar (TSA) (CM131; Oxoid, Basingstoke, United Kingdom) supplemented with 0.3% yeast extract (TSBYE; Oxoid) and incubated for 24 h at 37°C. Broth subcultures were prepared by inoculating 25-ml bottles containing 10 ml of tryptone soy broth (TSB) (CM129; Oxoid) plus 0.3% (wt/vol) of yeast extract (TSBYE) with a single colony from the TSAYE plate and incubated in shaken culture (140 rpm; Aquatron, Infors UK, Reigate, Surrey, United Kingdom) at 37°C for approximately 6 h. Fifty microliters of this culture was used to inoculate 50 ml of fresh TSBYE contained in a 150-ml flask and incubated for 24 h at 37°C, which resulted in a stationary-phase culture containing approximately 3 × 10⁹ cells ml−1.
Treatment media.
Two anionic buffers, sodium phosphate and sodium 3,3-dimethyl glutarate (DMG), two zwitterionic buffers, HEPES and MOPS (morpholinepropanesulfonic acid), and the cationic buffer Tris were used as treatment media (Sigma-Aldrich Ltd., Dorset, United Kingdom). Buffered solutions were adjusted at pH 7.0 ± 0.2 with NaOH, except Tris, which was adjusted with HCl. The baroprotective effect of each medium was tested at concentrations ranging from 0.005 to 3.0 M depending on the saturation point of each buffer at room temperature. To study the baroprotective mechanism, different salt solutions at concentrations between 0.005 to 5.0 M and adjusted at pH 7.0 ± 0.2 were used: sodium sulfate (Na2SO4), sodium chloride (NaCl), potassium chloride (KCl), and calcium chloride (CaCl2). Buffers were sterilized by filtration and stored at 4°C.
Pressure treatments.
Cells were centrifuged at 3,000 × g for 20 min at 4°C (Biofuge 28 RS15; Heraeus Sepatech, Osterode, Germany) and resuspended in an equal volume of buffer. Microbial suspensions were diluted in each buffer to reach viable counts of about 108 CFU ml−1 and dispensed in volumes of 1 ml in sterile high-density polyethylene plastic sachets (2 cm by 5 cm and 65-μm film thickness) (Seward Ltd., Worthing, West Sussex, United Kingdom) that were heat sealed and kept on ice before pressurization. Samples were treated in a 300-ml pressure vessel (Foodlab Plunger Press model S-FL-850-9 W; Stansted Fluid Power, Stansted, Essex, United Kingdom). The pressure-transmitting fluid was monopropylene glycol in water (30:70). The maximum temperature reached during pressurization was 30°C. The come-up rate was 330 MPa min−1. During decompression, pressure decreases to 30 MPa in about 15 s and the total decompression is about 35 s. In order to make meaningful comparisons between buffers, it was necessary to choose a pressure challenge that gave a degree of inactivation in all buffers that was sufficient to show clear differences in survival while ensuring that complete inactivation did not occur. Therefore, cells of E. coli BW2113 were exposed to a pressure of 400 MPa for 8 min whereas S. aureus SH1000 and E. coli J1 were pressure treated at 500 MPa for 8 min. To further study the inactivation kinetics of E. coli BW25113, a pressure of 350 MPa was applied for different time intervals. This pressure was chosen to allow the large differences in survival under the different conditions to be compared at the same pressure. After pressure treatments, the pouches were removed from the unit and placed on ice before viable counts were determined or other tests were performed.
Viable counts.
Samples were diluted in maximum-recovery diluent (MRD) (CM733; Oxoid) and plated on TSAYE containing 0.1% (wt/vol) filter-sterilized sodium pyruvate (Sigma-Aldrich Ltd.) added to the molten agar. Colonies were counted after the plates had been incubated at 37°C for 24 h. Data presented are mean values from three independent experiments, and the error bars on the figures indicate the standard deviations for the data points. The lower limit of accurate measurements was 25 CFU ml−1.
Assessment of cell membrane damage.
The fluorescent dye propidium iodide (PI; Sigma-Aldrich) was used to evaluate cell membrane damage in E. coli BW25113. A stock solution of 1 mg PI in 1 ml water (ISO grade 2) was prepared. Samples of cell suspensions were prepared in each buffer with an optical density at 680 nm (OD680) of 0.2 (spectrophotometer model CE 2020; Cecil Instruments) and mixed with PI solution to a final concentration of 2.9 μM before or after pressure treatment at 400 MPa for 8 min. For evaluation of PI uptake after pressure treatment, cells were incubated with PI for 10 min in the dark and then centrifuged (10,000 × g) at 4°C and washed twice in phosphate-buffered saline (PBS). When PI was present during pressure treatment, the cells were centrifuged and washed immediately after decompression. Fluorescence was measured at an excitation wavelength of 495 nm and an emission wavelength of 615 nm in a fluorimeter (model LS-5B; PerkinElmer, MA). The data were normalized by subtracting fluorescence values obtained from untreated cells and dividing by the OD680. If cellular PI uptake was detected when PI was present during pressure treatment but not when it was added immediately after decompression, this was taken to mean that membrane disruption had occurred during the pressure treatment but that membranes had resealed after decompression (24).
Curve fitting and statistical analysis.
Survival curves were obtained by plotting the logarithm of the fraction of survivors versus the treatment time. Inactivation curves were fitted by a special case of the model of Baranyi and Roberts (25), considering an inactivation curve to be a mirror image of a growth curve (26). This model describes the survival curves through three parameters: the time before the exponential inactivation begins (tlag; lag phase), the inactivation rate (μ), and the remaining population in the tail phase (Yf Y0−1), calculated by determining the log10 of the initial (Y0) and final (Yf) counts. The Office Excel 2007 program (Microsoft Co., Redmond, WA) with the special package DMFit (http://www.ifr.ac.uk/safety/DMFit; IFR, Norwich, United Kingdom) was used to fit the data. Statistical analyses (t test [P = 0.05] and analysis of variance [ANOVA] [P = 0.05]) were carried out using the GraphPad Prism 5.0 software (GraphPad Software, Inc., CA), and differences were considered significant for P values of ≤0.05.
RESULTS
Inactivation of E. coli and S. aureus in different buffer solutions.
Figure 1 shows inactivation of E. coli BW25113 in the five buffers at concentrations of 0.005 M and 0.1 M after a pressure treatment of 400 MPa for 8 min. As expected, the inactivation of E. coli in phosphate and DMG buffers at 0.005 M (4.4 ± 0.23 and 4.7 ± 0.28 log reductions, respectively), which suffer a large pH drop during pressure treatment, was significantly higher (P ≤ 0.05) than that in HEPES, MOPS, or Tris (3.0 ± 0.49, 3.3 ± 0.20, and 3.7 ± 0.38 log cycles, respectively). However, at the higher concentration of 0.1 M, we observed the contrary effect: phosphate and DMG buffers (0.33 ± 0.09 and 1.3 ± 0.09 log reductions, respectively) were more baroprotective than HEPES, MOPS, and Tris (5.2 ± 0.77, 3.9 ± 0.49, and 3.1 ± 0.47 log reductions, respectively). In other words, the inactivated populations in phosphate and DMG buffers were greater at 0.005 M than that at 0.1 M, whereas in the cationic/zwitterionic buffers, concentration did not significantly affect the degree of inactivation (P > 0.05).
Fig 1.
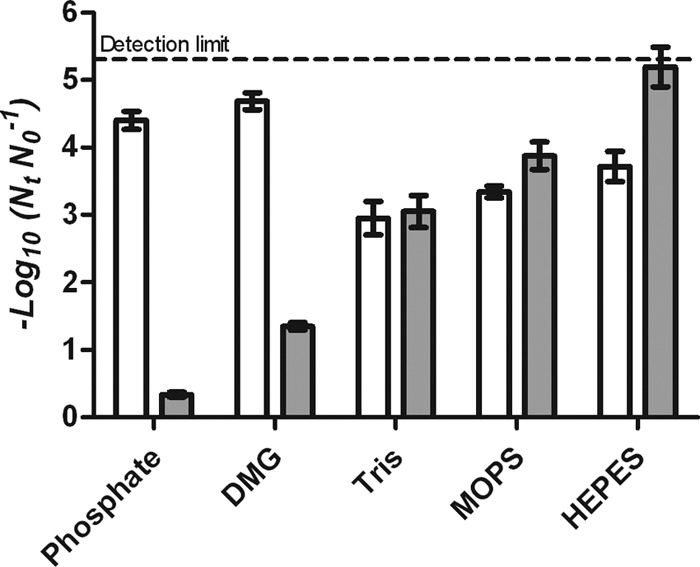
Inactivation of E. coli BW25113 treated at 400 MPa for 8 min in phosphate, DMG, HEPES, MOPS, and Tris at concentrations of 0.005 M (white) and 0.1 M (gray).
Similar behavior was observed for S. aureus SH1000 treated at 500 MPa for 8 min in the five buffers (Fig. 2). At a concentration of 0.005 M, inactivation of S. aureus was greater in phosphate and DMG buffers than in cationic/zwitterionic buffers, and at 0.1 M, phosphate and DMG buffers again showed a baroprotective effect. Thus, log reductions of S. aureus in phosphate and DMG buffers decreased from 3.8 ± 0.18 and 4.2 ± 0.42 at 0.005 M to 0.43 ± 0.11 and 0.48 ± 0.25 at 0.1 M, respectively, while the surviving fractions in HEPES, MOPS, and Tris remained constant. There were no significant statistical differences (P > 0.05) in survival of S. aureus in the different buffers at a 0.1 M concentration. This is in contrast to results obtained with E. coli and may be explained by the greater pressure resistance of S. aureus (Fig. 2).
Fig 2.
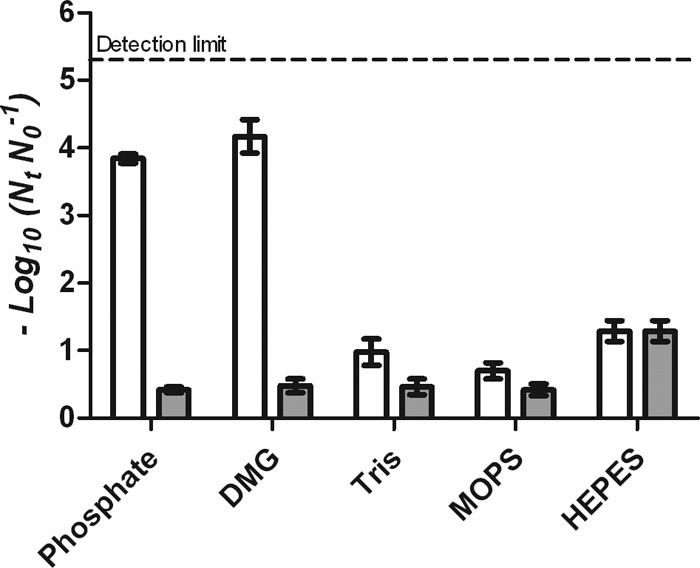
Inactivation of S. aureus SH1000 treated at 500 MPa for 8 min in phosphate, DMG, HEPES, MOPS, and Tris buffer at concentrations of 0.005 M (white) and 0.1 M (gray).
The differences in microbial inactivation between anionic and cationic/zwitterionic buffers at 0.005 M were much greater in S. aureus SH1000 than in E. coli BW25113, possibly because the more pressure-resistant S. aureus was, of necessity, treated at the higher pressure of 500 MPa, where the pressure-induced pH changes would have been greater than those at 400 MPa, used with E. coli BW25113. To confirm this hypothesis, E. coli J1, described as a relatively pressure-resistant strain of E. coli (23), was subjected to the same treatment as S. aureus (500 MPa for 8 min) in all buffers at 0.005 M (Fig. 3). As predicted, much larger differences between anionic and cationic/zwitterionic buffers were seen following treatment of E. coli J1 at the higher pressure. Differences between inactivation in either of the anionic buffers and in HEPES, MOPS, and Tris were statistically significant (P < 0.05).
Fig 3.
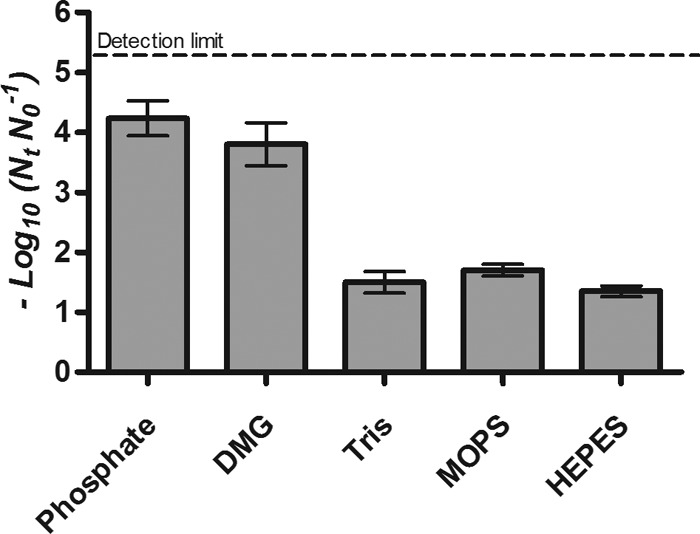
Inactivation of E. coli J1 treated at 500 MPa for 8 min in phosphate, DMG, HEPES, MOPS, and Tris buffer at 0.005 M.
Effect of the buffer concentration on microbial inactivation.
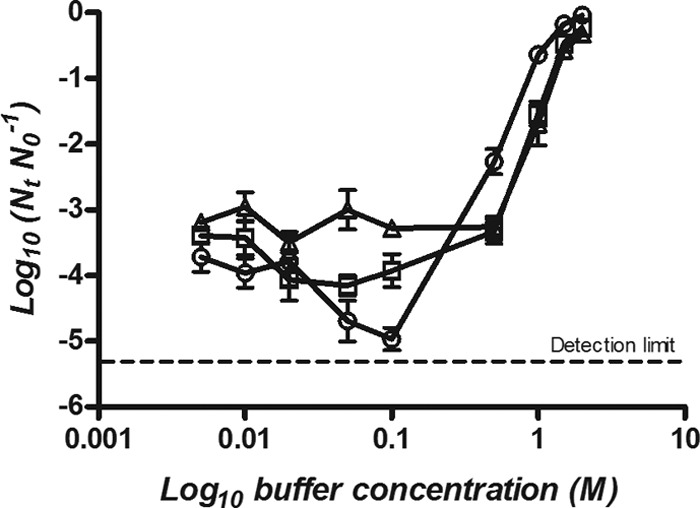
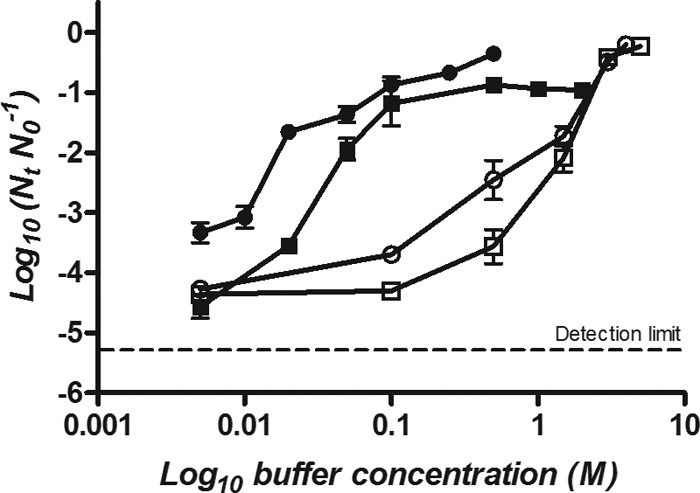
To determine the influence of the buffer concentration on the lethality of HHP, E. coli BW25113 was treated at 400 MPa for 8 min in each buffer at a range of concentrations from 0.005 M to 3.0 M depending on the solubility saturation point of the buffer (Fig. 4 and 5). At high concentrations, all buffers showed a baroprotective effect, but the concentration at which they exerted this effect was different for anionic and cationic/zwitterionic buffers. The maximum baroprotective effect in phosphate and DMG buffers was reached at 0.1 M. The extent of protection in phosphate buffer was somewhat greater than that in DMG (Fig. 4). At 0.1 M, viable numbers of E. coli were reduced by 0.5 log in phosphate, compared with 1.5 logs in DMG. Conversely, in HEPES, MOPS, and Tris, maximum protection was achieved at concentrations of 1.5 to 2.0 M when populations were reduced by less than 0.5 log (Fig. 5).
Fig 4.
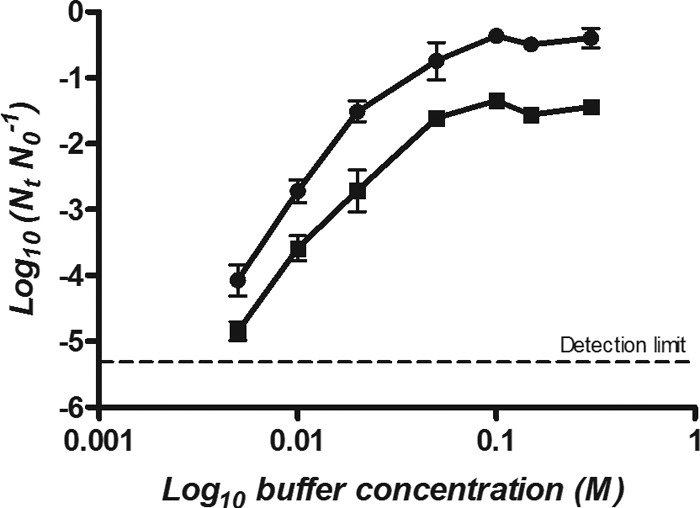
Surviving fractions of E. coli BW25113 treated at 400 MPa for 8 min in phosphate (●) and DMG (■) buffers at concentrations between 0.005 M and 0.1 M.
Fig 5.
Surviving fractions of E. coli BW25113 treated at 400 MPa for 8 min in HEPES (○), MOPS (□), and Tris (△) at concentrations between 0.005 M and 2 M.
Effect of concentrations of other salt solutions on microbial inactivation.
To investigate the basis of the baroprotective effect of phosphate and DMG buffers, E. coli BW25113 was treated in different salt solutions (Na2SO4, CaCl2, NaCl, and KCl) at different concentrations between 0.005 M and 5 M (Fig. 6). Na2SO4 and CaCl2 solutions showed a maximum pressure protection at a concentration of 0.1 M, similar to the phosphate buffer. In contrast, NaCl and KCl showed baroprotective behavior similar to that of cationic/zwitterionic buffers, so that their maximum protective effects were reached at concentrations of 4.0 to 5.0 M.
Fig 6.
Surviving fractions of E. coli BW25113 treated at 400 MPa for 8 min in Na2SO4 (●),CaCl2 (■), NaCl (□), and KCl (○) solutions at concentrations between 0.005 M and 5 M.
Effect of buffer concentrations on the kinetics of inactivation.
To determine how the baroprotective effect influences the kinetics of inactivation, E. coli BW25113 was treated at 350 MPa in two concentrations of phosphate (0.005 M and 0.1 M) and HEPES (0.1 M and 2 M) buffers, representing maximum and minimum levels of protection of each buffer (Fig. 7). Survival curves were fitted by Baranyi's model, which is used to compare sigmoid high-hydrostatic-pressure kinetics (25, 26) because it provides accurate and independent descriptions of the shoulder lengths (tlag), the inactivation rates of the exponential phase (μ), and the remaining tails (Yf Y0−1). Table 1 shows the averages of the model parameters with their standard deviations from the fitted curves as well as the coefficients of determination (R2). Inactivation curves at high concentrations of phosphate and HEPES buffers showed a shoulder phase, whereas this was not present at the corresponding low concentrations. Furthermore, the inactivation rates in dilute phosphate and HEPES were 91% and 89% higher than those in more-concentrated buffers, respectively, and tail phenomena were less marked or not evident.
Fig 7.
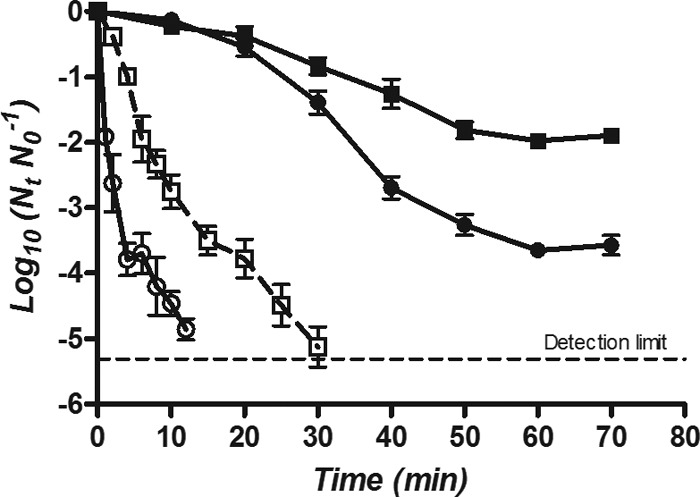
Survival curves of E. coli BW25113 treated at 350 MPa in phosphate at 0.005 M (○) and 0.1 M (●) and HEPES buffer at 0.1 M (□) and 2 M (■).
Table 1.
Parameters of inactivation curves for E. coli cells pressure treated in buffers at protective and nonprotective concentrations
| Buffer | Concn (M) | Mean (SD) value for each parameter |
R2 | Model | ||
|---|---|---|---|---|---|---|
| μ (min−1) | tlag (min) | Yf/Y0 (log10 CFU) | ||||
| Phosphate | 0.005 | 1.27 (0.56) | 0.00 | −4.69 (0.22) | 0.954 | No lag model |
| 0.1 | 0.11 (0.03) | 15.2 (3.96) | −3.95 (0.30) | 0.988 | Complete model | |
| HEPES | 0.1 | 0.44 (0.16) | 0.00 | −5.14 (0.49) | 0.961 | No lag model |
| 2 | 0.05 (0.01) | 25.3 (3.58) | −2.06 (0.20) | 0.979 | Complete model | |
Uptake of PI by cells.
Figure 8 shows the uptake of PI by cells of E. coli BW25113 during and after pressure treatment in different concentrations of phosphate and HEPES buffers or salt solutions. Differences between PI uptake during and after HHP treatments were significant in all buffers except 2 M HEPES, 0.5 M Na2SO4, and 5.0 M NaCl. At the lower concentrations of phosphate or HEPES (0.005 and 0.1 M, respectively), there was extensive uptake of PI during pressure treatment but only slight uptake after. This indicates that transient membrane disruption occurred under pressure with a degree of resealing afterwards. At the higher concentrations of phosphate and HEPES (0.1 and 2.0 M, respectively), there was very little PI uptake either during or after pressure treatment.
Fig 8.
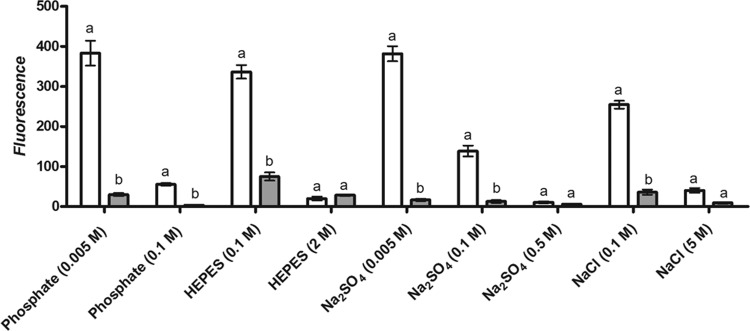
PI uptake of E. coli BW25113 during (white) and after (gray) treatment of 400 MPa for 8 min in phosphate buffer at 0.005 and 0.1 M, Na2SO4 solution at 0.005 to 0.5 M, HEPES buffer at 0.1 and 2 M, and NaCl at 0.1 and 5 M. Letters a and b indicate statistically significant differences (P < 0.05) between the PI uptakes during and after treatment in the same buffer.
This concentration-dependent pattern of PI uptake was also apparent with Na2SO4 and NaCl. With Na2SO4, PI uptake was highest at 0.005 M but decreased at 0.1 M and was close to zero at 0.5 M. Similarly, uptake of PI by cells suspended in NaCl was high at 0.1 M but much less at 5.0 M. Uptake of PI after pressure treatment was very low at all salt concentrations, indicating that membrane resealing had occurred in all cases. These results demonstrate that buffers and salts both protect against transient membrane disruption, but the molar concentrations necessary for membrane protection are much lower for phosphate and Na2SO4 than for HEPES and NaCl.
DISCUSSION
In this investigation, we studied microbial inactivation by HHP in several buffers commonly used in biological research that differed in their propensity to change pH under pressure: these were two anionic buffers, phosphate and DMG, and three cationic/zwitterionic ones, HEPES, MOPS, and Tris. Reported values for ΔV° obtained by theoretical models and by direct measurement of pH for the five buffers examined are in Table 2. Although there are some discrepancies between values for the same buffer, it can be concluded that phosphate and DMG buffers are pressure sensitive because they have large negative reaction volumes; therefore, the protonic ionization under pressure leads to a large pKa increase and pH decrease. Conversely, zwitterionic or cationic buffering agents (HEPES, MOPS, and Tris) are relatively pressure insensitive, as they have small positive reaction volumes. Based on ΔV° data, we expected that microbial inactivation in the pressure-sensitive buffers would be greater than that in the pressure-insensitive ones.
Table 2.
Values of ΔV° for buffers reported in the literature
When tested at the low concentration of 0.005 M, inactivation of E. coli and S. aureus in phosphate and DMG buffers was indeed greater than that in the cationic/zwitterionic buffers. This agrees with the findings of Mathys et al. (20), who studied the inactivation of Geobacillus stearothermophilus spores by HHP (500, 600, and 900 MPa) in ACES and phosphate buffer (0.001 M) at different initial pH values: they found that inactivation in phosphate buffer was greater than that in the zwitterionic buffer. In the present work, the difference between microbial survival in anionic and cationic/zwitterionic buffers at 0.005 M was greater in S. aureus than in E. coli. Using the more-baroresistant strain E. coli J1, we demonstrated that the greater differences were due primarily to a higher pressure being applied rather than to differences in cell envelope composition between Gram-positive and -negative bacteria. According to Plank's equation, the degree of dissociation of ionic buffers which have large reaction volumes would increase markedly with pressure. For the anionic buffers phosphate and DMG, with negative reaction volumes, the resulting decrease in pH would be expected to increase the lethality of exposure to high pressure. In contrast, increasing pressure would cause negligible pH changes in the cationic/zwitterionic buffers, which have small positive reaction volumes. This is consistent with our results showing that at a concentration of 0.005 M, microbial inactivation by pressure was greater in anionic pressure-sensitive buffers than in cationic/zwitterionic ones and that the difference between buffers increased with increasing pressure.
Unexpectedly, at the higher concentration of 0.1 M, phosphate and DMG buffers showed a baroprotective effect with E. coli BW25113 and S. aureus while microbial inactivation in cationic/zwitterionic buffers remained constant. At this concentration, survival in phosphate and DMG buffers was better than that in the cationic buffers—the opposite of what is predicted by theory. A baroprotective effect was also seen with cationic/zwitterionic buffers, but only at much higher concentrations, reaching a maximum at 2.0 M.
Considering all solutes tested, two groups may be recognized with respect to their protective properties: those that protect at relatively low concentrations (phosphate, DMG, Na2SO4, and CaCl2) and those that are protective only at high concentrations (Tris, HEPES, MOPS, NaCl, and KCl). Can this difference be explained on the basis of general physical or chemical properties? Analysis of inactivation data showed that there was no correlation between log reductions under pressure and water activity or ionic strength (measured at atmospheric pressure) or the log-transformed values of these properties (data not shown).
Koseki and Yamamoto (27) studied the baroprotective effect of different concentrations of sucrose, NaCl, and phosphate buffer on HHP inactivation of Listeria monocytogenes, observing that high phosphate buffer concentrations (1.0 M) completely inhibited HHP-induced inactivation (600 MPa for 10 min). As an alternative to water activity, they proposed using the percentage of saturation of solutes in suspending medium to explain the baroprotective effect. They showed that as the percentage of saturation increased, the HHP lethality decreased to the point that in oversaturated solutions, microbial inactivation was completely inhibited. According to this idea, the effective solute concentration preventing HHP-induced inactivation will differ depending on the solubility of the solute.
Regarding our results, the percentages of saturation for the different solutes at their effective protective concentrations are shown in Table 3. Of the group of buffers and salts that were protective only at high concentrations (Tris, HEPES, MOPS, KCl, and NaCl), most were reasonably close to their saturation points at room temperature. Given the imprecision of defining the precise concentration giving maximum protection, these results give some support to the idea of Koseki and Yamamoto (27). The mechanism of protection suggested by Koseki and Yamamoto (27) is that in a saturated solution, solute molecules exist in excess and pressure transmission to the water is inhibited. However, it is difficult to see how mechanical transmission of pressure would be affected by the presence of solutes. An alternative explanation is that concentrated solutions of salts are less compressible than pure water (28, 29) and that a reduction in the bulk compressibility of water might reduce the deformation of cell structures under pressure. In this regard, Moussa et al. (30) proposed that concentrated solutions or dehydration reduce cell damage by minimizing volume changes under pressure.
Table 3.
Concentrations of solutions having a protective effect in relation to the concentration of a saturated solution
| Substance | Concn needed for maximum protection (M) | Saturating concn (M)a | % of saturation at concn giving maximum protection |
|---|---|---|---|
| Tris | 2.0 | 4.13 | 48 |
| HEPES | 2.0 | 2.25 | 89 |
| MOPS | 2.0 | 4.7 | 43 |
| KCl | 4.0 | 4.61 | 87 |
| NaCl | 4.0 | 6.13 | 65 |
| Na2HPO4 | 0.061b | 0.36 | 27 |
| DMG | 0.1 | 0.27 | 37 |
| Na2SO4 | 0.1 | 1.29 | 7.8 |
| CaCl2 | 0.1 | 6.71 | 1.5 |
See the supplemental material.
Based on the concentration of the disodium salt in 0.1 M buffer at pH 7.0.
Considering the remaining solutes (phosphate, DMG, Na2SO4, and CaCl2), it is clear that these are protective at concentrations well below their saturation points, and for this group, an alternative explanation must be sought. One common feature of these solutes is that the reaction volumes for ionization or separation of ion pairs are all large. In aqueous solution, each molecule of CaCl2 dissociates into a divalent cation, Ca2+, and two monovalent Cl− anions while Na2SO4 dissociates into a divalent SO4 2− anion and two Na+ cations. Likewise, NaH2PO4 dissociates into Na+, H+, and divalent PO42−. Conversely, NaCl and KCl dissociate into monovalent ions only; therefore, in one mole of these salts, the number of ions in solution is lower. Protection therefore seems to be correlated with the degree of electrostriction of water. However, the mechanism of this effect is not obvious, and it is difficult to envisage any significant effect on bulk properties of water relevant to pressure inactivation at the low solute concentrations (0.1 M) needed for protection.
An important finding of this work was that membrane disruption was decreased by all solutes at their protective concentrations. The concentrations required for protection were broadly in line with those preventing loss of viability. For those solutes that protected at low concentrations, specific ion effects rather than changes in bulk solution properties may be responsible. A common feature of phosphate and sulfate anions is that they are both considered to be kosmotropic in the Hofmeister series; that is, they tend to stabilize proteins, lipid bilayers, and biological membranes (31). This property was originally attributed to the ability of kosmotropes to stabilize bulk water, distinct from chaotropes that destabilize water structure, but more-recent research suggests that the effects may be mediated through direct ion-macromolecule interactions (31). The membrane-stabilizing properties of kosmotropic substances might explain why phosphate and sulfate anions prevented membrane disruption in whole cells of E. coli at relatively low concentrations. Kosmotropic anions and other soluble compounds, such as disaccharides, increase the temperature of the transition from the Lβ lamellar gel to Lα liquid crystalline phases of model phospholipid bilayers; i.e., they decrease membrane fluidity (32, 33). Molina-Hoppner et al. (34) attributed part of the protective effect of 0.5 M sucrose and 4 M NaCl on Lactococcus lactis to a stabilizing effect on the cytoplasmic membrane. However, in this case, sucrose and sodium chloride decreased the phase transition temperature of the membrane of whole cells rather than increasing it, as observed in model lipid bilayer systems. A similar effect of sucrose in depressing the phase transition temperature was reported by Hoekstra et al. (35) for pollen cell membranes. The reason for the differences in the effect of solutes on the phase transitions of model systems versus biological membranes is not clear. The complexity of solute/phospholipid interactions is illustrated by proline, which decreased the phase transition temperature of unilamellar phospholipid vesicles but increased it in multilamellar vesicles (36).
Calcium chloride, which is not a kosmotropic substance, nevertheless had a powerful protective effect with E. coli, confirming the findings of Hauben et al. (37), who found that 0.5 mM concentrations of the divalent cations Ca2+, Mg2+, Mn2+, and Fe2+ in the form of their chloride salts reduced microbial inactivation whereas chloride anions (NaCl and KCl) had no protective effect. The authors suggested that calcium stabilized a pressure-sensitive target within the cell. One such target may be the cell membrane, which is stabilized by divalent cations, including Ca2+ (38).
The inactivation curves in phosphate and HEPES buffers at their respective protective concentrations both showed shoulder regions and tails, while these features were much reduced or absent at nonprotective concentrations. Shoulders on curves are often interpreted as representing a stage when cell damage is reversible, while exponential inactivation takes place after sublethal damage has accumulated to the point where it is irreversible. Experiments with PI uptake as an indicator of membrane damage showed that E. coli BW 25113 cells were able to reseal disrupted membranes after decompression, even after treatment in low concentrations of buffer that were lethal to the cell. Previous work has shown that transient membrane disruption can be lethal (23, 39), although some robust strains of E. coli can withstand such transient membrane leakiness (24). Protective concentrations of buffers prevented or reduced transient membrane disruption, and this may possibly have slowed the irreversible changes that accompany membrane disruption, thus leading to the shoulders seen on survival curves.
This work is the first systematic examination of the effect of buffer properties and concentration on microbial inactivation by high-pressure treatments. The results will be of considerable practical significance to those examining microbial baroresistance under controlled conditions. The work also raises important fundamental questions regarding the mechanisms of baroprotection by ionic solutes.
Supplementary Material
ACKNOWLEDGMENTS
This study has been carried out with financial support from the Ministerio de Ciencia e Innovación, EU-FEDER (CIT020000-2009-40). E.G. gratefully acknowledges the financial support for doctoral studies from the Ministerio de Educación y Ciencia.
We thank S. Foster and H. Mori for providing strains.
Footnotes
Published ahead of print 26 April 2013
Supplemental material for this article may be found at http://dx.doi.org/10.1128/AEM.00469-13.
REFERENCES
- 1. Mañas P, Pagán R. 2005. Microbial inactivation by new technologies of food preservation. J. Appl. Microbiol. 98:1387–1399 [DOI] [PubMed] [Google Scholar]
- 2. Cebrián G, Michiels CW, Mañas P, Condón S. 2010. Biological approach to modeling of Staphylococcus aureus high-hydrostatic-pressure inactivation kinetics. Appl. Environ. Microbiol. 76:6982–6990 [DOI] [PMC free article] [PubMed] [Google Scholar]
- 3. Isaacs NS. 1981. Liquid phase high pressure chemistry. John Wiley and Sons, Chichester, United Kingdom [Google Scholar]
- 4. Alpas H, Kalchayanand N, Bozoglu F, Ray B. 2000. Interactions of high hydrostatic pressure, pressurization temperature and pH on death and injury of pressure-resistant and pressure-sensitive strains of foodborne pathogens. Int. J. Food Microbiol. 60:33–42 [DOI] [PubMed] [Google Scholar]
- 5. Koseki S, Yamamoto K. 2006. pH and solute concentration of suspension media affect the outcome of high hydrostatic pressure treatment of Listeria monocytogenes. Int. J. Food Microbiol. 111:175–179 [DOI] [PubMed] [Google Scholar]
- 6. Wuytack EY, Michiels CW. 2001. A study on the effects of high pressure and heat on Bacillus subtilis spores at low pH. Int. J. Food Microbiol. 64:333–341 [DOI] [PubMed] [Google Scholar]
- 7. Shigeta Y, Aoyama Y, Okazaki T, Hagura Y, Suzuki K. 2007. Hydrostatic pressure-induced germination and inactivation of Bacillus spores in the presence or absence of nutrients. Food Sci. Technol. Res. 13:193–199 [Google Scholar]
- 8. Neuman RC, Kauzmann W, Zipp A. 1973. Pressure-dependence of weak acid ionization in aqueous buffers. J. Phys. Chem. 77:2687–2691 [Google Scholar]
- 9. Kitamura Y, Itoh T. 1987. Reaction volume of protonic ionization for buffering agents—prediction of pressure-dependence of pH and pOH. J. Solution Chem. 16:715–725 [Google Scholar]
- 10. Hayert M, Perrier-Cornet JM, Gervais P. 1999. A simple method for measuring the pH of acid solutions under high pressure. J. Phys. Chem. A 103:1785–1789 [Google Scholar]
- 11. Orlien V, Olsen K, Skibsted LH. 2007. In situ measurements of pH changes in β-lactoglobulin solutions under high hydrostatic pressure. J. Agric. Food Chem. 55:4422–4428 [DOI] [PubMed] [Google Scholar]
- 12. Salerno M, Ajimo JJ, Dudley JA, Binzel K, Urayama P. 2007. Characterization of dual-wavelength seminaphthofluorescein and seminaphthorhodafluor dyes for pH sensing under high hydrostatic pressures. Anal. Biochem. 362:258–267 [DOI] [PubMed] [Google Scholar]
- 13. De Pedro HM, Urayama P. 2009. Using LysoSensor Yellow/Blue DND-160 to sense acidic pH under high hydrostatic pressures. Anal. Biochem. 384:359–361 [DOI] [PubMed] [Google Scholar]
- 14. Surdo AL, Bernstrom K, Jonsson CA, Millero FJ. 1979. Molar volume and adiabatic compressibility of aqueous phosphate solutions at 25°C. Phys. Chem. 83:1255–1262 [Google Scholar]
- 15. Disteche A. 1972. Effects of pressure on the dissociation of weak acids. Symp. Soc. Exp. Biol. 26:27–60 [PubMed] [Google Scholar]
- 16. Hamann SD. 1963. Chemical equilibria in condensed systems. Academic Press, London, United Kingdom [Google Scholar]
- 17. Good N, Winget D, Winter W, Connolly T, Irawa S, Singh R. 1966. Hydrogen ion buffers for biological research. Biochemistry 5:467–477 [DOI] [PubMed] [Google Scholar]
- 18. Quinlan RJ, Reinhart GD. 2005. Baroresistant buffer mixtures for biochemical analyses. Anal. Biochem. 341:69–76 [DOI] [PubMed] [Google Scholar]
- 19. Balasubramanian VM, Ting EY, Stewart CM, Robbins JA. 2004. Recommended laboratory practices for conducting high-pressure microbial inactivation experiments. Innov. Food Sci. Emerg. Technol. 5:299–306 [Google Scholar]
- 20. Mathys A, Kallmeyer R, Heinz V, Knorr D. 2008. Impact of dissociation equilibrium shift on bacterial spore inactivation by heat and pressure. Food Control 19:1165–1173 [Google Scholar]
- 21. Baba T, Ara T, Hasegawa M, Takai Y, Okumura Y, Baba M, Datsenko KA, Tomita M, Wanner BL, Mori H. 2006. Construction of Escherichia coli K-12 in-frame, single-gene knockout mutants: the Keio collection. Mol. Syst. Biol. 2:1–11 [DOI] [PMC free article] [PubMed] [Google Scholar]
- 22. Charoenwong D, Andrews S, Mackey BM. 2012. Role of rpoS in the development of cell envelope resilience and pressure resistance in stationary-phase Escherichia coli. Appl. Environ. Microbiol. 77:5220–5229 [DOI] [PMC free article] [PubMed] [Google Scholar]
- 23. Klotz B, Mañas P, Mackey BM. 2010. The relationship between membrane damage, release of protein and loss of viability in Escherichia coli exposed to high hydrostatic pressure. Int. J. Food Microbiol. 137:214–220 [DOI] [PubMed] [Google Scholar]
- 24. Pagán R, Mackey BM. 2000. The relationship between membrane damage and cell death in pressure-treated Escherichia coli cells: differences between exponential- and stationary-phase cells and variation among strains. Appl. Environ. Microbiol. 66:2829–2834 [DOI] [PMC free article] [PubMed] [Google Scholar]
- 25. Baranyi J, Roberts TA. 1994. A dynamic approach to predicting bacterial growth in food. Int. J. Food Microbiol. 23:277–294 [DOI] [PubMed] [Google Scholar]
- 26. Baranyi J, Jones A, Walker C, Kaloti A, Rabinson TP, Mackey BM. 1996. A combined model for growth and subsequent thermal inactivation of Brochothrix thermosphacta. Appl. Environ. Microbiol. 62:1029–1035 [DOI] [PMC free article] [PubMed] [Google Scholar]
- 27. Koseki S, Yamamoto K. 2007. Water activity of bacterial suspension media unable to account for the baroprotective effect of solute concentration on the inactivation of Listeria monocytogenes by high hydrostatic pressure. Int. J. Food Microbiol. 115:43–47 [DOI] [PubMed] [Google Scholar]
- 28. Eder C, Delgado A. 2007. Interferometrische Messung der Dichte wassriger Losungen unter Ultra-hochdruck. Technisches Messen 74:45–50 [Google Scholar]
- 29. Min S, Sastry SK, Balasubramaniam VM. 2010. Compressibility and density of select liquid and solid foods under pressures up to 700 MPa. J. Food Eng. 96:568–574 [Google Scholar]
- 30. Moussa M, Espinasse V, Perrier-Cornet JM, Gervais P. 2009. Pressure treatment of Saccharomyces cerevisiae in low-moisture environments. Appl. Microbiol. Biotechnol. 85:165–174 [DOI] [PubMed] [Google Scholar]
- 31. Zhang Y, Cremer PS. 2006. Interactions between macromolecules and ions: the Hofmeister series. Curr. Opin. Chem. Biol. 10:658–663 [DOI] [PubMed] [Google Scholar]
- 32. Sanderson PW, Lis LJ, Quinn PJ, Williams WP. 1991. The Hofmeister effect in relation to membrane lipid phase stability. Biochim. Biophys. Acta 1067:43–50 [DOI] [PubMed] [Google Scholar]
- 33. Koynova R, Brankov J, Tenchov B. 1997. Modulation of lipid phase behaviour by kosmotropic and chaotropic solutes. Experiment and thermodynamic theory. Eur. Biophys. J. 25:261–274 [DOI] [PubMed] [Google Scholar]
- 34. Molina-Hoppner A, Doster W, Vogel RF, Gänzle MG. 2004. Protective effect of sucrose and sodium chloride for Lactococcus lactis during sublethal and lethal high-pressure treatments. Appl. Environ. Microbiol. 70:2013–2020 [DOI] [PMC free article] [PubMed] [Google Scholar]
- 35. Hoekstra FA, Crowe JH, Crowe LM. 1991. Effect of sucrose on phase-behaviour of membranes in intact pollen of Typha latifolia L, as measured with Fourier transform infrared spectroscopy. Plant Physiol. 97:1073–1079 [DOI] [PMC free article] [PubMed] [Google Scholar]
- 36. Rudolph AS, Crowe JH, Crowe LM. 1986. Effects of three stabilizing agents—proline, betaine, and trehalose—on membrane phospholipids. Arch. Biochem. Biophys. 245:134–143 [DOI] [PubMed] [Google Scholar]
- 37. Hauben KJA, Bernaerts K, Michiels CW. 1998. Protective effect of calcium on inactivation on Escherichia coli by high hydrostatic pressure. J. Appl. Microbiol. 85:678–684 [DOI] [PubMed] [Google Scholar]
- 38. Trauble H, Eidle H. 1974. Electrostatic effects on lipid phase transitions: membrane structure and ionic environment. Proc. Natl. Acad. Sci. U. S. A. 71:214–219 [DOI] [PMC free article] [PubMed] [Google Scholar]
- 39. Mackey BM, Mañas P. 2008. Inactivation of Escherichia coli by high pressure, p 53–85 In Michiels C, Aertsen A, Bartlett D, Yayanos Y. (ed), High-pressure microbiology. ASM Press, Washington, DC [Google Scholar]
Associated Data
This section collects any data citations, data availability statements, or supplementary materials included in this article.