Circulating tumor cells (CTCs) have been reported to correlate most closely with cancer development, and can serve as an important marker for metastatic malignancy, tumor recurrence, and prediction of prognosis and therapeutic efficacy. Detecting and quantifying CTCs, however, have proven to be challenging due to their low abundance in blood. Based on magneto-optical coupled nanoprobes (made of gold nanorod and iron oxide nanoparticles) and photoacoustic (PA) imaging, we report the development of an enabling technology that can detect CTCs at single cell/mL level. Remarkably, at this low cell concentration, approximately 67% of circulating tumor cells can be captured and imaged with just one pass through the magnetic trapping zone. Compared to the conventional in vitro assays, this technology offers significantly improved sensitivity, because it is inherently compatible with large sample volumes. Compared to more advanced in vivo CTC detection methods, this technology can solve the low throughput problem of optical imaging, and streamline the photoacoustic imaging process by combining magnetic enrichment and digital readout into a single step.
Most cancer deaths are caused by metastasis, a process that cells in primary tumors spread to other organs.[1] Common routes of cancer metastasis include haematogenous and lymphatic spread, whereby primary tumor cells penetrate the walls of blood and lymphatic vessels and circulate through the bloodstream. Patients would have a much greater opportunity for long-term survival if these CTCs could be sensitively and specifically detected to guide disease management, because CTCs have been reported to correlate most sensitively with cancer behavior.[2,3] For example, detection of CTCs in the peripheral blood allows earlier analysis of metastatic malignancy, monitoring therapeutic efficacy and tumor recurrence, and prediction of prognosis.[4]
Despite the clinical significance, identifying CTCs remains a major technology challenge due to their rarity in blood. Compared to billions of red blood cells and millions of white blood cells in 1 mL of blood, there are only 1–10 CTCs per milliliter on average for an active tumor.[5] To address this problem, a number of enabling technologies have been developed in recent years, such as immuno-magnetic separation,[6] reverse transcriptase–polymerase chain reaction (RT-PCR),[7] flow cytometry,[8] high-throughput optical-imaging,[9,10] and microfluidic devices.[5] However, these in vitro methods share a common limitation. That is, the limited sample volume (typically 5–10 mL) significantly decreases diagnostic confidence,[5,6] not to mention the repeated blood draws or bone marrow aspirations.
The detection sensitivity can be significantly improved by in vivo imaging of CTCs in blood circulation, where the analysis of large blood volumes, and potentially the entire blood volume of patients, can be achieved. Indeed, the importance for noninvasive CTC detection in cancer research has been realized by many scientists, and recently optical and photoacoustic imaging have been proposed for this purpose.[11–13] For example, in vivo confocal and multiphoton fluorescence systems were developed for CTC counting in a similar fashion to the conventional in vitro flow cytometry. However, optical methods share a number of limitations: (i) they only work on superficial vessels, and (ii) the blood volume interrogated in capillary vessels (typically < 100 μm)[12,13] in a reasonable procedure time (e.g., within 10 min) is prohibitively small for highly sensitive detection of rare events.
In this regard, photoacoustic imaging using ultrasound (US) transducers to detect acoustic sources induced by optical absorption of short laser pulses is better suited,[14] because it can image peripheral vessels at depth, such as the radial and brachial arteries, providing access to a relatively large blood volume over the same procedure time. Pioneer work by Galanzha and coworkers show that human breast tumor cells can be magnetically captured with urokinase plasminogen activator-labeled magnetic nanoparticles (MNPs) and imaged with PA after a second round of labeling with folate receptor-targeted gold-plated carbon nanotubes,[11] which absorb photons in the near infrared spectrum. On the other hand, requiring multiple types of contrast agents dramatically increases procedure complexity and limits its clinical applicability. In particular, since cell surface biomarkers that are truly specific to tumor cells are hard to find, identification of two distinct tumor biomarkers for the same cell are extremely difficult. Furthermore, the flow rate reported by Galanzha and coworkers also needs to be increased by 1–2 orders of magnitude to allow large blood volumes to be examined in a reasonable procedure time (e.g., over 100 mL of blood in 10 min). Therefore, there is a great need for simple and enabling technologies capable of exploiting the molecular sensitivity of PA imaging within millimeter-scale tubes mimicking human radial artery to simultaneously trap and detect low-abundance tumor cells, a necessary first step in developing a system for metastatic disease management.
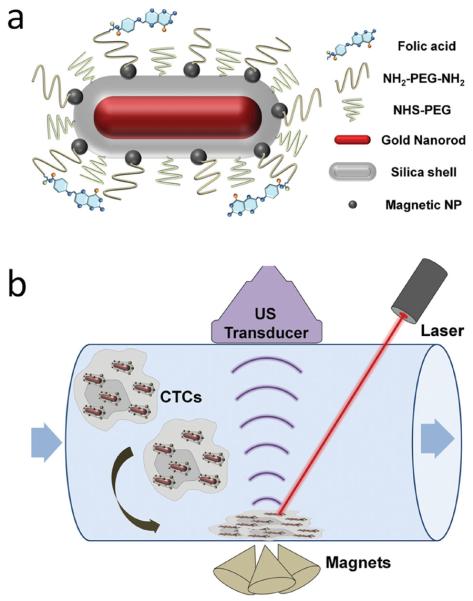
Here, we report the development of a new class of magneto-optical coupled nanoparticles for efficient trapping and sensitive photoacoustic detection of low abundance cells. As shown in Scheme 1, the multifunctional composite particle is composed of a gold nanorod (GNR) core, a thin silica shell, multiple iron oxide-based magnetic nanoparticles, and an outer layer of polyethylene glycol (PEG) with a terminal targeting ligand. GNR is selected as the contrast agent for PA because of its size tunable optical absorption. At the longitudinal surface plasmon resonance (SPR) peak, GNR offers the highest absorption efficiency per unit volume compared to other gold nanostructures (such as spherical particles and nanoshells).[15] A drawback of the current GNR synthetic procedure is that it requires the use of cationic surfactant (cetyl trimethylammonium bromide, CTAB). CTAB-coated GNRs are stable in pure water, but aggregate easily in biological buffers and media.
Scheme 1.
Schematic illustrations of the multifunctional nanoparticle and photoacoustic imaging system for CTC detection. (a) Targeted, magnetic, NIR-absorbing composite nanoparticles. GNRs with desired aspect ratio not only provide strong NIR absorbance, but also serve as a structural scaffold for silica shell growth and attachment of MNPs. PEG chains with a terminal reactive site are grafted onto the multifunctional nanoparticle, and folic acid as a model targeting ligand is linked to the particles through PEG. (b) PA imaging of circulating cells labeled with the multifunctional composite nanoparticles. An array of three cone magnets generating a high magnetic field gradient perpendicular to the flow is placed under the tube to trap the labeled cells. A pulsed laser with wavelength matching GNR's longitudinal SPR peak and a linear array transducer interfaced with an ultrasound system are used to acquire both ultrasound and photoacoustic signals.
We have recently developed procedures to replace CTAB on GNR surface with a dual layer of silica shell and PEG.[16] This new surface coating not only has solved the colloidal instability and cytotoxicity problem of CTAB-coated GNR, but also substantially improves its photothermal stability, which is critical for applications involving high-intensity laser irradiation such as photoacoustic imaging and multiphoton microscopy. Detailed work by El-Sayed and co-workers show that due to the long heat relaxation time of CTAB-coated GNRs (~150 ps), they can melt into spherical particles of similar volumes or even fragment into smaller particles under pulsed laser irradiation.[17,18] In contrast, the heat relaxation time of GNRs in silica shells has been estimated to be 20 ps,[19,20] which is competitive with GNR's photothermal reshaping process (~35 ps).[21]
To add magnetic properties to the GNR-silica particles, a layer of monodisperse Fe3O4 nanocrystals (15 nm) are linked to the silica shell via direct nucleophilic substitution reaction between bromine groups on the surface of Fe3O4 particles and amines groups of the silica shell.[22] The resulting magneto-optical composite nanoparticles are further pegylated to reduce nonspecific binding and functionalized with a targeting ligand. In the current work, folic acid (FA) is used as a model targeting ligand, which binds to human cervical cancer cell line, HeLa. To trap HeLa cells labeled with the multifunctional nanoparticles, an array of three cone magnets generating a high magnetic field gradient perpendicular to the flow is placed under the tube (Scheme 1b). A wavelength-tunable laser delivering 5 ns pulses with a repetition rate of 20 Hz is used to irradiate the trapped cells from the top. In parallel, a linear array transducer interfaced with an ultrasound system acquires both ultrasound and photoacoustic signals.
We first characterized the structural and spectral properties of the magneto-optical nanoparticles with a transmission electron microscope (TEM) and UV-vis spectrophotometer, in comparison with two control samples, silica-MNP (magnetic property only) and GNR-silica (optical property only), which are also pegylated. Figure 1a,b show uniform and dispersed GNR-silica before and after modification with MNPs. The original GNRs are 66 nm in length and 16 nm in cross-section width, and the thickness of the silica shell is approximately 11 nm. To make the control sample with magnetic properties only, 80 nm spherical silica nanoparticles are synthesized according to the well-established Stöber method (Figure 1c),[23] because without the GNR template it is very difficult to make rod-shaped silica particles. The UV-vis absorption spectra of the samples are shown in Figure 1d. GNR-silica has a weak transverse SPR band centered at 510 nm and a strong longitudinal plasmon band at 812 nm. After functionalization with MNPs, a small but appreciable red spectral shift of approximately 15 nm of the longitudinal peak is observed with a slight peak broadening (GNR-silica-MNP, 827 nm). This spectral shift is commonly observed in plas monic materials and has been previously attributed to changes of refractive index of the surrounding environment.[24] At the same time, the transverse band remains nearly unchanged in band location, but its short wavelength end is significantly enhanced. Compared with the absorption profile of silica-MNP, this elevated absorption towards the short wavelength is contributed by the MNPs, which not only can be used to confirm successful conjugation between MNP and GNR-silica, but also serves as a useful measure of the degree of MNP modification (optimal number of MNPs/GNR-silica).
Figure 1.
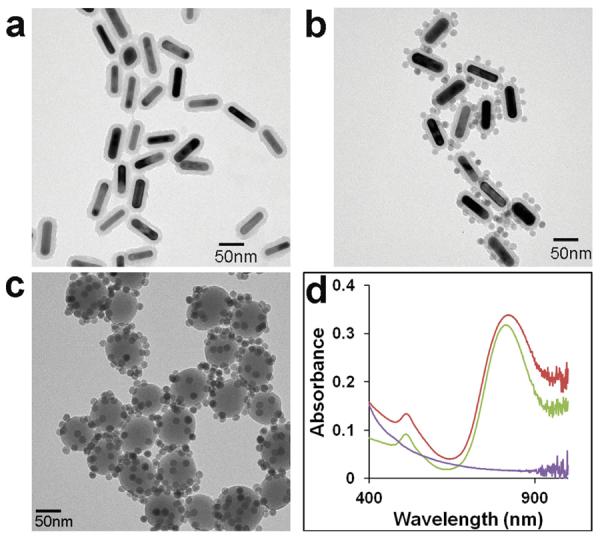
Characterization of the multifunctional composite nanoparticles. (a–c) TEM images of GNR-silica, GNR-silica-MNP, and silica-MNP particles (scale bars: 50 nm). (d) Corresponding UV-vis spectra of three samples. The silica-MNP particles exhibit a decaying absorption profile from 400–1000 nm (purple), and the silica-encapsulated GNR shows a characteristic longitudinal SPR peak at 812 nm (green). After MNP conjugation, the longitudinal SPR peak slightly red-shifts to 827 nm, and absorption at the UV range is significantly elevated due to contribution from the MNPs (red).
To achieve strong magnetic properties, more MNPs per GNR-silica are desired; on the other hand, high-density MNPs can also lead to particle aggregation because of combined magnetization. Due to difficulty in determining the absolute molar concentration of GNR-silica and MNPs, the optimal MNP loading (Figure 1b) was determined empirically in our experiments by adding MNPs to GNR-silica at various dilutions. Dynamic light scattering (DLS) measurement of the GNR-silica-MNP particles solution shows a hydrodynamic diameter of 140 nm, and increasing the MNP feeding ratio by one fold (absorption at 400 nm approximately doubles, too) resulted in an increased DLS size to 500 nm, indicating formation of clusters (Supporting Information, Figure S1). Therefore, in the following cancer cell detection experiments, we used the sample with balanced magnetic property and colloidal stability, as shown in Figure 1b. It has been shown that MNPs attached to silica nanoparticle surface do not affect their superparamagnetic properties. In fact, due to synergistic magnetism, the transverse relaxivity of MNPs on the surface of silica nanoparticles is approximately three times higher than that of free MNPs of equal iron concentration, and thus offers better contrast in T2 weighted magnetic resonance imaging.[22]
To impart targeting specificity, FA was tethered to the pegylated GNR-silica-MNP via the well-established carbodiimide reaction. These targeted particles at a concentration of 0.5 nM are incubated with HeLa cells expressing folate receptors for 60 min, which has been previously shown to be non-toxic to cells,[16] and compared with three control groups: non-targeted GNR-silica-MNP, FA-targeted GNR-silica, and FA-targeted silica-MNP. Bright field microscopy images in Figure 2 show a pronounced difference between the three targeted groups and the non-targeted GNR-silica-MNP. The `darkened' cells in Figure 2b–d are attributed to receptor-mediated cell uptake of nanoparticles and strong light extinction from the intracellular GNRs and MNPs, whereas co-incubation of the targeted multifunctional nanoparticles with free folic acid results in minimal cell uptake, demonstrating the targeting specificity (Figure 2f). To quantitatively measure the targeting specificity while mimicking the flow condition of in vivo CTC detection in human radial artery,[25] the cell suspensions at various concentrations are circulated within a tube (inner diameter 1.6 mm) at a flow rate of 6 mL/min and subjected to combined ultrasound and PA imaging.
Figure 2.
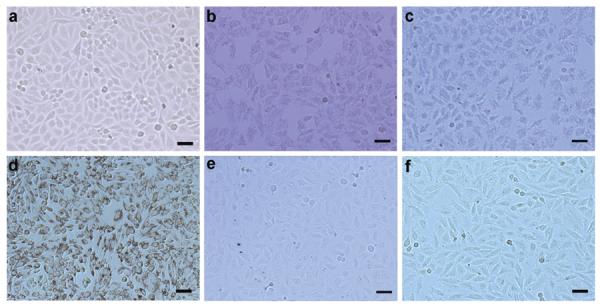
Bright-field micrographs of HeLa cells (a) without treatment, treated with (b) GNR-silica-FA, (c) silica-MNP-FA, (d) GNR-silica-MNP-FA, (e) GNR-silica-MNP, and (f) GNR-silica-MNP-FA together with 1 mM free folic acid. The dark appearance of cells in (b–d) is due to nanoparticles inside cells promoted by FA receptor targeting. Quantitative assessment of non-specific trapping of cells in panel (f) using PA imaging is shown in Supporting Information Figure S3.
Figure 3 shows the combined US/PA images of circulating HeLa cells labeled with the four types of nanoparticles (cell concentration 5000 mL−1). The streams of cell suspension move across the magnetic trapping zone from right to left. The US signals displayed in gray scale show the tube boundaries, whereas the PA signals presented in the pseudo-color heat map are correlated with the number of cells detected. For cells labeled with GNR-silica-FA (Figure 3a), no PA sources are detected due to the lack of magnetic properties to trap the tumor cells. For cells labeled with silica-MNP-FA, a faint PA signal is detected because MNPs have significantly lower absorbance in the NIR spectrum compared to GNRs and thus are not an efficient PA contrast agent (Figure 3b). Similarly, for the non-targeted GNR-silica-MNP, only low level of PA signal is seen, likely due to cells with non-specifically uptaken GNR-silica-MNP particles (Figure 3c). In contrast to the three control groups, the GNR-silica-MNP-FA particles with integrated NIR absorption, magnetic and targeting properties, result in a dramatic increase of PA signals (Figure 3d), indicating the importance and advantage of nanoprobes with coupled functionalities. It is also worth mentioning that free GNR-silica-MNP-FA probes are not trapped in the magnetic zone and thus do not produce false-positive signals (Figure 3e).
Figure 3.
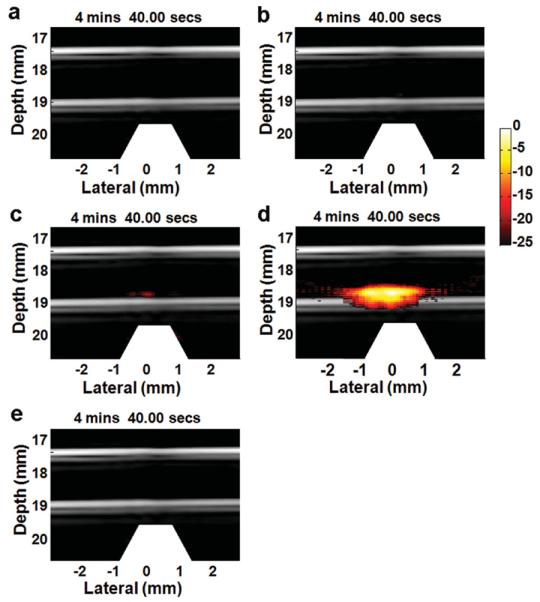
Combined US and PA images of captured HeLa cells. The cells are labeled with (a) GNR-silica-FA, (b) silica-MNP-FA, (c) GNR-silica-MNP, and (d) GNR-silica-MNP-FA, and fed into the circulation system at a concentration of 5000 cells mL−1. To ensure consistency, the images shown above are selected at the same time point (4' 40”) from continuous videos. The white trapezoid at the bottom of the figures indicates the position of the magnet array. (a) GNR-silica-FA, lacking the magnetic property can label HeLa cells but is not capable of accumulating the cells at the magnetic trapping zone for PA detection. Similarly, (b) silica-MNP-FA can help trap the cells, but has weak absorption in the NIR spectrum, and thus does not provide sufficient contrast for PA imaging. (c,d) GNR-silica-MNP composite nanoparticles offer both magnetic attraction and optical absorption. (d) When targeted by folic acid, the multifunctional particles can efficiently trap HeLa cells for PA imaging, and the total PA signal is 10.5 times stronger than the non-targeted control (c). (e) Free GNR-silica-MNP-FA probes are not trapped in the magnetic zone and thus do not produce false-positive signals.
Following the success of selective detection of CTCs at high cell density (5,000/mL), we further explored the sensitivity of our system using GNR-silica-MNP-FA labeled HeLa cells and diluted them to as low as 1 cell mL−1. To maintain a constant cell concentration during cell trapping and imaging, the cell suspension was circulated through the detection system only once. Figure 4 depicts US/PA images at representative time intervals obtained from a continuous video (Supporting Information Video S1), showing the progress of trapping circulating HeLa cells at low concentration. No PA signals are detected in the first 30 min, indicating that the small number of cells trapped in the magnetic zone is below the detection limit. A clear PA signal starts to build up after that and keeps increasing thought out the ~80 min experiment time. It is interesting to note that the location of the accumulated cells redistributes a little towards the left at late stage of the experiment (Figure 4a, bottom row, time frame of 56–80 min), likely due to the drag force of the flow. A stronger magnetic field can potentially better confine the trapped cells to produce a more concentrated signal. Figure 4b shows the corresponding cell accumulation curve, in which the sum of PA signal amplitude within the tube region (dashed rectangular in Figure 4a first frame) is calculated as a function of time. Clearly, the total PA signal gradually increases, suggesting that the designed dual magnet system can efficiently trap the low-abundance circulating cells under the fast flow rate of 6 mL min−1. To calculate the trapping efficiency, at the end of the experiment, the cells trapped in the tube were redispersed in a small volume of buffer and counted with a hemocytometer. Remarkably, our result indicates that approximately 67% of the circulating cells were captured with just one pass through the magnetic trapping zone of this very simple magnet system.
Figure 4.
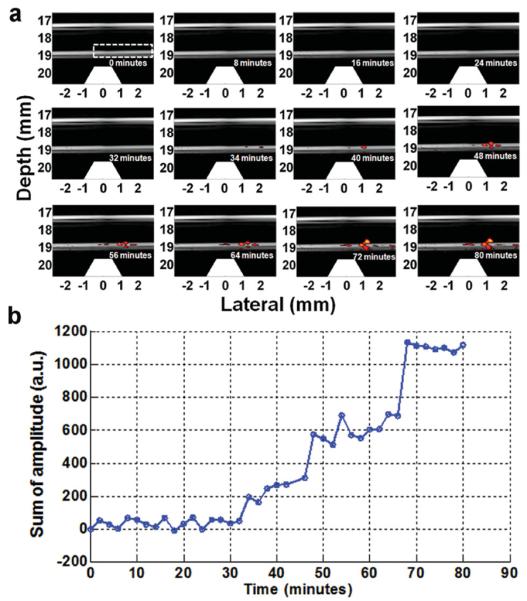
Trapping and imaging GNR-silica-MNP-FA labeled HeLa cells at 1 cell mL−1 concentration. (a) 12 representative time-lapse US/PA images of the trapped Hela cells (see Video S1 in the Supporting Information for the real-time movie). PA signal becomes clearly detectable at 34 min, and keeps increasing afterward. (b) Total PA signal within the tube region (dashed rectangle in the first frame) plotted as a function of time.
Lastly, we probed the cytotoxicity of GNR-silica-MNPFA as well as the control groups in HeLa cells. Please note that the cytotoxicity study of the composite nanoparticles merely serves as a model to illustrate the concept. Before this technology enters clinical investigations, we expect that biocompatible and biodegradable magneto-optical nanoprobes will need to be made based on similar nanoparticle design to avoid long-term nanomaterial accumulation in vivo. This can be achieved, for example, by using FDA-approved biodegradable polymer particles co-doped with iron oxide nanoparticle and NIR dyes. Nevertheless, the cytotoxicity effect of the current non-biodegradable particles is shown in Figure 5. In the concentration range probed between 0 and 1.0 nM, neither the composite nanoparticles nor the control groups show significant toxicity effect.
Figure 5.
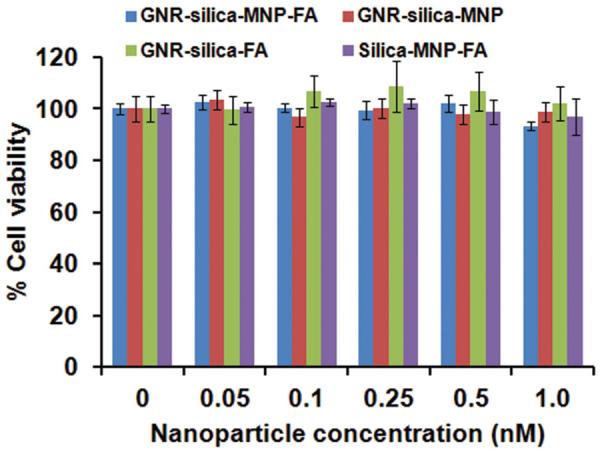
Dose-dependent cytotoxicity of GNR-silica-MNP-FA in comparison with the control groups (GNR-silica-MNP, GNR-silica-FA, and silica-MNP-FA) in HeLa cells. In the concentration range probed between 0 and 1.0 nM, the four types of nanoparticles do not show significant cytotoxicity.
In conclusion, we have developed an enabling technology for ultrasensitive detection of circulating tumor cells based on magneto-optical coupled nanoprobes and photoacoustic imaging. The multifunctional nanoparticle with integrated magnetic, optical, and targeting properties can help trap and detect rare cells at the single-cell-per-milliliter level and allows two thirds of the labeled cells to be captured in just one pass through the magnets. Compared to conventional in vitro assays, this technology offers significantly improved sensitivity, because it has the potential to interrogate large sample volumes in a reasonable procedure time. Among the more advanced in vivo CTC detection methods, this technology can overcome the low throughput problem of optical imaging,[12,13] and streamline the PA imaging process[11] by combining magnetic enrichment and PA readout into a single step. Further development of this technology using stronger magnets and magnetomotion-based background suppression[26] should improve the CTC detection sensitivity even more. Building on this model study, we also envision that development of biocompatible and biodegradable magneto-optical nanoprobes with good plasma circulation time, and validation of this technology with lab animals and patient samples can lead to clinical translation to help guide cancer management.
Experimental Section
Materials
Gold(III) chloride (HAuCl4·3H2O), AgNO3, CTAB, sodium borohydride (NaBH4), tetraethyl orthosilicate (TEOS), 1-ethyl-3-[3-dimethylaminopropyl] carbodiimide hydrochloride (EDAC), ascorbic acid, 2-bromo-2-methylpropionic acid (BMPA, 98%) and citric acid were purchased from Sigma-Aldrich (St. Louis, MO). Amine-poly(ethylene glycol)-amine (NH2-PEG-NH2, MW 3400) mPEG-Thiol (mPEG-SH, MW 5000), and methoxy poly(ethylene glycol) succinimidyl glutarate (mPEG-SG, MW 5000) were obtained from Laysan Bio (Arab, AL). All materials were used as received without further purification. Ultrapure water (18 MΩ cm−1) was obtained from a Milli-Q water purifier (Billerica, MA).
Preparation of Silica-Encapsulated Gold Nanorods (GNR-silica)
GNRs were synthesized using the seed-mediated growth method reported by Murphy, El-Sayed, and co-workers with slight modifications.[27,28] Briefly, ice cold NaBH4 (0.6 mL, 10 mM) was added to a mixture of CTAB (7.5 mL, 0.1 M) and HAuCl4 (0.1 mL, 25 mM) under vigorous stirring. The solution turned from yellow to brown indicating formation of gold nanoparticle seeds and was continuously stirred for a few minutes. The seed solution was then placed into a water bath of 27 °C. For GNR growth, CTAB (0.1 M, 50 mL) was mixed with HAuCl4 (1.0 mL, 25 mM) and AgNO3 (0.4 mL, 10 mM), followed by addition of ascorbic acid (0.3 mL, 0.1 M). The gold seed solution (60 μL) was added, and the reaction mixture was swirled and allowed to sit overnight. For silica coating, the as-prepared GNRs were purified by repeated washing and centrifugation (10 000g, 15 min, 3 times) to remove excess CTAB, and redispersed in water (50 mL). Fully reduced SH-PEG (20 mg) in water (2 mL) was added to the GNR solution (20 mL, 0.7 nM) for GNR surface ligand exchange. The resulting GNR-PEG was dispersed into ethanol (5 mL), mixed with H2O (0.8 mL), NH4OH (35 μL, 30%), and TEOS (8 μL), and stirred overnight. At the end, the GNR-silica was washed three times with ethanol. To aminate the silica shell for downstream conjugation with MNPs, the purified GNR-silica was dispersed in 10 mL of isopropanol. Following addition of 3-aminopropyltriethoxysilane (APTES,10%, 100 μL) in isopropanol, the solution was heated to boiling for 2 h.
Surface Modification of Fe3 O4 MNPs
Monodisperse Fe3 O4 nanoparticles of 15 nm capped with oleic acids were obtained from Ocean nanotech, LLC and purified three times in hexane/acetone/ethanol mixture solvents, and finally suspended in chloroform. BMPA, (0.5 g) and citric acid (0.075 g) were dissolved in a mixture of chloroform and DMF (50/50 v/v, 15 mL), added to the MNP solution (MNP 9.2 mg), and stirred overnight at 30 °C. Finally, the BMPA-modified MNPs were purified by adding acetone (to promote aggregation) followed by magnetic separation. The purification procedure was repeated four times, and the MNP-BMPA was dissolved in 5 mL of ethanol at the end.
Synthesis of Magneto-Optical Coupled Composite Nanoparticles
The amine-functionalized GNR-silica in ethanol (5 mL) was mixed with the BMPA modified MNP solution (1 mL) for 2 h under sonication in a water bath. The GNR-silica-MNP composite particles were pegylated by reacting with mPEG-SG (5 mg) dissolved in ethanol (1 mL). The reaction proceeded for 2 h to allow covalent bonding between the residual amine groups on the silica shell and the succinimidyl groups of the PEG. After removal of unreacted mPEG-SG by centrifugation, NH2-PEG-NH2 (20 mg) was added to neutralize any unreacted BMPA group on the MNP surface. The resulting pegylated GNR-silica-MNP particles were dispersed in water.
Conjugation with Folic Acid
An aliquot of folic acid in DMSO (2 mg mL−1, 100 μL) was activated with EDAC (26 mg) for 30 min and then incubated with the GNR-silica-MNP for 24 h in dark. The particles were purified by repeated centrifugation and dispersed in 1 mL of phosphate buffered saline (PBS) solution.
Cell Preparation
HeLa cells expressing folate receptor (FR) were grown to 80% confluence and incubated with the folic acid targeted multifunctional nanoparticles (0.5 nM) or the control samples of equal concentration for 1 h. After removing unbound particles, the cells were trypsinized, washed twice, fixed in 10% formalin for 30 min, counted with a hemocytometer, and stored at 4 °C.
Photoacoustic Imaging
The in-house photoacoustic setup consists of a dual-magnet system, a continuous flow circulation system, an optical illumination system, and an US acquisition system (Supporting Information, Figure S2). The magnets were designed and built to produce an external magnetic field at the tube region to efficiently trap circulating cells labeled with the coupled nanoparticles. Two disc Neodymium (NdFeB) magnets (2” ± 1/4”, Emovendo, WV) mounted in a Delrin holding system were fixed at opposite sides of the tube filled with the solution under study to produce a homogeneous field (0.04 Tesla) to magnetize the multifunctional nanoparticles; whereas a magnet array consisting of three cone magnets (1/2” ± 1/2” cones, Emovendo, WV) mounted in a Delrin holding system was used to generate a high magnetic field gradient (~44 mTesla/mm, contributing to a vertical force in the tube region at 2.5 mm distance) perpendicular to the flow direction to trap cells toward the lower wall of the tube. A PTFE (Teflon) tube (SLTT-16-72, Zeus, WA) with an inner diameter of 1.6 mm and a thickness of 38 μm mimicking a peripheral blood vessel was positioned in a water tank. Cell suspensions were circulated within the tube by a flow pumping motor (WU-77301-20, MasterFlex, IL) with a maximum rate of 6 mL min−1, which is on par with the flow rate of human radial artery.[25] A tunable OPO system (Surelite OPO plus, Continuum, Santa Clara, CA) pumped by a frequency-doubled pulsed YAG laser (Surelite I-20, Continuum, Santa Clara, CA) delivered 5 ns pulses with a repetition rate of 20 Hz. The average energy density of the laser at 810 nm wavelength was measured to be ~5.5 mJ cm−2, which is well below the ANSI limitation for laser skin exposure and made it acceptable for potential clinical applications.[29] A linear array transducer (AT8L12-5 50mm, Broadsound, Taiwan) interfaced with an ultrasound imaging system (Verasonics, WA) was used to collect US pulse-echo images and PA signals. The transducer was positioned above the tube at a distance of 18 mm. Given an aperture length of 25.6 mm (128 elements), the reconstruction corresponded to a total detection angle of approximately 71 °. A field-programmable gate array (FPGA) was used to synchronize the laser and the Verasonics system to alternatively acquire one PA image and one US image, each at a frame rate of 4 Hz.
Cell Viability Study Based on the CellTiter-Blue Assay
CellTiter-Blue cell viability assay (Promega, San Luis Obispo, CA) was used to test the cytotoxicity of the nanoparticles in living cells. After seeding Hela cells for 24 h, nanoparticles (20 μL) were added to the cell culture and incubated for 24 h followed by addition of the dye solution (20 μL) to each well and incubation for 4 h. Fluorescence at 560Ex/590Em nm was recorded using a 96-well plate reader (Tecan Infinite M200).
Supplementary Material
Acknowledgements
This work was supported in part by NIH (R01 CA131797, R01 CA170734, U19 ES019545, and T32 CA138312), NSF (0645080), the Washington Life Sciences Discovery Fund (3292512), and the Department of Bioengineering at the University of Washington. We also thank Dr. Terry Kavanagh for discussions on nanotoxicity and Dr. Andrew Wang at Oceannanotech for the highly uniform magnetic nanoparticles.
Footnotes
Supporting Information Supporting Information is available from the Wiley Online Library or from the author.
References
- [1].Weigelt B, Peterse JL, van't Veer LJ. Nat. Rev. Cancer. 2005;5:591. doi: 10.1038/nrc1670. [DOI] [PubMed] [Google Scholar]
- [2].Cristofanilli M, Budd GT, Ellis MJ, Stopeck A, Matera J, Miller MC, Reuben JM, Doyle GV, Allard WJ, Terstappen LWMM, Hayes DF. New Eng. J. Med. 2004;351:781. doi: 10.1056/NEJMoa040766. [DOI] [PubMed] [Google Scholar]
- [3].Cristofanilli M, Hayes DF, Budd GT, Ellis MJ, Stopeck A, Reuben JM, Doyle GV, Matera J, Allard WJ, Miller MC, Fritsche HA, Hortobagyi GN, Terstappen LWMM. J. Clin. Oncol. 2005;23:1420. doi: 10.1200/JCO.2005.08.140. [DOI] [PubMed] [Google Scholar]
- [4].De Giorgi V, Pinzani P, Salvianti F, Panelos J, Paglierani M, Janowska A, Grazzini M, Wechsler J, Orlando C, Santucci M, Lotti T, Pazzagli M, Massi D. J. Invest. Dermatol. 2010;130:2440. doi: 10.1038/jid.2010.141. [DOI] [PubMed] [Google Scholar]
- [5].Nagrath S, Sequist LV, Maheswaran S, Bell DW, Irimia D, Ulkus L, Smith MR, Kwak EL, Digumarthy S, Muzikansky A, Ryan P, Balis UJ, Tompkins RG, Haber DA, Toner M. Nature. 2007;450:1235. doi: 10.1038/nature06385. [DOI] [PMC free article] [PubMed] [Google Scholar]
- [6].Riethdorf S, Fritsche H, Muller V, Rau T, Schindibeck C, Rack B, Janni W, Coith C, Beck K, Janicke F, Jackson S, Gornet T, Cristofanilli M, Pantel K. Clin. Cancer Res. 2007;13:920. doi: 10.1158/1078-0432.CCR-06-1695. [DOI] [PubMed] [Google Scholar]
- [7].Zieglschmid V, Hollmann C, Böcher O. Crit. Rev. Clin. Lab. Sci. 2005;42:155. doi: 10.1080/10408360590913696. [DOI] [PubMed] [Google Scholar]
- [8].Cruz I, Ciudad J, Cruz J. J. s., Ramos M, Gómez-Alonso A, Adansa JC, Rodríguez C, Orfao A. Am. J. Clin. Pathol. 2005;123:66. doi: 10.1309/wp3qwkvjfydhhxqd. [DOI] [PubMed] [Google Scholar]
- [9].Kraeft S-K, Ladanyi A, Galiger K, Herlitz A, Sher AC, Bergsrud DE, Even G, Brunelle S, Harris L, Salgia R, Dahl T, Kesterson J, Chen LB. Clin. Cancer Res. 2004;10:3020. doi: 10.1158/1078-0432.ccr-03-0361. [DOI] [PubMed] [Google Scholar]
- [10].Krivacic RT, Ladanyi A, Curry DN, Hsieh HB, Kuhn P, Bergsrud DE, Kepros JF, Barbera T, Ho MY, Chen LB, Lerner RA, Bruce RH. Proc. Natl. Acad. Sci. USA. 2004;101:10501. doi: 10.1073/pnas.0404036101. [DOI] [PMC free article] [PubMed] [Google Scholar]
- [11].Galanzha EI, Shashkov EV, Kelly T, Kim J-W, Yang L, Zharov VP. Nat. Nanotechnol. 2009;4:855. doi: 10.1038/nnano.2009.333. [DOI] [PMC free article] [PubMed] [Google Scholar]
- [12].Georgakoudi I, Solban N, Novak J, Rice WL, Wei X, Hasan T, Lin CP. Cancer Res. 2004;64:5044. doi: 10.1158/0008-5472.CAN-04-1058. [DOI] [PubMed] [Google Scholar]
- [13].He W, Wang H, Hartmann LC, Cheng J-X, Low PS. Proc. Natl. Acad. Sci. USA. 2007;104:11760. doi: 10.1073/pnas.0703875104. [DOI] [PMC free article] [PubMed] [Google Scholar]
- [14].Wang LV, Hu S. Science. 2012;335:1458. doi: 10.1126/science.1216210. [DOI] [PMC free article] [PubMed] [Google Scholar]
- [15].Jain PK, Lee KS, El-Sayed IH, El-Sayed MA. J. Phys. Chem. B. 2006;110:7238. doi: 10.1021/jp057170o. [DOI] [PubMed] [Google Scholar]
- [16].Hu X, Gao X. Phys. Chem. Chem. Phys. 2011;13:10028. doi: 10.1039/c0cp02434a. [DOI] [PMC free article] [PubMed] [Google Scholar]
- [17].Link S, Burda C, Mohamed MB, Nikoobakht B, El-Sayed MA. J. Phys. Chem. A. 1999;103:1165. [Google Scholar]
- [18].Link S, El-Sayed MA. Int. Rev. Phys. Chem. 2000;19:409. [Google Scholar]
- [19].Chon JWM, Bullen C, Zijlstra P, Gu M. Adv. Funct. Mater. 2007;17:875. [Google Scholar]
- [20].Horiguchi Y, Honda K, Kato Y, Nakashima N, Niidome Y. Langmuir. 2008;24:12026. doi: 10.1021/la800811j. [DOI] [PubMed] [Google Scholar]
- [21].Link S, Burda C, Nikoobakht B, El-Sayed MA. Chem. Phys. Lett. 1999;315:12. [Google Scholar]
- [22].Lee JE, Lee N, Kim H, Kim J, Choi SH, Kim JH, Kim T, Song IC, Park SP, Moon WK, Hyeon T. J. Am. Chem. Soc. 2009;132:552. doi: 10.1021/ja905793q. [DOI] [PubMed] [Google Scholar]
- [23].Pham T, Jackson JB, Halas NJ, Lee TR. Langmuir. 2002;18:4915. [Google Scholar]
- [24].Huang X, Neretina S, El-Sayed MA. Adv. Mater. 2009;21:4880. doi: 10.1002/adma.200802789. [DOI] [PubMed] [Google Scholar]
- [25].Moore D, Altarescu G, Pursley R, Campia U, Panza J, Dimitriadis E, Schiffmann R. BMC Cardiovascular Disord. 2002;2:1. doi: 10.1186/1471-2261-2-1. [DOI] [PMC free article] [PubMed] [Google Scholar]
- [26].Jin Y, Jia C, Huang S-W, O'Donnell M, Gao X. Nat. Commun. 2010;1:41. doi: 10.1038/ncomms1042. [DOI] [PMC free article] [PubMed] [Google Scholar]
- [27].Jana NR, Gearheart L, Murphy CJ. Adv. Mater. 2001;13:1389. [Google Scholar]
- [28].Nikoobakht B, El-Sayed MA. Chem. Mater. 2003;15:1957. [Google Scholar]
- [29].American National Standard for Safe Use of Lasers in Health Care. Vol Z136.3. American National Standards Institute; New York: 2011. [Google Scholar]
Associated Data
This section collects any data citations, data availability statements, or supplementary materials included in this article.


