

Abstract
The epidermal growth factor receptor (EGFR) kinase is generally considered to be activated by either ligand-induced dimerisation or a ligand-induced conformational change within pre-formed dimers. Ligand-induced higher-order EGFR oligomerisation or clustering has been reported but it is not clear how EGFR oligomers, as distinct from EGFR dimers, influence signaling outputs. To address this question, we combined measures of receptor clustering (microscopy; image correlation spectroscopy) and phosphorylation (Western blots) with modelling of mass-action chemical kinetics. A stable BaF/3 cell-line that contains a high proportion (>90%) of inactive dimers of EGFR-eGFP but no secreted ligand and no other detectable ErbB receptors was used as the model cell system. EGF at concentrations of greater than 1 nM was found to cluster EGFR-eGFP dimers into higher-order complexes and cause parallel increases in EGFR phosphorylation. The kinetics of EGFR clustering and phosphorylation were both rapid, plateauing within 2 minutes after stimulation with 30 nM EGF. A rule-based model was formulated to interpret the data. This model took into account ligand binding, ligand-induced conformational changes in the cytosolic tail, monomer-dimer-trimer-tetramer transitions via ectodomain- and kinase-mediated interactions, and phosphorylation. The model predicts that cyclic EGFR tetramers are the predominant phosphorylated species, in which activated receptor dimers adopt a cyclic side-by-side orientation, and that receptor kinase activation is stabilised by the intramolecular interactions responsible for cyclic tetramerization.
Keywords: EGF receptor, Rule-based modelling, Receptor clustering, Image correlation spectroscopy, Signalling
Introduction
The epidermal growth factor receptor (EGFR) is one of four members of the ErbB family of receptor tyrosine kinase receptors involved in cell signaling (-3). Activation of the EGFR kinase following ligand binding has generally been considered to involve either a ligand-induced monomer-dimer transition (4) or a ligand-induced conformational change within pre-formed dimers (5–9) leading to an asymmetric arrangement of intracellular kinase domains (6). Tetramers and higher-order oligomers (i.e., oligomers larger than dimers) have been reported previously for EGFR (erbB1) (10–12), erbB2 (13), erbB3 (14) and proposed for erbB1/erbB2 (15) and erbB2/erbB3 (16) but it is not clear whether the higher-order oligomers are involved in positive or negative signaling. There is some evidence that higher-order EGFR oligomers are associated with signal attenuation (17, 18) but other reports that clustering amplifies signals (18–21). Recent studies by the Landgraf laboratory have pointed to the inadequacy of the dimer-only model and implicated dimer-dimer interactions as being important for erbB2/erbB3 phosphorylation and signaling (22). Given that the size and spatial organization of receptor clusters influence the pathways of cellular activation in other systems (23, 24) it is important to clarify the relationship between higher-order oligomerisation and the initial events after ligand binding.
Clarification of the impact of EGFR clustering on EGFR signalling requires a more precise determination of the link between oligomerisation and phosphorylation. Because monomer-dimer transitions are also linked to activation and phosphorylation we require cells that contain a high level of pre-formed EGFR dimer so that the role of oligomers larger than dimers can be more confidently assessed. Therefore, BaF/3 cells stably-transfected with C-terminally-tagged EGFR (EGFR-eGFP) were employed as the model cell system because these cells contain a high level of pre-formed inactive dimers (up to 93–95%) in the absence of ligand and are devoid of other erbB receptor members (e.g., erbB2) or secreted ligands (10, 25). To examine the receptor on the cell surface, prior to internalisation and deactivation, we used phenylarsine oxide (PAO) to block receptor internalization (26–28). Phenylarsine oxide also represses phosphatases (29, 30). Finally, because we used spatial autocorrelation methods to examine receptor clustering, and oligomeric transitions are expected to be dynamic and transient (31), we used fixation to trap the oligomers. Parallel measurements of image correlation spectroscopy and Western blots on the same cell preparations were performed to determine the link between EGFR-eGFP clustering and EGFR-eGFP phosphorylation, respectively. We compared the phosphorylation level with the relative level of EGFR-eGFP clustering as a function of (a) EGF dose (with clustering assayed at a fixed time after addition of EGF) and (b) time after addition of a fixed dose of EGF. We discuss the possible ramifications of higher-order oligomer formation on the signaling output from the EGFR in the context of a theoretical model that is capable of dealing with the complex nature of multiple receptor states. This model takes into account ligand binding, conformational changes in the cytosolic tail, monomer-dimer-trimer-tetramer transitions and phosphorylation.
Experimental Procedures
Cells and Reagents
Production and purification of the mAbs 806 and 528 have been described previously (21). Both antibodies were produced in the Biological Production Facility (Ludwig Institute for Cancer Research, Melbourne, Australia). The murine haemopoietic cell line BaF/3 expressing C-terminally tagged EGFR-eGFP constructs has been described previously (10, 25).
Anti-phosphotyrosine antibody (clone 4G10) was purchased from Upstate Biotechnology Inc. (Lake Placid, NY). Murine EGF was purified from mouse sub-maxillary glands as described previously (32).
FACS analysis
Levels and stability of expression of EGFR-eGFP in BaF/3 cells were assessed by FACS analysis on a FACStar (Becton and Dickinson, Franklin Lakes, NJ), using antibodies directed to the EGFR extracellular domain (Alexa546-labelled immunoglobulin 528: 20 μg/ml in PBS, 5% FCS, 5 mM EDTA). Cells were maintained in culture under selection with 1.5 mg/ml G418 as previously described (10). Prior to experimentation, cells were washed with PBS and re-suspended in media.
EGF dose-response experiments
BaF/3 cells expressing EGFR-eGFP were thoroughly washed in serum free media and serum-starved at 37 °C for 2.5 hours. Cells (4–8 × 10⁶/ml) were re-suspended in 10 ml PBS solution containing 10 μM phenyl arsine oxide (PAO) and aliquoted into 10 tubes for biochemistry (Tubes 1–5) and microscopy experiments (Tubes 6–10). Aliquots of EGF stock solution were added to the tubes to give final EGF concentrations of 0, 0.1, 1, 10 and 100 nM in duplicate. Tubes were inverted 4–5 times and allowed to incubate at room temperature (22 °C) for 10 minutes.
Cells for Western blot analysis (Tubes 1–5) were collected by centrifugation. Cells were then washed in ice cold PBS, whole cell lysates prepared using RIPA buffer, and proteins separated by Sodium Dodecyl Sulfate-Polyacrylamide Gel Electrophoresis (SDS-PAGE) as previously described (10). Proteins were then transferred to polyvinylidene difluoride membranes (Millipore Corporation) for immuno-detection with anti-phosphotyrosine antibody (4G10, Upstate Biotechnology, Inc.), anti-total EGFR (mAb806), a monoclonal anti-GAPDH (Sigma-Aldrich) (as loading control), followed by incubation with Odyssey anti-mouse secondary antibody. Blot membranes were scanned using the Odyssey Infrared Imaging System (LI-COR, Nebraska). Immunoreactive bands were quantified by a scanning densitometer and wide-line integration in GeneTools (Syngene). At least three independent experiments were performed with similar outcome.
Cells (Tubes 6–10) for confocal microscopy and image correlation analysis were collected by centrifugation, and fixed with 4% PFA solution on ice for 15 minutes. The fixed cells were washed in PBS, pelleted and re-suspended in a small volume of PBS. For microscopy experiments the cells were pipetted onto a soft agar bed (pre-heated 1% low melting point agarose) on top of a cover slip in a Sykes and Moore imaging chamber. After allowing the agarose gel to polymerise, cells were imaged using an Olympus FV1000 laser confocal scanning microscope. Cells were imaged using a 60X, NA 1.2 water immersion lens; zoom 10×. Each 512 × 512 image was the accumulation of 50 scans (~1.7 sec each) in photon counting mode. 64 × 64 pixel by pixel regions of interest were selected for image correlation analysis and fitting using procedures described previously (10, 25).
Time-course experiments
The protocol for the time-course experiments is the same as for the EGF dose-response experiments with the important exceptions that (a) stimulation was with one concentration of EGF only (30 nM) and (b) the cells were stimulated for different times. Cells were serum starved (as for the EGF dose-response experiments) and then transferred to a PAO/PBS solution for 0.5 hour. Cells were then stimulated with 30 nM EGF for the following time periods: 0.5, 1, 2, 3, 5, 7 and 10 min. After stimulation half the samples were used for Western blots to examine phosphorylation and the other half were fixed with ice-cold PFA (as described above) for confocal microscopy and ICS analysis.
Image correlation spectroscopy
ICS was performed as previously described (10). Regions of interest (ROIs) on cell surfaces were selected for ICS analysis. ROIs were auto-correlated using the Fourier Transform Math option in ImageJ (ImageJ, National Institutes of Health), normalized by the number of pixels and average intensity squared, and corrected for background intensity. Data were fit to a Gaussian-plus-offset function as described by Petersen et al. (33). The amplitude of the autocorrelation function (g(0)) and the full-width-at-half-maximum (r) are related to the cluster density (CD, number of clusters per square micron) by the equation
| (1) |
A cluster can be a monomer, a dimer or any arbitrary sized oligomer. As a result, the cluster density does not give information on the aggregation state of a molecule. However, changes in average aggregation state can be determined, provided the average number of molecules (N) per area remains constant.
Using the definition of degree of aggregation (DA) by Petersen et al. (33) as the average number of molecules per cluster, DA = N/CD, a change in the aggregation state can be represented by the ratio DA2/DA1 =(CD1/CD2)(N2/N1). If identical cells are used (same expression levels of molecules) and the molecules are retained at the cell surface during manipulations (this is why the experiments were performed with PAO to prevent internalization) then N2 = N1 and DA2/DA1 =(CD1/CD2).
Theoretical Model
We developed a mechanistic rule-based model for cell-surface EGFR aggregation and phosphorylation. A rule-based model is composed of a set of rules for molecular interactions, each of which can be viewed as corresponding to a type of reaction or reaction class. The reaction classes considered in the model are illustrated in Fig. 1. These reaction classes capture several aspects of EGF-EGFR and EGFR-EGFR interactions. Briefly, these include ligand binding to receptor monomers and receptors crosslinked through an ectodomain-ectodomain interface ((34) Box I), and ligand-induced and ligand-independent conformation changes of the EGFR cytosolic domain (Box II). The interactions in Box I can occur between receptors regardless of the conformational states of their cytosolic domains (Boxes III and IV). Monomer-dimer transitions mediated by cytosolic domains are allowed when these domains are each in a permissive conformation (35) (Box V). Higher-order associations are included owing to the increased receptor valency imposed by having ectodomain-ectodomain (36, 37) and tail-tail interactions (6, 35) (Box V and Box VI). Head-to-tail-type interactions for these oligomers (12) are illustrated in Box V and side-by-side (intramolecular) interactions (10) in Box VI. Receptor phosphorylation and de-phosphorylation are illustrated in Boxes VII and VIII, respectively.
Figure 1.

Schematic illustration of a rule-based model for EGF-EGFR and EGFR-EGFR interactions. Boxes I, III and IV represent rules for reactions considered in many previous models (34, 38, 39) and Boxes II, VI, VII and VIII represent rules for additional reactions considered here. In the figure, a ligand molecule is denoted with a filled circle and a receptor molecule is represented with a Y-shaped structure. The squiggled tail in a receptor represents a ligand-induced conformation of the EGFR cytosolic domain. A question mark on top of a receptor indicates that the ligand-binding status of the receptor is taken to have no effect; a question mark next to a stick at an intermediate region of a receptor indicates that the ectodomain-crosslinking status of the receptor is taken to have no effect; and a question mark and a stick at the end of a receptor tail indicates that the cytosolic crosslinking status of the receptor is taken to have no effect. A ball and chain at the end of a receptor tail represents receptor phosphorylation. In Boxes III and IV, only monomeric reactants in ectodomain-mediated crosslinking reactions are shown. However, higher-order oligomeric reactants are also allowed to participate in these reactions. In Box VII, the lumped parameter χ × λf where λf denotes, λf 0, λf1, or λf2, represents the effective forward rate constant for ring-closure binding via ectodomain-ectodomain interaction. The lumped parameter χ × λcx represents the effective forward rate constant for ring-closure binding via cytosolic domain crosslinking. A complete and executable specification of the model illustrated here can be found in the supplementary material (File S1). Rules in the model specification and the corresponding reaction classes illustrated here are related by common rate constants. Model parameter values are summarized in Table 1.
In Fig. 1, Boxes I, III and IV illustrate reaction classes that have been included in a number of models for EGF-EGFR and EGFR-EGFR interactions (34, 38, 39). According to the scheme of Box I, III or IV, receptors form ectodomain-mediated dimers in the absence or presence of ligand binding. The equilibrium binding constant for EGF-EGFR interaction depends on whether the EGFR ectodomain is bound or free. If the ectodomain is bound (to another receptor), the ligand occupancy state of the binding partner is also important. Similarly, the equilibrium binding constant for the ectodomain-ectodomain interaction depends on the ligand occupancy states of the interacting receptors. Distinct equilibrium binding constants apply to the cases where (a) both receptors are free, (b) one is free and the other is occupied, and (c) both receptors are occupied by ligand binding. We assume that EGF-EGFR and ectodomain-ectodomain interactions are independent of the conformation state of the EGFR cytosolic domain. Thus, the same set of rate constants are considered in each of the three boxes (I, III, and IV). It should be noted that the equilibrium binding constants of Boxes I, III and IV are taken to be related by constraints of detailed balance (Table I). In other words, only four of the six equilibrium binding constants are specified independently. Detailed balance was taken to constrain these parameters in earlier models for EGF-EGFR and EGFR-EGFR interactions (34, 38, 39).
Box II illustrates reactions where ligand binding mediates a reversible conformation change in the cytosolic domain of EGFR. (The conformation change is indicated by a squiggled tail of a receptor in the cartoon.) In the model, the functional effect of the conformation change is that the kinase domain becomes available to participate in a cytosolic domain-cytosolic domain, or tail-tail, interaction. Once two cytosolic domains are in contact, each kinase domain is taken to be activated (i.e. able to mediate phosphorylation) and each cytoplasmic tail is taken to be available for phosphorylation (40). In other words, as a simplification, we assume that the two kinase domains involved in a tail-tail interaction rapidly switch between the acceptor and receiver roles relative to the duration of the tail-tail interaction. An EGFR with a cytosolic domain in the ligand-modified conformation can return to the basal conformation via a reverse reaction. The reverse reaction is assumed to be independent of ligand binding and ectodomain-crosslinking, but allowed only if the cytosolic domain is not engaged in cytosolic interaction with another EGFR. In Box II and elsewhere in the cartoons of Fig. 1, a question mark on top of a receptor indicates that the ligand-occupancy state of the receptor is taken to have no influence on the reaction in question. Likewise, a question mark with a stick at an intermediate region of a receptor indicates that the ectodomain binding state of the receptor is taken to have no influence on the reaction in question.
Boxes III and IV show the same set of reactions as in Box I for the cases where either one or two receptors have a cytosolic domain in the ligand-modified conformation. As indicated by the common parameters across Boxes I, III, and IV, we assume that the conformation of the EGFR cytosolic domain alone has no influence on EGF-EGFR binding or ectodomain-ectodomain interactions.
Box V illustrates cytosolic domain-mediated interaction between two receptors, each with a cytosolic domain in the permissive ligand-induced conformation. The reaction classes illustrated here are assumed to be independent of ligand binding and ectodomain-mediated crosslinking. The oligomeric species that can arise from association of two cytosolic domains are shown with their ligand-occupancy states undefined. We assume that oligomeric species have a maximum of four receptor molecules to be consistent with the cluster size measurements for the BaF/3 cell system examined in this work (10) and the aggregate distributions reported by others (41). It should be noted that oligomers arising from cytosolic domain-mediated crosslinking (Box V) can participate in ectodomain-mediated crosslinking reactions (Boxes III and IV). However, any crosslinking reaction that would result in an oligomer containing more than four receptors is prohibited.
Box VI illustrates reaction classes considered in the model that can generate a cyclic receptor tetramer, which we equate with a side-by-side dimer-of-dimers (10). The cyclic complex is formed from a linear tetrameric chain of receptors, wherein all four receptor kinases are in the ligand-induced conformation permissive for tail-tail interaction. The two terminal receptors in such a chain interact through either an ectodomain-ectodomain or tail-tail interaction to form the fourth bond of the cyclic complex. This interaction is an intracomplex association reaction, or ring-closure reaction. A ring-closure reaction is characterized by an effective affinity much higher than the affinity for the corresponding reaction between two freely diffusing, untethered binding sites, because of the high local concentration of binding sites that arises from the tethering of these sites within a confined volume. In the model, the effect of tethering is captured by an enhancement factor χ, which multiplies the forward rate constant for the reaction between untethered binding sites (Box VI). The enhancement factor is taken to be the same for both of the two types of ring-closure reactions. It should be noted that four protein-protein interfaces of two types hold a tetrameric complex of receptors together, and breaking any of these interfaces to convert a ring to a chain is likely to be transient, because the resulting free binding sites are tethered and, in the model, for nominal parameter values, rebinding is faster on average than dissociation of any of the remaining bonds in a chain. The magnitude of the enhancement factor (i.e., the value of χ) determines the equilibrium distribution of ring and chain receptor tetramers in the model.
Box VII illustrates how EGFR phosphorylation is considered in the model. As mentioned above, receptor transphosphorylation occurs when two receptors interact via their activated kinase domains (40). As indicated, we take receptor phosphorylation to be independent of the states of the ectodomains of receptors in contact through their kinase domains. In other words, in the model, given two activated kinases are in contact via a cytosolic interaction, transphosphorylation is permitted regardless of other factors, such as ligand occupancy states of the receptors, ectodomain-ectodomain interactions or size of the aggregate in which receptors are found. For simplicity, we only consider a single site of phosphorylation in EGFR. This approach captures the average phosphorylation level of a receptor, or equivalently, the amount of receptor phosphorylation that would be detected with an anti-pY antibody (up to a scale factor). Note that a phosphorylated site is represented with ball-and-chain notation in the cartoon.
Box VIII illustrates how EGFR dephosphorylation is considered in the model. Dephosphorylation of a receptor is taken to be independent of its ligand-binding, aggregation state and activation status and mediated by phosphatases considered to be in excess and included implicitly in the model, i.e., dephosphosphorylation is allowed to occur spontaneously with first-order kinetics.
We considered two special cases of the model described above. The first special case is a “dimer only” model, which corresponds to the equilibrium model and parameter estimates of Macdonald and Pike (34). The reactions captured in the “dimer-only” model are represented in Box I of Figure 1. The second special case is a “linear oligomers-only” model that allows formation of linear oligomers up to tetramers but prohibits formation of cyclic aggregates. This form of the model is obtained by setting χ=0 (i.e., by disallowing the ring-closure reactions of Box VI in Figure 1).
Simulations and parameter estimation
The model was formulated using the rule-based modelling approach (42, 43). Rules, which are each associated with a rate law, were specified for the interactions and transformations depicted in Figure 1 using BNGL, a model-specification language compatible with a number of software tools. We used BioNetGen (44) to process the BNGL-encoded model specification to generate the reaction network implied by the rules of the model, and we then simulated the network using the built-in deterministic simulation engine of BioNetGen. The deterministic simulation engine of BioNetGen is provided by CVODE (45), a software package for numerical integration of ODEs. The reaction network consists of 923 chemical species and 11,918 unidirectional reactions. The model has ~20 parameters, most of which are rate constants. The number of rate constants is less than the number of reactions because reactions derived from a rule in the process of network generation inherent the rate law of the rule. In this way, the model provides a coarse-grained characterization of the chemical kinetics of the interactions of Figure 1. The coarse graining is justified if the interactions are modular.
Model parameter values are listed in Table 1. Most of the parameter values were taken from the literature (34, 46–48); we estimated five of the parameters (plus a scaling factor α) through fitting to the new experimental data presented in this report (nonlinear least squares fitting via direct search). Thus, the model was taken to have only six adjustable parameters. These parameters characterize ligand-induced conformation change of the EGFR cytosolic domain, cytosolic domain-cytosolic domain interaction, and cyclization of a linear head-to-tail EGFR tetramer to form a side-by-side dimer-of-dimers tetramer. The scaling factor α relates predicted cluster density to fluorescence data. Confidence intervals for our parameter estimates and the results of a local sensitivity analysis are given in the supplementary material (see Table S1 and S2 not only for the results but also for the methodological details). We also took a Bayesian approach to parameter estimation (49–51), which is described in Appendix S1.
Table 1.
Model parameter values
| Parameter name
|
Value | Comment2 | |
|---|---|---|---|
| in Fig. 1 | in Supp.1 | ||
| Concentrations | |||
| — | LT | 0.001–100 nM | Total ligand concentration. |
| — | RT | 0.09 nM | Total receptor concentration.3 |
| EGF interaction when receptor ectodomain is not crosslinked | |||
| — | K11 | 4.6 nM−1 | Equilibrium association constant.4 |
| kr,1 | k11r | 0.02 s−1 | Dissociation rate constant.5 |
| kf,1 | k11f | 0.092 nM−1s−1 | Association rate constant (derived from K11 and K11r) |
| EGF interaction when both receptors crosslinked via ectodomain are free of EGF | |||
| — | K21 | 5.3 nM−1 | Equilibrium association constant.4 |
| kr,2 | k21r | 0.02 s−1 | Dissociation rate constant.6 |
| kf,2 | k21f | 0.053 nM−1s−1 | Association rate constant (derived from K21 and k21r) |
| EGF interaction when only one receptor crosslinked via ectodomain is free of EGF | |||
| — | K22 | 0.34 nM−1 | Equilibrium association constant.4 |
| kr,3 | k22r | 0.2 s−1 | Dissociation rate constant.7 |
| kf,3 | k22f | 0.136 nM−1s−1 | Association rate constant (derived from K11 and k11r) |
| Ectodomain-ectodomain interaction when both receptors are free of EGF | |||
| — | L20 | 212 nM−1 | Equilibrium crosslinking constant.4 |
| λr0 | l20r | 1.24 s−1 | Dissociation rate constant.8 |
| λf0 | l20f | 526 nM−1s−1 | Association rate constant (derived from L20 and l20r) |
| Ectodomain-ectodomain interaction when only one receptor is bound to EGF | |||
| — | L21 | 244 nM−1 | Equilibrium crosslinking constant (derived from detailed balance).9 |
| λr1 | l21r | 0.738 s−1 | Dissociation rate constant.8 |
| λf1 | l21f | 180 nM−1s−1 | Association rate constant (derived from L21 and l21r) |
| Ectodomain-ectodomain interaction when both receptors are bound to EGF | |||
| — | L22 | 18.0 nM−1 | Equilibrium crosslinking constant (derived from detailed balance).9 |
| λr2 | l22r | 0.272 s−1 | Dissociation rate constant.8 |
| λf2 | l22f | 9.79 nM−1s−1 | Association rate constant (derived from L22 and l22r) |
| Conformation change of the EGFR cytosolic domain | |||
| ku | k_o | 6 s−1 | Rate constant for activating ligand-mediated change.10 |
| kv | k_c | 1.6 s−1 | Rate constant for deactivating ligand-independent change. 10 |
| Tail-tail interaction mediated by EGFR kinase and juxtamembrane domains | |||
| kcx | kaf | 15.4 nM−1s−1 | Association rate constant.10 |
| kcr | kar | 8.89 s−1 | Dissociation rate constant.10 |
| EGFR phosphorylation and dephsphorylation | |||
| kp | kp | 1 s−1 | Phosphorylation rate constant.11 |
| kdp | kdp | 1 s−1 | Dephosphorylation rate constant.11 |
| Effect on association reactions when binding partners are tethered | |||
| χ | chi_r | 4.37×10⁴ nM | Enhancement factor for ring-closure reactions.10 |
The supplemental materials include a plain-text BioNetGen input file (File S1), which provides a complete and executable specification of the model using the BNGL model-specification language (44).
Additional comments about parameter values are included in the supplemental BioNetGen input file (File S1).
The value is based on 90,000 EGFR per cell and a cell density of 6×10⁵ cells/ml.
The value is taken from Macdonald and Pike (34).
The value is taken from Elleman et al. (47)
We assume that kr,2 is the same as kr,1.
We assume that kr,3 is 10-fold larger than kr,1. This assumption is consistent with the difference between K11 (or K21) and K22.
The value is taken from Low-Nam et al. (46).
The value of L21 is derived from the detailed balance relation: L21=K21×L20/K11. The value of L22 is derived from the detailed balance relation: L22=K22×L21/K11.
The values of ku, kv, kcx, kcr and χ (as well as a scaling factor α=5.17×10⁻²) were determined through fitting as described in the text.
The value is consistent with data and analysis of Kleiman et al. (48). Phosphorylation and dephosphorylation are modelled as first-order processes as a simplification. Either receptor in a dimer connected through a tail-tail interaction can be phosphorylated. As indicated by the estimate of kdp, we assume that there is significant phosphatase activity in the presence of PAO.
Results
Effect of EGF on EGFR-eGFP aggregation
Our previous studies used ICS and saturating concentrations of EGF to establish that EGF induces increased aggregation of EGFR-eGFP in BaF/3 cells (10), with a predominantly dimeric EGFR population (>90% dimer (25)) in the absence of EGF transitioning to higher-order oligomers in the presence of EGF. We have found similar results for HEK293 cells (20). To determine the EGF concentration range where higher-order aggregation occurs, we examined the effect of EGF on the average EGFR-eGFP aggregation state using ICS. Figure 2A displays a representative image of EGFR-eGFP at the BaF/3 cell surface and spatial autocorrelation function image computed from a small region of the cell surface. Table 2 summarises the ICS parameters (autocorrelation amplitude, autocorrelation width, average image intensity and cluster density) as a function of increasing EGF concentration from several sets of cells (N>40 for each set). As expected, the density of EGFR clusters decreased with increasing EGF concentration (by ~50% from 0 to 10 nM). Because we used conditions where EGFR-eGFP was retained at the cell surface at constant number (i.e., PAO was present), the decrease in cluster density implies an increase in average EGFR-eGFP aggregation state. The other parameters in Table 2 also contain important information about the EGFR-eGFP clusters. The average image intensity, a measure of the total number of EGFR-eGFP, was fairly constant and largely independent of EGF concentration. At 100 nM EGF there appeared to be a small but significant increase in image intensity (by 11%) with a comparatively smaller increase in cluster density (CD) (by 5%). Nevertheless, the average intensity per cluster increased with increasing EGF. The magnitude of the autocorrelation width (~9 pixels) was close to the expected point-spread-function width of the confocal microscope (~10 pixels) and was independent of EGF concentration. This implies that the EGFR-eGFP clusters are sub-microscopic at all EGF concentrations and they retain their spatial positions over the image acquisition time of several minutes. In Figure 2B we have plotted the calculated cluster density of EGFR-eGFP clusters on BaF/3 cells as a function of EGF concentration. The decrease in CD from 0 to 0.1 nM EGF was small and not statistically significant (p=0.23). However a sharp and statistically-significant decrease in CD was observed at an EGF concentration of 1 nM (p=0.01). The CD values appeared to plateau at a concentration of 10 nM EGF.
Figure 2.
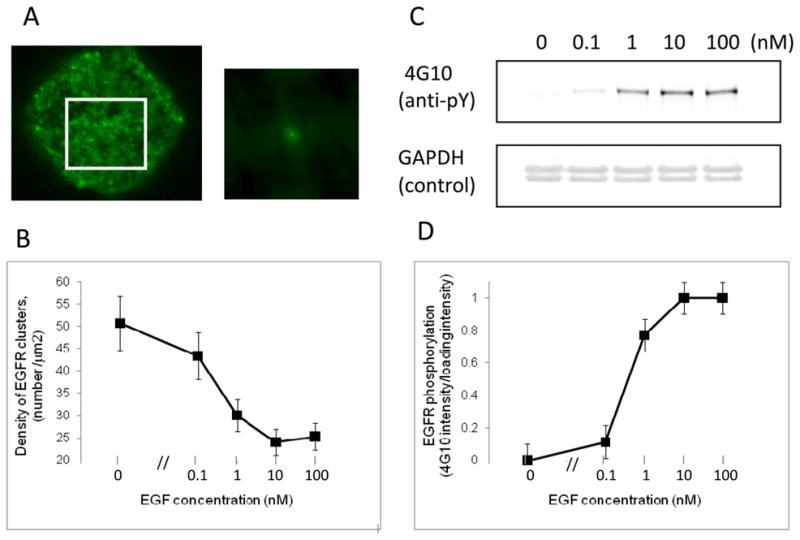
EGF-dependent EGFR-eGFP clustering and phosphorylation. (A) Left. Confocal laser scanning microscopy image of EGFR-eGFP on the “apical” membrane surface of a BaF/3 cell (no EGF). Right. 2D spatial autocorrelation function image computed from the white square region on the cell (from the left). Parameters corresponding to fits for several autocorrelation images are collected in Table 2. (B) Plot of the average cluster density (number of aggregates per μm2) as a function of EGF concentration (nM). The cluster density was determined using image correlation spectroscopy as described in the text. Each point represents the average of >40 ROIs from 10 images. Error bars represent standard error about the mean (N>40). (C) Anti-phosphotyrosine reactivity of EGFR-eGFP (top row) and loading control (bottom row). Note the increase in antiphosphotyrosine staining with increasing EGF concentration. Total EGFR-eGFP protein was also detected using mAb806 and was constant (data not shown). (D) Plot of the specific phosphorylation of EGFR-eGFP as a function of EGF concentration from the same cell pool as Figure 2A.
Table 2.
ICSa Parameters for EGFR-eGFP as a function of EGF concentration in BaF/3 cells.
| EGF conc.(nM) | b G(0) (±SEM) | c r (±SEM) | d<I> (±SEM) | e CD (±SEM) | f N |
|---|---|---|---|---|---|
| 0 | 0.058 | 9.4±0.2 | 950±30 | 50.7±4.9 | 45 |
| 0.1 | 0.066 | 9.5±0.3 | 940±30 | 43.3±3.8 | 44 |
| 1 | 0.082 | 9.3±0.2 | 920±30 | 36.6±2.7 | 44 |
| 10 | 0.124 | 9.3±0.3 | 920±30 | 24.1±2.1 | 44 |
| 100 | 0.118 | 9.3±0.3 | 1020±40 | 25.3±2.0 | 40 |
Confocal microscopy: excitation, 488 nm, emission 520–560 nm.
G(0), amplitude of the spatial autocorrelation function.
r, width of the spatial autocorrelation function in units of pixels (1 pixel= 35 nm). PSF width is ~10 pixels
<I>, average intensity sampled in the images (proportional to number of molecules), a.u.
CD, calculated density of clusters, clusters per square micron.
N, number of measurements.
Effect of EGF on phosphorylation of EGFR-eGFP
Results of parallel, EGF-dependent, measurements of phosphorylation (i.e., antibody staining) on the same cell population are displayed in Figure 2C and 2D. Figure 2C represents a typical Western blot. In the absence of EGF, specific EGFR-eGFP phosphorylation was negligible but phosphorylation increased in an EGF-dependent manner up to 10 nM. Quantitative evaluations of the Western blot, correcting for protein loading, are shown in Figure 2D. As expected, increasing the EGF concentration leads to kinase activation and phosphorylation of EGFR-eGFP. As a consequence, increasing amounts of EGF led to increases in specific phosphorylation of the EGFR with a mid-point at about 1 nM. These results concur with our previously reported phosphorylation measurements on EGFR-eGFP and EGFR lacking the C-terminal eGFP tag (10).
Dynamics of ligand-induced EGFR clustering and phosphorylation
To determine the dynamics of EGFR-eGFP clustering and phosphorylation in BaF/3 cells we utilized a concentration of EGF that would give us the maximal dynamic range in terms of signal change. 30 nM EGF was chosen since it corresponds to a concentration that is at the plateau of EGFR-eGFP phosphorylation and aggregation (see Figures 2B and 2D). Measurements of EGFR-eGFP clustering as a function of EGF incubation time are displayed in Figure 3. The change in the intensity distribution of clusters at the cell surface is apparent from images collected at 0 minutes and 4 minutes (Figure 3A). Quantitative evaluations over several time points and several cells are displayed in Figure 3B. The cluster density decreased significantly at 0.5 minutes, reaching a plateau within 1 to 2 minutes. Parallel measurements of specific EGFR phosphorylation as a function of EGF incubation time are displayed in Figure 3C. Figure 3C displays typical Western blot results obtained using 4G10 antiphosphotyrosine to measure phosphorylation of EGFR-eGFP as a function of EGF stimulation time over an expanded time range. Figure 3D displays a plot of specific EGFR phosphorylation computed from densitometry of the Western blot as a function of time. It is clear that EGFR phosphorylation increased rapidly within a 1–2 minute period and reached a sustained level for a further period of 10 minutes. The time scale of the phosphorylation increase is similar to that reported recently for EGFR phosphorylation in A431 cells (52) and kinase activation of EGFR (using a fluorescent biosensor) in Cos7 cells (53). Both ligand-induced EGFR clustering and phosphorylation occur with similar dynamics.
Figure 3.
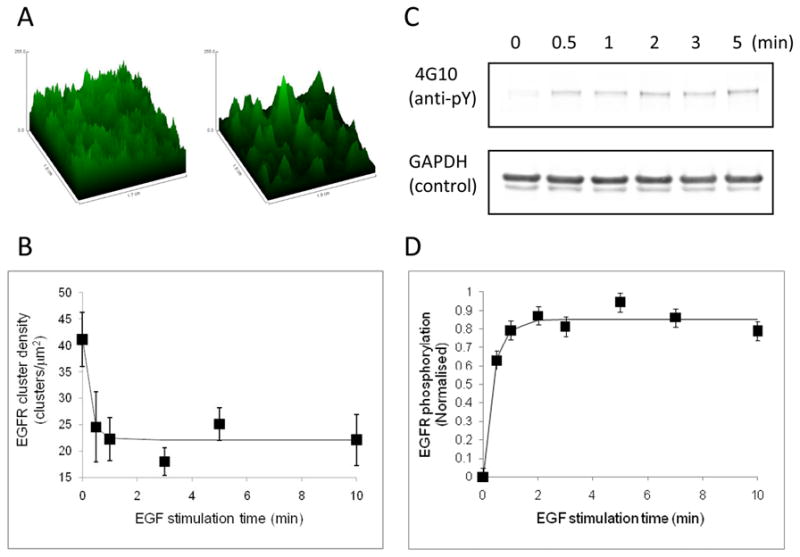
Dynamics of EGFR-eGFP clustering and phosphorylation. (A) Confocal images of EGFR-eGFP taken from regions on BaF/3 cell surfaces before (left) and after (right) 4 min incubation with 30 nM EGF. The z-axis represents fluorescence intensity and the x and y axes spatial coordinates. Images were manipulated for visualization purposes only. (B) EGFR-eGFP clustering as a function of time. Plot represents the density of EGFR clusters as a function of EGF stimulation time (EGF concentration was 30 nM). Data are represented by the symbols (error bars represent the SEM, n experiments) and the solid line is a fit to an exponential decay plus offset function. (C) Anti-phosphotyrosine reactivity of EGFR-eGFP (top row) and loading control (bottom row) as a function of EGF incubation time. Representative blots are shown. (D) Plot of the specific phosphorylation of EGFR-eGFP as a function of EGF incubation time. Data were pooled from several experiments which cover a wider time range than Fig. 2C (five independent biological experiments). Symbols represent data (error bars denote SEM values) and the solid line is a fit to an exponential rise plus offset function.
Model for EGFR aggregation and phosphorylation
We developed a mechanistic model to evaluate our hypothesis that EGF-binding may drive receptor aggregation into higher-order oligomers, to promote receptor phosphorylation and signalling. The mechanism is based on the key assumption that EGF binding promotes a conformation change of the intracellular part of the receptor permitting interaction between two receptor kinase domains and kinase activation. In the model, kinase-mediated and ectodomain-mediated interactions together allow receptors to form clusters larger than dimers. The model is illustrated in Figure 1 and is described in detail in the Theoretical Model section. Parameter values of the model are summarized in Table 1. A complete specification of the model is provided as a plain-text file in the supplementary material (File S1).
The model was taken to have six adjustable parameters (see Theoretical Model section) and the values of these parameters were tuned through a simple fitting procedure so that model simulations matched our data for receptor aggregation and phosphorylation. Other parameters were set to values reported in the literature. In the parameter fitting process, we required the model to reproduce the data for ligand dose-dependent cell-surface EGFR clustering (Figure 4A) and time-dependent clustering and receptor phosphorylation (Figures 4B and 4C). Fitting yielded estimates for the six adjustable parameter values of the model (Table 1), which characterize cytosolic domain-cytosolic domain association and dissociation (kcx and kcr), kinase domain activation and deactivation through conformation changes of the intracellular part of EGFR (ku and kv), and intracomplex ring-closure binding (χ). The sixth adjustable parameter is a constant scaling factor that relates predicted receptor cluster density to measured fluorescence (α). Confidence intervals for parameter estimates obtained through a bootstrapping procedure are given in Table S1. Using the estimated parameter values, we tested the model against the dose-dependent EGFR phosphorylation data in Figure 3B. The model captures the steady-state phosphorylation data (Figure 5) with no further fitting or parameter value adjustment.
Figure 4.
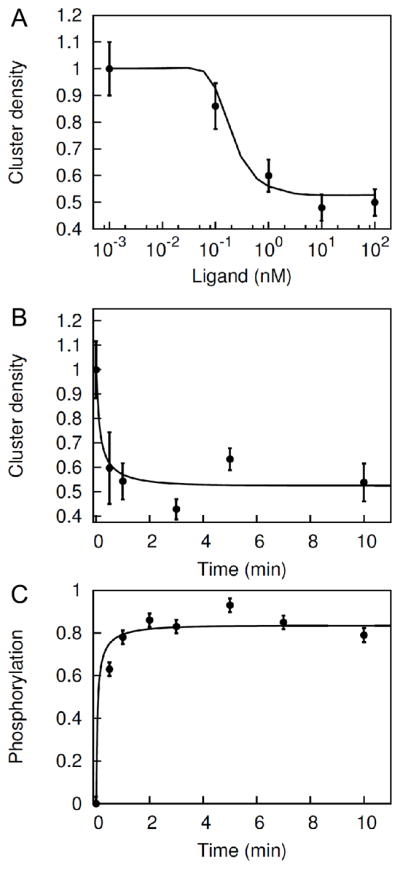
Model fitting to steady-state and kinetic data. The model was fitted simultaneously to capture (A) ligand dose-dependent change in EGFR cluster density (Figure 2B), (B) time-dependent change in EGFR cluster density (Figure 3B), and (C) time-dependent change in EGFR phosphorylation (Figure 3D). Lines represent simulation curves, and points represent experimental data. The time series plots (in Panel B and C) correspond to a fixed 30 nM ligand stimulation in both model and experiments. The parameters values that were extracted by fitting the three plots are listed in Table 1. Other parameter values were set at values reported in the literature, as indicated in Table 1.
Figure 5.
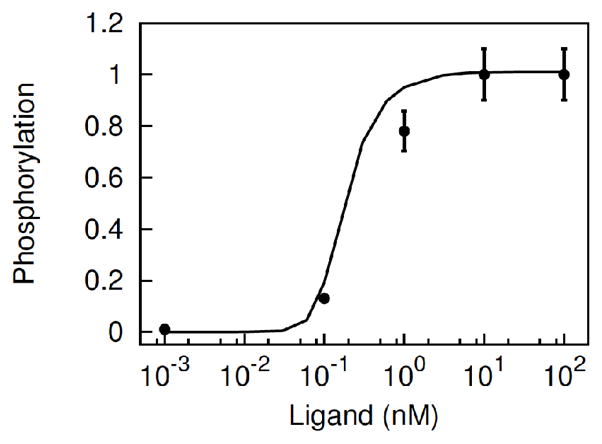
Model prediction of dose-dependent EGFR phosphorylation. The model with the parameter values of Table 1 was tested against the steady-state dose-dependent EGFR phosphorylation of Figure 2D. In the figure, the line represents the model prediction, and the points represent the experimental data (Figure 2D).
Results of a local sensitivity analysis (Table S2) indicate that model behavior is most sensitive to the total EGFR copy number, which is not surprising. After this parameter, the rate constants for receptor phosphorylation and dephosphorylation (kp and kdp) have the most influence on predicted receptor phosphorylation level (at a ligand dose of 30 nM), and the rate constants for cytosolic domain-cytosolic domain dissociation and association (kcr and kcx) have the most influence on predicted receptor cluster density (again at a ligand dose of 30 nM). However, model behavior is not particularly sensitive to (small) variation of any parameter value; the absolute values of sensitivity coefficients are less than 1 for all parameters except total EGFR copy number.
Our model is based partly on the reaction scheme (Box I, Figure 1) and equilibrium parameter estimates of Macdonald and Pike (34) (see the comments in the last column of Table 1). We asked if the simpler “dimer-only” model of Macdonald and Pike (34) could capture the measured ligand dose-dependence of receptor cluster density (Figure 2B) and receptor phosphorylation (Figure 2D). Predictions of the dimer-only model are shown in Figure S1. If we assume that receptor phosphorylation is proportional to the predicted equilibrium amount of receptor dimers bound to two copies of EGF, the dimer-only model reasonably matches the measured dependence of receptor phosphorylation on ligand dose (Panel A, Figure S1). However, the dimer-only model predicts that receptor cluster density increases, rather decreases as observed (cf. Figure 2B), with increasing ligand dose (Panel B, Figure S1).
Besides including ectodomain-ectodomain interactions, our model includes cytosolic domain-cytosolic domain interactions (Figure 1), which can generate linear oligomers of EGFR as well as cyclic receptor tetramers. We asked if formation of cyclic tetramers is an essential feature of our model by considering a reduced form of the model that omits the ring-closure reactions of Box VI in Figure 1, i.e., we set χ=0. (We consider disruption of ectodomain-ectodomain and cytosolic domain-cytosolic domain interactions below.) When χ=0, the model allows formation of linear chains of receptors up to tetramers but does not permit formation of cyclic tetramers. Predictions of the reduced “linear oligomers-only” model are shown in Figure S2; for these calculations, parameter values are as given in Table 1 with the exception that χ=0. Similar to the dimer-only model, the linear oligomers-only model is compatible with the measured ligand dose-dependence of receptor phosphorylation (Panel A, Figure S2) but this model predicts that receptor density increases slightly, rather than decreases markedly as observed (cf. Figure 2B), with increasing ligand dose (Panel B, Figure S2). This simple “backward elimination” analysis suggests that formation of cyclic tetramers is an essential aspect of our model that allows the model to reproduce observed behavior.
To gain confidence in this conclusion, we repeated parameter estimation using a more sophisticated Bayesian approach (49–51). This approach, which is described in Appendix S1, yields measures of confidence in parameter estimates as well as measures of confidence in model predictions. Marginal posterior distributions obtained from Bayesian parameter estimation for each of the six adjustable parameter values are reported in Figure S3. The results are consistent with the results of nonlinear least squares fitting (Table 1) and bootstrapping (Tables S1). Notably, the parameter χ is estimated to be significantly greater than 0 with high confidence (Panel E, Figure S3). Model prediction uncertainty is quantified in Figure S4. This figure shows predictions for 100 different combinations of parameter values. Each case corresponds to a sampling of the adjustable parameter values from the joint posterior distribution obtained through Bayesian parameter estimation. The model robustly predicts that receptor cluster density decreases with increasing ligand dose (Figure S4).
Cluster size distribution: time and ligand-dose dependence
We used the model to predict cell-surface EGFR cluster size distribution as a function of time and ligand concentration. A receptor cluster can be a free receptor molecule (monomer), or it can be an aggregate of up to four receptor molecules (dimer, trimer or tetramer). Figure 6A shows the time-dependent change in levels of these four types of clusters at a fixed level of stimulation (30 nM EGF). Figure 6B shows the dose-dependent change in levels of these clusters at steady state.
Figure 6.
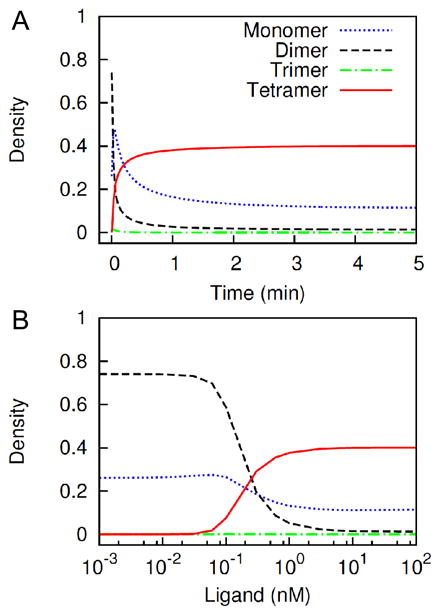
Model prediction of EGFR cluster size distribution as function of time and ligand dose. (A) Concentrations of monomeric, dimeric, trimeric and tetrameric receptor clusters are plotted as function of time after stimulation with 30 nM ligand. Concentration of each cluster type is normalized by the summed-up steady-state concentrations of all four types in the absence of stimulation (i.e., zero ligand concentration). (B) Concentrations of the same four cluster types at steady-state are plotted as function of ligand dose. Concentration of each cluster type is normalized by the summed-up steady-state concentrations of all cluster types in the absence of stimulation.
The results of Fig. 6B indicate that the equilibrium distribution of receptor cluster size is determined by the ligand dose. In the basal condition or at a low dose of ligand (< 0.1 nM), nearly 75% of clusters (~ 86% of receptors) are preformed dimers and 25% of clusters are free monomers (Figure 6B). At an intermediate dose (0.1 to 1 nM), the clusters represent a mixture of monomers, dimers and tetramers, where all three types are present at comparable amounts (Figure 6B). By 1 nM ligand, the clusters are predominantly tetramers, with only small amounts of monomers remaining. It may first seem puzzling that the receptor tetramers dominate the equilibrium distribution at high ligand concentrations with negligible levels of dimers and trimers. This behavior arises because, in the model, receptor tetramers can form a cyclic/ring complex via a ring-closure reaction (Box VI in Figure 1). Ring closure and maintenance of a cyclic receptor tetramer are mediated by intracomplex interactions with high apparent affinities because of high local concentrations of binding sites that stabilize the receptor tetramer (see Theoretical Model section). This extra stability from intramolecular interactions shifts the equilibrium in favor of the cyclic tetramer over the smaller aggregates. Once a high dose of ligand is added to the system, the preformed dimers form linear chains, and tetrameteric linear chains are then rapidly consumed to form cyclic tetramers via intracomplex interactions.
It is important to notice that a cyclic complex may stabilize the active conformation of receptors. Because of the long lifetime of a cyclic complex, all four receptor kinases in the complex are trapped in an activated kinase dimer state (Box VI in Figure 1). At sufficiently strong stimulation, most receptors are trapped in the active tetrameric conformation (Figure 4), leading to maximal receptor phosphorylation (Figure 5).
Effect of inhibiting ectodomain-ectodomain or cytosolic domain interactions
In Figure 7A, we compared steady-state receptor phosphorylation for two cases where interaction via the ectodomain were allowed or prohibited in the model. The results indicate that ectodomain-ectodomain interaction (and receptor predimerization) is important: phosphorylation is greatly reduced when ectodomain-mediated interactions are prohibited. In the model, ectodomain-mediated crosslinking is necessary for formation of the cyclic complex (Figure 1, Box VI). When this crosslinking is abrogated, the model predicts complete abrogation of tetramer formation, and an insignificant amount of dimer formation via the cytosolic domain crosslinking across all ligand concentrations considered (Figure 7B).
Figure 7.
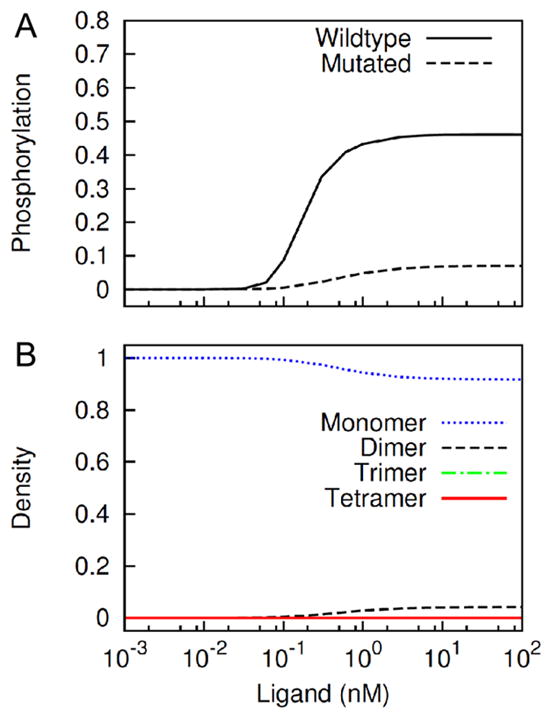
Model prediction of EGFR phosphorylation when an ectodomain mutation abrogates ectodomain-ectodomain interaction. (A) Receptor phosphorylation in the wildtype case (solid line) and ectodomain-mutated case (dashed line) at different levels of stimulation are compared. The y-axis represents values normalized by the total amount of receptor in the model. (B) Concentrations of monomeric, dimeric, trimeric and tetrameric receptor clusters in the ectodomain-mutated case are plotted as function of ligand dose. Plots are similar to those in Figure 6B.
It should be noted that receptor phosphorylation in our model does not necessarily require a cyclic complex or receptor tetramer. The minimal signaling unit in the model is a receptor dimer formed through association of the active kinase domains (Figure 1, Box VII). The cyclic tetramer does not actively mediate receptor activation, but it does promote phosphorylation by stabilizing the already activated kinases and co-localizing the kinases with their substrates (tyrosines of adjacent receptors). To further elucidate this effect, we compared relative levels of kinase availability via the conformational modification and kinase-kinase interaction when the ectodomain-ectodomain interaction is allowed or prohibited (Figure 8). The results suggest that the net kinase availability to participate in cytosolic domain-cytosolic domain interactions is slightly reduced (Figure 8A), whereas cytosolic contact between activated receptors is greatly compromised as a result of the mutation (Figure 8B).
Figure 8.
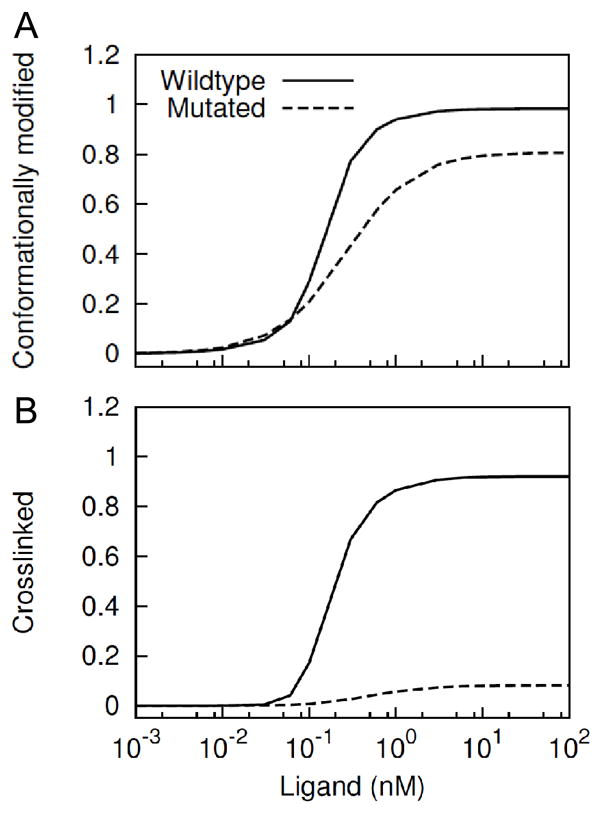
Model prediction of kinase conformation and cytosolic domain crosslinking when an ectodomain mutation abrogates ectodomain-ectodomain interaction. (A) Relative amount of EGFR available through conformational modification in the wildtype and ectodomain-mutated cases are compared. (B) Relative amount of conformationally modified EGFR crosslinked via the cytosolic domain in the wildtype and ectodomain-mutated cases are compared. The y-axis represents the normalized value with respect to total receptor concentration.
Another means to inhibit cyclic complex formation would be to inhibit the cytosolic kinase domain interactions (Figure 9). As expected, inhibiting the formation of a kinase dimer prevents kinase activation, receptor phosphorylation and formation of higher-order oligomers (Figure 9A). Under such conditions, however, a significant amount of receptor dimers may form via ectodomain-ectodomain interactions (Figure 9B).
Figure 9.
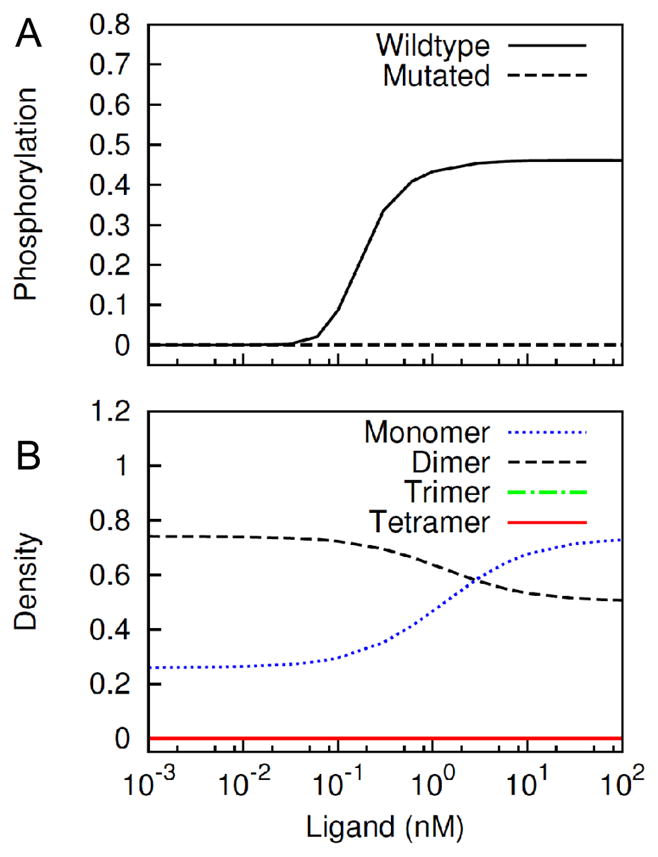
Predicted effects of abrogating cytosolic domain-cytosolic domain interaction. We consider a mutation in the kinase domain that blocks kinase-kinase interaction. (A) Steady-state receptor phosphorylation in the wildtype case (solid line) and the mutated case (dashed line) at different EGF levels is compared. (B) Concentrations of monomeric, dimeric, trimeric and tetrameric receptor clusters in the mutated case are plotted as a function of ligand dose.
Discussion
Our aim was to explore the relationship between higher-order EGFR oligomers and phosphorylation using a combination of biophysics, biochemistry, and modelling. Our approach was to use stably-transfected clonal cells that express a high level of unliganded pre-formed dimers (>93% (8, 18)), a biophysical approach well-suited to examining aggregation on the cell surface (8, 18, 21); conditions where EGFR was maintained at the cell surface and could be phosphorylated upon addition of ligand (15, 19); and a rule-based modelling approach that can deal with the combinatorially-complex nature of higher-order oligomerisation processes (42).
The key findings from this work were (i) EGF addition led to rapid increases in higher-order oligomers and phosphorylation of the EGFR and (ii) ligand-induced higher-order oligomerisation was positively correlated with increases in total EGFR phosphorylation, and (iii) in the context of a monomer-dimer-trimer-tetramer model, phosphorylated tetramers were predicted to be the dominant species associated with ligand-activated EGFR.
Our combined experimental and theoretical results strongly suggest that tetramerisation contributes to stabilisation of EGFR phosphorylation. The reason is that a cyclic tetramer composed of two side-by-side dimers is more stable than a linear head-to-tail tetramer or any other linear oligomer because two bonds must break in sequence for the cyclic tetramer to fall apart (vs. just one for a linear oligomer). In addition, in a tetramer, there is at least one dimer with an activated kinase, and usually two.
The key assumption of our model is that higher-order oligomers emerge from the presence of ectodomain-ectodomain and kinase-kinase interactions. Structural studies have provided evidence for ectodomain-ectodomain interactions (36) and kinase domain-kinase domain interactions (54), which are stabilised by juxtamembrane domain-kinase domain interactions (55). For the isolated receptor fragments these interactions give rise to dimers only, because the interaction stoichiometry is 1:1. However, the full-length receptor is bivalent and its two dimerisation sites (interfaces) allow for the potential formation of extended linear chains of receptors, as well as cyclic aggregates, or rings of receptors. Implicit in our model is the assumption that the ectodomain and cytoplasmic domain interactions are independent. There is some structural evidence for independence of the ectodomain and kinase domain conformations from studies on nearly full-length EGFR (56, 57). We also assume that ligand binding drives a conformational change of the cytoplasmic domain of the receptor that exposes an intracellular dimerisation interface and thereby enables intracellular dimerisation, receptor kinase activation and phosphorylation. This assumption is not inconsistent with rotational twist models of EGFR activation (8) where ligand binding re-orients pre-formed dimers or heterodimers (58). This assumption is required to enable the ligand-induced formation of tetramers and to prevent the spontaneous formation of oligomers (and perhaps kinase activation), independent of ligand binding. Our model assumes that ligand binding is a prerequisite for kinase-kinase interaction. At normal levels of expression, the level of ligand-free higher-order oligomers is expected to be minimal and the observed phosphorylation is also negligable.
Our model is incomplete, in the sense that it does not explicitly include every conformation and complex identified from structural studies. The transmembrane region, which undergoes a conformational transition with ligand stimulation (59), was not included in the model. We have also not taken into account the membrane (60) or membrane composition. Thus, the parameters derived from fitting can be considered “dressed” parameters which may vary with membrane composition or cell type. The tethered and untethered ectodomain conformations, as well as the symmetric inactive kinase dimer structure are omitted from the current model. We have also omitted cyclic dimers from the spectrum of allowed oligomeric species. Here, by cyclic dimer, we mean a dimer formed through bivalent association of one monomer with another, i.e., a dimer resulting from two-point association of two EGFRs. Because there is no free ectodomain or cytosolic interface in a cyclic dimer, a cyclic dimer cannot participate in higher-order oligomerisation. Because we do observe higher-order clustering in the presence of ligand, any cyclic dimer must be unstable. As more structural, thermodynamic and kinetic experimental data emerges, we will be able to readily adapt our model to incorporate new mechanistic insights within the rule-based scheme.
With our current model, we can rationalise the results of a number of studies obtained using different biochemical and biophysical techniques. In our previous study of HEK293 cells (20), we determined that the cluster size ratio of phosphorylated to non-phosphorylated EGFR was ~4. Simulations of our model at high EGF concentration indicate that phosphorylated tetramers and unphosphorylated monomers are the major species at long times, which yields a predicted cluster size ratio of 4, in excellent agreement with experiment. At lower EGF concentrations, however, our simulations indicate a lower amount of tetramers relative to monomers and dimers. This behavior might partially explain why clusters observed in single-molecule studies appeared to be smaller (<3 receptors per cluster) at the lower EGF concentrations employed (21). Incidentally, in these single-molecule studies, dynamic clustering was observed to amplify signals from the EGFR through a transactivation mechanism, which is consistent with our model.
Our model also makes predictions about effects of destabilising ectodomain-ectodomain interactions on EGFR phosphorylation. Because the phosphorylated tetramer is stabilised by both ectodomain-ectodomain and kinase-kinase interactions, preventing the ectodomain contact is predicted to cause a loss in phosphorylation. Indeed, mutations in the back-to-back dimer interface do cause changes to EGFR activation and signalling (26). Similarly, preventing the intracellular contact between the kinase domains is predicted to compromise activation and higher-order oligomerisation. There seems to be some evidence for this behavior. Hofman et al. (18) used homo-FRET to measure dimers and higher-order oligomers and loss of the higher-order oligomers upon mutation of the kinase domain and the cytoplasmic tail of the EGFR. In addition, blocking the side-by-side erbB2-erbB3 hetero-tetramer (presumably a cyclic oligomer) causes selective inhibition of phosphorylation and MAPK activation (22).
Studies from other laboratories also predict that receptor clustering can alter the activation of receptors in space and time. Reaction-diffusion calculations suggest that the phosphorylation response of tyrosine kinase receptors depends on cluster size and the type of kinase-phosphatase cycle (61). Large clusters can produce phosphorylation hotspots in the membrane that are sustained for long periods, whereas smaller clusters are phosphorylated and de-phosphorylated more rapidly. Other studies have pointed to the role of clustering of activated EGFR dimers as affecting cytoplasmic protein recruitment and hence signaling outcomes (52, 62). Clustering can increase the probability that cytoplasmic receptor-interacting adaptors or effectors will rebind after dissociating from a receptor, as a consequence of slow diffusion and the non-uniform distribution of receptors brought about by clustering. An adaptor or effector can either dissociate and move into the cytoplasm, rebind to the same receptor, or bind to another nearby receptor in a cluster with its previous binding partner.
Our studies reveal receptor associations based on spatial correlation with limited resolution (250 nm), but do not address the forces responsible for the observed clustering. Therefore we cannot strictly distinguish between oligomerisation from direct contact of two or more EGFR-eGFP dimers or two dimers that are corralled into a membrane microdomain (lipid raft or cytoskeleton picket fence). The reduction in the standard error (Table 2) in the cluster density with increasing EGF suggests that the liganded EGFR-eGFP might be trapped in cell surface domains that are at an average density that is common to all BaF/3 cells. This trapping would be expected to facilitate clustering on the nanoscale as revealed by our previous ligand FRET studies and those of others (ca. 4 nm approach between dimers, see (10, 11)). An alternative explanation for the decrease in standard deviation is that the EGF-induced clustering of EGFR-eGFP dimers is governed by mass action and is dependent on cell-surface expression. Cells that contained more receptors in the absence of EGF (high initial CD) are more effectively clustered in the presence of EGF and hence undergo a large change from high CD to low CD. Cells that contain less receptor in the absence of EGF (low CD) are not as effectively clustered in the presence of EGF (CD remains low).
The EGFR clustering experiments were performed under non-physiological conditions (room temperature and in the presence of PAO) and therefore we cannot rule out that this has an effect on our results. The use of lower temperatures and PAO could potentially affect membrane and cytoskeletal interactions which in turn affect EGFR clustering and activation. However the available data suggests that these effects have a modest influence on EGFR. Petersen and co-workers observed a negligible increase (<10%) in average EGFR cluster size when A431 cells were cooled from physiological temperature (37 °C) to room temperature (23 °C) (63). With regard to PAO effects, our previous ICS studies on BaF/3 cells determined a cluster size of 2.2 EGFRs per cluster (10) in the presence of PAO which is within experimental error of the cluster size of 1.9 EGFRs per cluster in the absence of PAO (based on 95% dimerisation from homo-FRET studies (25)). PAO being a phosphatase inhibitor has previously been shown to modulate phosphorylation of EGFR causing complete phosphorylation in the absence of added EGF in MCF7 cancer cells transiently transfected with 500,000 EGFR-eGFP per cell (30). Because high levels of EGFR expression can lead to ligand-independent kinase activation (64), and many cancer cells secrete ligands that activate receptors these results show that EGFR is under tonic suppression by phosphatases in these cells (30). In our EGFR-eGFP/BaF/3 system the EGFR-eGFP is expressed at normal levels and is kinase-inactive in the absence of ligand (10). In this case, PAO does not increase phosphorylation in the absence of EGF. As shown previously in HEK cells where EGFR-eGFP is expressed at physiological levels (20), PAO (at the levels we use) appears to allow normal EGF-dependent phosphorylation to occur in our BaF/3 cell system, as revealed by our time-course and ligand dose-response experiments.
To conclude, we have demonstrated that clustering beyond the level of dimers correlates positively with EGFR phosphorylation. Further studies are needed to test and validate the mechanisms of EGFR oligomerization, activation, and stabilisation of phosphorylation that are incorporated in our model. Although the model proposed here for explaining the correlation between receptor clustering and phosphorylation is consistent with our data as well as various other data reported in the literature, there are alternative mechanisms that could potentially generate EGFR oligomers, such as head-to-head ectodomain interactions in concert with back-to-back ectodomain interactions (65) and crosslinking of phosphorylated receptors by cytosolic signaling proteins or complexes, such as GRB2-SOS1-GRB2 complexes. These ternary complexes, which each bear two SH2 domains, one from each GRB2 adaptor, mediate clustering of the transmembrane adaptor protein LAT (linker for activation of T cells) in immune cells (66). Another promising area for future study is the potential effect of EGFR oligomerisation on adaptor binding (and rebinding) to EGFR (62).
Supplementary Material
Abbreviations
- wt (EGFR)
Epidermal Growth Factor Receptor
- mAb
monoclonal Antibody
- ICS
Image Correlation Spectroscopy
- eGFP
enhanced Green Fluorescent Protein
- ODE
ordinary differential equation
Footnotes
This work was partially supported by Australian NHMRC Project Grant no. 433624, NIH grant P50 GM085273, and DOE contract DE-AC52-06NA25396.
Electronic supplementary information (ESI) available: Table S1, Table S2, Figure S1, Figure S2, Figure S3, and Figure S4 (combined in a single .pdf file), Appendix S1 (a .pdf file), and File S1 (a plaintext file).
References
- 1.Blume-Jensen P, Hunter T. Oncogenic kinase signalling. Nature. 2001;411:355–365. doi: 10.1038/35077225. [DOI] [PubMed] [Google Scholar]
- 2.Citri A, Yarden Y. EGF-ERBB signalling: towards the systems level. Nat Rev Mol Cell Biol. 2006;7:505–516. doi: 10.1038/nrm1962. [DOI] [PubMed] [Google Scholar]
- 3.Lemmon MA, Schlessinger J. Cell signaling by receptor tyrosine kinases. Cell. 2010;141:1117–1134. doi: 10.1016/j.cell.2010.06.011. [DOI] [PMC free article] [PubMed] [Google Scholar]
- 4.Yarden Y, Schlessinger J. Self-phosphorylation of epidermal growth factor receptor: evidence for a model of intermolecular allosteric activation. Biochemistry. 1987;26:1434–1442. doi: 10.1021/bi00379a034. [DOI] [PubMed] [Google Scholar]
- 5.Moriki T, Maruyama H, Maruyama IN. Activation of preformed EGF receptor dimers by ligand-induced rotation of the transmembrane domain. J Mol Biol. 2001;311:1011–1026. doi: 10.1006/jmbi.2001.4923. [DOI] [PubMed] [Google Scholar]
- 6.Zhang X, Gureasko J, Shen K, Cole PA, Kuriyan J. An allosteric mechanism for activation of the kinase domain of epidermal growth factor receptor. Cell. 2006;125:1137–1149. doi: 10.1016/j.cell.2006.05.013. [DOI] [PubMed] [Google Scholar]
- 7.Liu P, Sudhaharan T, Koh RM, Hwang LC, Ahmed S, Maruyama IN, Wohland T. Investigation of the dimerization of proteins from the epidermal growth factor receptor family by single wavelength fluorescence cross-correlation spectroscopy. Biophys J. 2007;93:684–698. doi: 10.1529/biophysj.106.102087. [DOI] [PMC free article] [PubMed] [Google Scholar]
- 8.Gadella TW, Jr, Jovin TM. Oligomerization of epidermal growth factor receptors on A431 cells studied by time-resolved fluorescence imaging microscopy. A stereochemical model for tyrosine kinase receptor activation. J Cell Biol. 1995;129:1543–1558. doi: 10.1083/jcb.129.6.1543. [DOI] [PMC free article] [PubMed] [Google Scholar]
- 9.Martin-Fernandez M, Clarke DT, Tobin MJ, Jones SV, Jones GR. Preformed oligomeric epidermal growth factor receptors undergo an ectodomain structure change during signaling. Biophys J. 2002;82:2415–2427. doi: 10.1016/S0006-3495(02)75585-9. [DOI] [PMC free article] [PubMed] [Google Scholar]
- 10.Clayton AH, Walker F, Orchard SG, Henderson C, Fuchs D, Rothacker J, Nice EC, Burgess AW. Ligand-induced dimer-tetramer transition during the activation of the cell surface epidermal growth factor receptor-A multidimensional microscopy analysis. J Biol Chem. 2005;280:30392–30399. doi: 10.1074/jbc.M504770200. [DOI] [PubMed] [Google Scholar]
- 11.Whitson KB, Beechem JM, Beth AH, Staros JV. Preparation and characterization of Alexa Fluor 594-labeled epidermal growth factor for fluorescence resonance energy transfer studies: application to the epidermal growth factor receptor. Anal Biochem. 2004;324:227–236. doi: 10.1016/j.ab.2003.09.023. [DOI] [PubMed] [Google Scholar]
- 12.Webb SE, Roberts SK, Needham SR, Tynan CJ, Rolfe DJ, Winn MD, Clarke DT, Barraclough R, Martin-Fernandez ML. Single-molecule imaging and fluorescence lifetime imaging microscopy show different structures for high- and low-affinity epidermal growth factor receptors in A431 cells. Biophys J. 2008;94:803–819. doi: 10.1529/biophysj.107.112623. [DOI] [PMC free article] [PubMed] [Google Scholar]
- 13.Nagy P, Jenei A, Kirsch AK, Szollosi J, Damjanovich S, Jovin TM. Activation-dependent clustering of the erbB2 receptor tyrosine kinase detected by scanning near-field optical microscopy. J Cell Sci. 1999;112(Pt 11):1733–1741. doi: 10.1242/jcs.112.11.1733. [DOI] [PubMed] [Google Scholar]
- 14.Park E, Baron R, Landgraf R. Higher-order association states of cellular ERBB3 probed with photo-cross-linkable aptamers. Biochemistry. 2008;47:11992–12005. doi: 10.1021/bi8004208. [DOI] [PMC free article] [PubMed] [Google Scholar]
- 15.Schlessinger J. Cell signaling by receptor tyrosine kinases. Cell. 2000;103:211–225. doi: 10.1016/s0092-8674(00)00114-8. [DOI] [PubMed] [Google Scholar]
- 16.Huang GC, Ouyang X, Epstein RJ. Proxy activation of protein ErbB2 by heterologous ligands implies a heterotetrameric mode of receptor tyrosine kinase interaction. Biochem J. 1998;331(Pt 1):113–119. doi: 10.1042/bj3310113. [DOI] [PMC free article] [PubMed] [Google Scholar]
- 17.Furuuchi K, Berezov A, Kumagai T, Greene MI. Targeted antireceptor therapy with monoclonal antibodies leads to the formation of inactivated tetrameric forms of ErbB receptors. J Immunol. 2007;178:1021–1029. doi: 10.4049/jimmunol.178.2.1021. [DOI] [PubMed] [Google Scholar]
- 18.Hofman EG, Bader AN, Voortman J, van den Heuvel DJ, Sigismund S, Verkleij AJ, Gerritsen HC, van Bergen en Henegouwen PM. Ligand-induced EGF receptor oligomerization is kinase-dependent and enhances internalization. J Biol Chem. 2010;285:39481–39489. doi: 10.1074/jbc.M110.164731. [DOI] [PMC free article] [PubMed] [Google Scholar]
- 19.Ariotti N, Liang H, Xu Y, Zhang Y, Yonekubo Y, Inder K, Du G, Parton RG, Hancock JF, Plowman SJ. Epidermal growth factor receptor activation remodels the plasma membrane lipid environment to induce nanocluster formation. Mol Cell Biol. 2010;30:3795–3804. doi: 10.1128/MCB.01615-09. [DOI] [PMC free article] [PubMed] [Google Scholar]
- 20.Clayton AH, Orchard SG, Nice EC, Posner RG, Burgess AW. Predominance of activated EGFR higher-order oligomers on the cell surface. Growth Factors. 2008;26:316–324. doi: 10.1080/08977190802442187. [DOI] [PubMed] [Google Scholar]
- 21.Ichinose J, Murata M, Yanagida T, Sako Y. EGF signalling amplification induced by dynamic clustering of EGFR. Biochem Biophys Res Commun. 2004;324:1143–1149. doi: 10.1016/j.bbrc.2004.09.173. [DOI] [PubMed] [Google Scholar]
- 22.Zhang Q, Park E, Kani K, Landgraf R. Functional isolation of activated and unilaterally phosphorylated heterodimers of ERBB2 and ERBB3 as scaffolds in ligand-dependent signaling. Proc Natl Acad Sci U S A. 2012;109:13237–13242. doi: 10.1073/pnas.1200105109. [DOI] [PMC free article] [PubMed] [Google Scholar]
- 23.Cairo CW. Signaling by committee: receptor clusters determine pathways of cellular activation. ACS Chem Biol. 2007;2:652–655. doi: 10.1021/cb700214x. [DOI] [PubMed] [Google Scholar]
- 24.Stein E, Lane AA, Cerretti DP, Schoecklmann HO, Schroff AD, Van Etten RL, Daniel TO. Eph receptors discriminate specific ligand oligomers to determine alternative signaling complexes, attachment, and assembly responses. Genes Dev. 1998;12:667–678. doi: 10.1101/gad.12.5.667. [DOI] [PMC free article] [PubMed] [Google Scholar]
- 25.Kozer N, Kelly MP, Orchard S, Burgess AW, Scott AM, Clayton AH. Differential and synergistic effects of epidermal growth factor receptor antibodies on unliganded ErbB dimers and oligomers. Biochemistry. 2011;50:3581–3590. doi: 10.1021/bi101785h. [DOI] [PubMed] [Google Scholar]
- 26.Walker F, Orchard SG, Jorissen RN, Hall NE, Zhang HH, Hoyne PA, Adams TE, Johns TG, Ward C, Garrett TP, Zhu HJ, Nerrie M, Scott AM, Nice EC, Burgess AW. CR1/CR2 interactions modulate the functions of the cell surface epidermal growth factor receptor. J Biol Chem. 2004;279:22387–22398. doi: 10.1074/jbc.M401244200. [DOI] [PubMed] [Google Scholar]
- 27.Knutson VP, Ronnett GV, Lane MD. Rapid, reversible internalization of cell surface insulin receptors. Correlation with insulin-induced down-regulation. J Biol Chem. 1983;258:12139–12142. [PubMed] [Google Scholar]
- 28.Hertel C, Coulter SJ, Perkins JP. A comparison of catecholamine-induced internalization of beta-adrenergic receptors and receptor-mediated endocytosis of epidermal growth factor in human astrocytoma cells. Inhibition by phenylarsine oxide. J Biol Chem. 1985;260:12547–12553. [PubMed] [Google Scholar]
- 29.Grecco HE, Roda-Navarro P, Girod A, Hou J, Frahm T, Truxius DC, Pepperkok R, Squire A, Bastiaens PI. In situ analysis of tyrosine phosphorylation networks by FLIM on cell arrays. Nat Methods. 2010;7:467–472. doi: 10.1038/nmeth.1458. [DOI] [PubMed] [Google Scholar]
- 30.Verveer PJ, Wouters FS, Reynolds AR, Bastiaens PI. Quantitative imaging of lateral ErbB1 receptor signal propagation in the plasma membrane. Science. 2000;290:1567–1570. doi: 10.1126/science.290.5496.1567. [DOI] [PubMed] [Google Scholar]
- 31.Chung I, Akita R, Vandlen R, Toomre D, Schlessinger J, Mellman I. Spatial control of EGF receptor activation by reversible dimerization on living cells. Nature. 2010;464:783–787. doi: 10.1038/nature08827. [DOI] [PubMed] [Google Scholar]
- 32.Burgess AW, Lloyd CJ, Nice EC. Murine epidermal growth factor: heterogeneity on high resolution ion-exchange chromatography. Embo J. 1983;2:2065–2069. doi: 10.1002/j.1460-2075.1983.tb01701.x. [DOI] [PMC free article] [PubMed] [Google Scholar]
- 33.Petersen NO, Brown C, Kaminski A, Rocheleau J, Srivastava M, Wiseman PW. Analysis of membrane protein cluster densities and sizes in situ by image correlation spectroscopy. Faraday discussions. 1998:289–305. doi: 10.1039/a806677i. discussion 331–243. [DOI] [PubMed] [Google Scholar]
- 34.Macdonald JL, Pike LJ. Heterogeneity in EGF-binding affinities arises from negative cooperativity in an aggregating system. Proc Natl Acad Sci U S A. 2008;105:112–117. doi: 10.1073/pnas.0707080105. [DOI] [PMC free article] [PubMed] [Google Scholar]
- 35.Bublil EM, Pines G, Patel G, Fruhwirth G, Ng T, Yarden Y. Kinase-mediated quasi-dimers of EGFR. FASEB J. 2010;24:4744–4755. doi: 10.1096/fj.10-166199. [DOI] [PMC free article] [PubMed] [Google Scholar]
- 36.Garrett TP, McKern NM, Lou M, Elleman TC, Adams TE, Lovrecz GO, Zhu HJ, Walker F, Frenkel MJ, Hoyne PA, Jorissen RN, Nice EC, Burgess AW, Ward CW. Crystal structure of a truncated epidermal growth factor receptor extracellular domain bound to transforming growth factor alpha. Cell. 2002;110:763–773. doi: 10.1016/s0092-8674(02)00940-6. [DOI] [PubMed] [Google Scholar]
- 37.Ogiso H, Ishitani R, Nureki O, Fukai S, Yamanaka M, Kim JH, Saito K, Sakamoto A, Inoue M, Shirouzu M, Yokoyama S. Crystal structure of the complex of human epidermal growth factor and receptor extracellular domains. Cell. 2002;110:775–787. doi: 10.1016/s0092-8674(02)00963-7. [DOI] [PubMed] [Google Scholar]
- 38.Wofsy C, Goldstein B, Lund K, Wiley HS. Implications of epidermal growth factor (EGF) induced egf receptor aggregation. Biophys J. 1992;63:98–110. doi: 10.1016/S0006-3495(92)81572-2. [DOI] [PMC free article] [PubMed] [Google Scholar]
- 39.Ozcan F, Klein P, Lemmon MA, Lax I, Schlessinger J. On the nature of low- and high-affinity EGF receptors on living cells. Proc Natl Acad Sci U S A. 2006;103:5735–5740. doi: 10.1073/pnas.0601469103. [DOI] [PMC free article] [PubMed] [Google Scholar]
- 40.Honegger AM, Schmidt A, Ullrich A, Schlessinger J. Evidence for epidermal growth factor (EGF)-induced intermolecular autophosphorylation of the EGF receptors in living cells. Mol Cell Biol. 1990;10:4035–4044. doi: 10.1128/mcb.10.8.4035. [DOI] [PMC free article] [PubMed] [Google Scholar]
- 41.Saffarian S, Li Y, Elson EL, Pike LJ. Oligomerization of the EGF receptor investigated by live cell fluorescence intensity distribution analysis. Biophys J. 2007;93:1021–1031. doi: 10.1529/biophysj.107.105494. [DOI] [PMC free article] [PubMed] [Google Scholar]
- 42.Hlavacek WS, Faeder JR, Blinov ML, Posner RG, Hucka M, Fontana W. Rules for modeling signal-transduction systems. Sci STKE. 2006;2006:re6. doi: 10.1126/stke.3442006re6. [DOI] [PubMed] [Google Scholar]
- 43.Faeder JR, Blinov ML, Goldstein B, Hlavacek WS. Combinatorial complexity and dynamical restriction of network flows in signal transduction. Syst Biol (Stevenage) 2005;2:5–15. doi: 10.1049/sb:20045031. [DOI] [PubMed] [Google Scholar]
- 44.Faeder JR, Blinov ML, Hlavacek WS. Rule-based modeling of biochemical systems with BioNetGen. Methods Mol Biol. 2009;500:113–167. doi: 10.1007/978-1-59745-525-1_5. [DOI] [PubMed] [Google Scholar]
- 45.Hindmarsh AC, Brown PN, Grant KE, Lee SL, Serban R, Shumaker DE, Woodward CS. SUNDIALS: Suite of nonlinear and differential/algebraic equation solvers. Acm T Math Software. 2005;31:363–396. [Google Scholar]
- 46.Low-Nam ST, Lidke KA, Cutler PJ, Roovers RC, van Bergen en Henegouwen PM, Wilson BS, Lidke DS. ErbB1 dimerization is promoted by domain co-confinement and stabilized by ligand binding. Nat Struct Mol Biol. 2011;18:1244–1249. doi: 10.1038/nsmb.2135. [DOI] [PMC free article] [PubMed] [Google Scholar]
- 47.Elleman TC, Domagala T, McKern NM, Nerrie M, Lonnqvist B, Adams TE, Lewis J, Lovrecz GO, Hoyne PA, Richards KM, Howlett GJ, Rothacker J, Jorissen RN, Lou M, Garrett TP, Burgess AW, Nice EC, Ward CW. Identification of a determinant of epidermal growth factor receptor ligand-binding specificity using a truncated, high-affinity form of the ectodomain. Biochemistry. 2001;40:8930–8939. doi: 10.1021/bi010037b. [DOI] [PubMed] [Google Scholar]
- 48.Kleiman LB, Maiwald T, Conzelmann H, Lauffenburger DA, Sorger PK. Rapid phospho-turnover by receptor tyrosine kinases impacts downstream signaling and drug binding. Molecular cell. 2011;43:723–737. doi: 10.1016/j.molcel.2011.07.014. [DOI] [PMC free article] [PubMed] [Google Scholar]
- 49.Eydgahi H, Chen WW, Muhlich JL, Vitkup D, Tsitsiklis JN, Sorger PK. Properties of cell death models calibrated and compared using Bayesian approaches. Molecular Systems Biology. 2013;9 doi: 10.1038/msb.2012.69. [DOI] [PMC free article] [PubMed] [Google Scholar]
- 50.Klinke DJ., 2nd An empirical Bayesian approach for model-based inference of cellular signaling networks. BMC Bioinformatics. 2009;10:371. doi: 10.1186/1471-2105-10-371. [DOI] [PMC free article] [PubMed] [Google Scholar]
- 51.Klinke DJ, Cheng N, Chambers E. Quantifying Crosstalk Among Interferon-gamma, Interleukin-12, and Tumor Necrosis Factor Signaling Pathways Within a T(H)1 Cell Model. Science Signaling. 2012;5 doi: 10.1126/scisignal.2002657. [DOI] [PMC free article] [PubMed] [Google Scholar]
- 52.Hsieh MY, Yang S, Raymond-Stinz MA, Edwards JS, Wilson BS. Spatio-temporal modeling of signaling protein recruitment to EGFR. BMC Syst Biol. 2010;4:57. doi: 10.1186/1752-0509-4-57. [DOI] [PMC free article] [PubMed] [Google Scholar]
- 53.Itoh RE, Kurokawa K, Fujioka A, Sharma A, Mayer BJ, Matsuda M. A FRET-based probe for epidermal growth factor receptor bound non-covalently to a pair of synthetic amphipathic helixes. Exp Cell Res. 2005;307:142–152. doi: 10.1016/j.yexcr.2005.02.026. [DOI] [PubMed] [Google Scholar]
- 54.Jura N, Endres NF, Engel K, Deindl S, Das R, Lamers MH, Wemmer DE, Zhang X, Kuriyan J. Mechanism for activation of the EGF receptor catalytic domain by the juxtamembrane segment. Cell. 2009;137:1293–1307. doi: 10.1016/j.cell.2009.04.025. [DOI] [PMC free article] [PubMed] [Google Scholar]
- 55.Red Brewer M, Choi SH, Alvarado D, Moravcevic K, Pozzi A, Lemmon MA, Carpenter G. The juxtamembrane region of the EGF receptor functions as an activation domain. Molecular cell. 2009;34:641–651. doi: 10.1016/j.molcel.2009.04.034. [DOI] [PMC free article] [PubMed] [Google Scholar]
- 56.Mi LZ, Lu C, Li Z, Nishida N, Walz T, Springer TA. Simultaneous visualization of the extracellular and cytoplasmic domains of the epidermal growth factor receptor. Nat Struct Mol Biol. 2011;18:984–989. doi: 10.1038/nsmb.2092. [DOI] [PMC free article] [PubMed] [Google Scholar]
- 57.Lu C, Mi LZ, Schurpf T, Walz T, Springer TA. Mechanisms for kinase-mediated dimerization of the EGF receptor. J Biol Chem. 2012 doi: 10.1074/jbc.M112.414391. [DOI] [PMC free article] [PubMed] [Google Scholar]
- 58.Walker F, Rothacker J, Henderson C, Nice EC, Catimel B, Zhang HH, Scott AM, Bailey MF, Orchard SG, Adams TE, Liu Z, Garrett TP, Clayton AH, Burgess AW. Ligand binding induces a conformational change in epidermal growth factor receptor dimers. Growth Factors. 2012;30:394–409. doi: 10.3109/08977194.2012.739619. [DOI] [PubMed] [Google Scholar]
- 59.Endres NF, Das R, Smith AW, Arkhipov A, Kovacs E, Huang Y, Pelton JG, Shan Y, Shaw DE, Wemmer DE, Groves JT, Kuriyan J. Conformational coupling across the plasma membrane in activation of the EGF receptor. Cell. 2013;152:543–556. doi: 10.1016/j.cell.2012.12.032. [DOI] [PMC free article] [PubMed] [Google Scholar]
- 60.Arkhipov A, Shan Y, Das R, Endres NF, Eastwood MP, Wemmer DE, Kuriyan J, Shaw DE. Architecture and membrane interactions of the EGF receptor. Cell. 2013;152:557–569. doi: 10.1016/j.cell.2012.12.030. [DOI] [PMC free article] [PubMed] [Google Scholar]
- 61.Grecco HE, Schmick M, Bastiaens PI. Signaling from the living plasma membrane. Cell. 2011;144:897–909. doi: 10.1016/j.cell.2011.01.029. [DOI] [PubMed] [Google Scholar]
- 62.Oh D, Ogiue-Ikeda M, Jadwin JA, Machida K, Mayer BJ, Yu J. Fast rebinding increases dwell time of Src homology 2 (SH2)-containing proteins near the plasma membrane. Proc Natl Acad Sci U S A. 2012;109:14024–14029. doi: 10.1073/pnas.1203397109. [DOI] [PMC free article] [PubMed] [Google Scholar]
- 63.Keating E, Nohe A, Petersen NO. Studies of distribution, location and dynamic properties of EGFR on the cell surface measured by image correlation spectroscopy. Eur Biophys J. 2008;37:469–481. doi: 10.1007/s00249-007-0239-y. [DOI] [PubMed] [Google Scholar]
- 64.Zhu HJ, Iaria J, Orchard S, Walker F, Burgess AW. Epidermal growth factor receptor: association of extracellular domain negatively regulates intracellular kinase activation in the absence of ligand. Growth Factors. 2003;21:15–30. doi: 10.1080/0897719031000096424. [DOI] [PubMed] [Google Scholar]
- 65.Kastner J, Loeffler HH, Roberts SK, Martin-Fernandez ML, Winn MD. Ectodomain orientation, conformational plasticity and oligomerization of ErbB1 receptors investigated by molecular dynamics. J Struct Biol. 2009;167:117–128. doi: 10.1016/j.jsb.2009.04.007. [DOI] [PubMed] [Google Scholar]
- 66.Houtman JC, Barda-Saad M, Samelson LE. Examining multiprotein signaling complexes from all angles. FEBS J. 2005;272:5426–5435. doi: 10.1111/j.1742-4658.2005.04972.x. [DOI] [PMC free article] [PubMed] [Google Scholar]
Associated Data
This section collects any data citations, data availability statements, or supplementary materials included in this article.