

Abstract
The Brenner hypothesis states that a congenital reduction in nephron number predisposes to adult-onset hypertension and renal failure. The reduction in nephron number induced by proportionally smaller kidney mass may predispose offspring to glomerular hyperfiltration with maturity onset obesity. Developmental cigarette smoke exposure (CSE) results in intrauterine growth retardation with a predisposition to obesity and cardiovascular disease at maturity. Utilizing a mouse model of ‘active’ developmental CSE (gestational day [GD] 1-postnatal day [PD] 21; cotinine>50 ng/mL) characterized by persistently smaller offspring with proportionally decreased kidney mass, the present study examined the impact of developmental CSE on the abundance of proteins associated with cellular metabolism in the kidney. Following cessation of CSE on PD21, kidney tissue was collected from CSE and Sham exposed pups for 2D-SDS-PAGE based proteome profiling with statistical analysis by Partial Least Squares-Discriminant Analysis (PLS-DA) with affected molecular pathways identified by Ingenuity Pathway Analysis. Proteins whose expression in the kidney were affected by developmental CSE belonged to the inflammatory disease, cell to cell signaling/interaction, lipid metabolism, small molecule biochemistry, cell cycle, respiratory disease, nucleic acid and carbohydrate metabolism networks. The present findings indicate that developmental CSE alters the kidney proteome. The companion paper details the liver proteome alterations in the same offspring.
Keywords: developmental cigarette smoke exposure, CSE, proteome, kidney
1. INTRODUCTION
Approximately 20% of women smoke throughout pregnancy (Centers for Disease Control and Prevention, 2001). Non-facilitated transfer of small molecular weight and highly water soluble components of cigarette smoke across the placenta results in exposure of the fetus to the toxic compounds contained in cigarette smoke. Cigarette smoke is a heterogenous mixture of chemical compounds including nicotine, acetone, acrolein, carbon monoxide, toxic metals (lead, arsenic, cadmium, mercury), and polycyclic aromatic hydrocarbons such as benzo(a)pyrene (Rahman and Mac Nee, 1996; Sisman et al., 2003; Kyerematen and Vesell, 1991; Shah and Helfant, 1988; Zavos, 1989; Stack and Murthy, 2010). In epidemiological studies, developmental cigarette smoke exposure is associated with numerous adverse fetal outcomes including in utero growth restriction, low birth weight, and stillbirth (March of Dimes, 2010; Centers for Disease Control and Prevention. 2010). In rodent models, a similar host of developmental abnormalities following prenatal cigarette smoke exposure (CSE) are observed including low birth weight and functional impairments such as delayed cognitive development (Zdravkovic et al., 2005; Boadi et al., 1992; Shea and Steiner, 2008; Tomatis, 1989; Esposito et al., 2008).
Low birth weight is a risk factor for multiple maturity onset diseases including diabetes, hypertension, and cardiovascular disease (March of Dimes, 2010). Low birth weight and nephron number are linked through proportional reductions in kidney mass (Hughson et al., 2003). Both are positively associated with the development of hypertension (Abitbol and Ingelfinger, 2009). The putative link between developmental CSE and adult onset hypertension and/or cardiovascular disease may be attributed in part to mild structural dysmorphology and proportionally smaller kidney size (Czekaj et al., 2002; Nelson et al., 1999). In utero passive CSE at defined developmental windows (pre-, during, and post-organogenesis) induced growth retardation paired with increased kidney cellular apoptosis, delayed glomerular maturation, and mesenchymal histological abnormalities (Nelson et al., 1999). It remains unknown whether kidney metabolic activity contributes to the development of hypertension and chronic kidney disease in adulthood. The present study examined the impact of developmental CSE on the kidney proteome - specifically on the expression of metabolic proteins - in a mouse model of “active” CSE that results in reduced animal weight with attendant decreases in organ mass including that of the kidney.
2. MATERIALS AND METHODS
2.1 Animals
Adult C57BL/6J mice were purchased from The Jackson Laboratory (Bar Harbor, ME). Animals were housed by the University of Louisville in a dedicated room at 22°C, with a 12 hour alternating light/dark cycle, and were maintained on Purina LabDiet #5015 and water ad libitum. Timed pregnancies were obtained by overnight mating of a single mature male with two nulliparous females (plug positive designated GD0).
2.2 Cigarette Smoke Exposure Model
On GD0, mouse dams were randomly assigned to either the Sham exposure (n=9) or cigarette smoke exposure (CSE; n=9) group. Dams (and subsequent litters) were exposed to ambient air (sham-exposed controls) or cigarette smoke for 6 hours per day, seven days per week, from GD0 through PD21 as per the companion article (Canales et al., 2012).
On PD21, Sham exposed and CSE animals were euthanized by CO2 asphyxiation followed by cervical dislocation. Kidneys were dissected and immediately stored at −80°C until analysis. Kidney wet weights from the offspring utilized in this study as well as additional experimental animals were determined for a total of 18 Sham exposed and 12 CSE kidneys. A single kidney each from two pups per litter was weighed (n=9 Sham litters and 6 CSE litters). The remaining pups from each litter were followed until adulthood with assessment of cognitive function and other measures of neurodevelopment (subject of future manuscript).
2.3 Proteomics Analysis
Detailed experimental procedures are given in the companion paper relating the impact of developmental CSE on liver proteome profiles (Canales et al., 2012). In brief, kidney tissue was homogenized in 7M urea, 2M thiourea, and 40mM dithiothreitol (DTT). 400 μg of protein (Bradford assay; Bradford 1976) was separated by isoelectric focusing followed by SDS-PAGE with Coomassie Blue dye for visualization of protein spots and densitometric analysis performed with Progenesis SameSpots software (Nonlinear Dynamics; New Castle-on-Tyne, UK). Protein spots of interest were identified by LTQ-MS/MS with collision induced dissociation and MASCOT searching of the NCBInr database. A total MOWSE protein probability score greater than 100 was considered acceptable (Neuhoff et al., 1985).
Partial Least Squares-Discriminant Analysis (PASW Statistics 18) was used to describe the separation of the Sham exposed and CSE groups (Karp et al., 2005). Variable Importance in Projection (VIP) score ranking of proteins spot abundances was utilized to identify putative proteins of interest with an empirically determined cutoff point (Karp et al., 2005). Ingenuity Pathway Analysis was used to determine metabolic pathways related to proteins in the kidney whose levels were altered by developmental CSE and that were identified by PLS-DA as features describing the differences between groups (Ingenuity Systems, 2010).
3. RESULTS
3.1. Exposure Conditions and Neonatal Outcomes
The sham/cigarette smoke inhalation exposure chamber conditions and the developmental outcomes of the Sham exposed and CSE groups are identical to those in the companion paper examining the impact of developmental CSE on liver proteome profiles (Canales et al., 2012) and similar to the outcomes of our prior report establishing this model (Esposito et al., 2008). The model system employed for the current study is an “active” exposure paradigm with serum cotinine levels in the dams and pups greater than 50 ng/mL. This model exhibits a decrease in birth weight that persists through cessation of exposure at weaning on PD21 (13.2% decrease in weight of CSE offspring). Dam weights, number of pups, viability, and sex ratio were not impacted by CSE. At parturition, litters were maintained without culling or fostering.
As shown in Figure 1, offspring kidney wet weights were decreased in the CSE versus the Sham exposed groups at PD21 (p<0.01) by ~15%, similar to our previously published decrements in fetal body and brain weights in this mouse model (Esposito et al., 2008). The ratio of offspring kidney wet weight per total body weight was not impacted by developmental cigarette smoke exposure. A single kidney sample per litter from representative litters (9 Sham and 9 CSE) was utilized for proteome profiling.
Figure 1. Offspring Kidney Mass is Decreased by Developmental CSE.

Pup kidneys of C57Bl/6 mice exposed to CSE (cotinine >50 ng/mL) from GD1-PD21 were decreased in mass as compared to the kidneys of Sham (filtered air) exposed C57Bl/6 mice (p<0.01). The observed ~15% decrease in kidney mass is proportional to the reduction in birth weight and persistent decreased weight of these offspring.
3.2. Kidney Proteome Profiles
Representative 2D-SDS-PAGE gels of kidney proteins from Sham exposed and CSE offspring are shown in Figure 2. The proteins on the gels spanned an isoelectric focusing range of 3 to 10, with the acidic proteins on the left and the basic proteins on the right of the gel image, and with descending molecular weights ranging from ~80 kDa to ~11 kDa. Several protein spots were identified to validate the molecular weight range. The spot patterns of the kidney proteins from Sham exposed and CSE groups were similar with varying protein spot abundance as the predominant difference between groups.
Figure 2. Representative 2D-SDS-PAGE Gel: Protein Spot Profiles of the Kidneys from Sham and CSE Offspring.
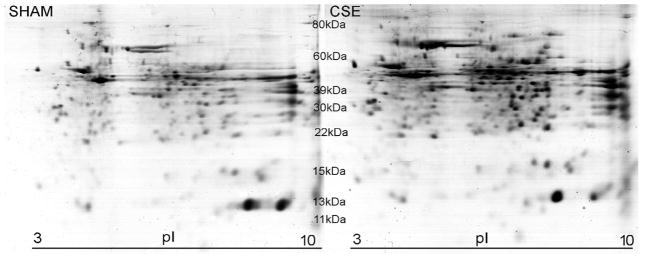
A side-by-side comparison of kidney protein spot separation based on isoelectric focusing point (horizontal) and molecular weight (vertical) in the two experimental groups (Sham-left; CSE-right). The gels are similar in number of spots without the appearance or loss of spots between experimental groups.
3.3. Partial Least Squares-Discriminant Analysis
An empirical fold change minimum (e.g.: 2-fold change) was not employed as a cutoff for determination of significance of impact of protein spot density. Rather, a ranked order of importance (Variable Import in Projection: VIP) of protein spot densities was utilized in defining the differences between groups after building a multivariate inverse least squares discriminant model to classify sample groupings. Noise, identified by a sharp increase in slope of 3-D plot of spot pixel density or an aggregate normalized pixel depth of less than 1000, was removed from the dataset prior to PLS-DA modeling. Sequential PLS-DA models were generated with the stepwise exclusion of the bottom twenty VIP ranked protein spots until a gradual loss of separation of the groups was evident in a three dimensional plot of the top 3 latent factors. Approximately 45 protein spots (VIP≥ 1.5) were found to contribute to the separation in kidney proteome profiles between the Sham exposed and CSE groups. As shown in Figure 3A, when abundances of all proteins were included (noise excluded), the first latent factor accounted for 58% of the variance between the Sham exposed and CSE groups and the second latent factor accounted for an additional 32% of the variance. As shown in Figure 3B, the proteome profiles of the Sham exposed and CSE groups are distinct. The separation between the groups is depicted by graphing latent factors 1, 2 and 3.
Figure 3.
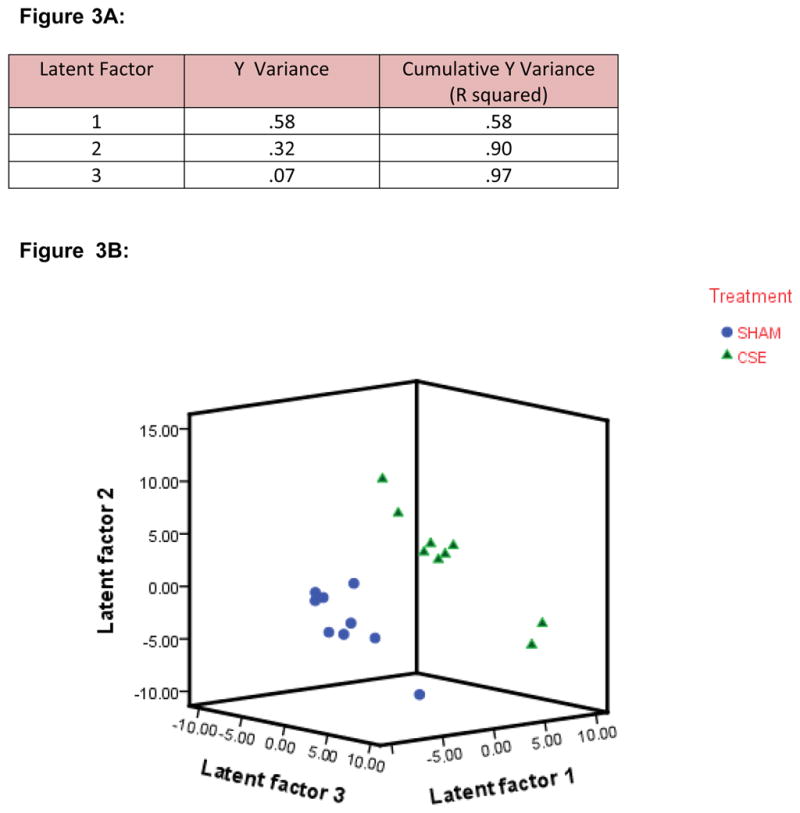
Figure 3A: Variable Importance in Projection. Protein spots present on gels from the Sham exposed and CSE groups were analyzed by PLS-DA (n=9 per group, biological replicates). Description of the separation of groups by latent factors found that 97% of the variance between groups could be described by three latent factors.
Figure 3B: Plotting Latent Factors from the PLS-DA model shows differences in the kidney protein spot patterns of the Sham exposed and CSE groups. All protein spots (excluding noise) were included in the calculation of VIP rankings and the graphing of the separation of groups by latent factors.
3.4. Proteins impacted by CSE
In Figure 4, a representative 2D-SDS-PAGE kidney protein spot map is shown with color coded numbers labeling the top 45 protein spots (based on VIP 1, 2, or 3 rankings) describing the differences between the Sham exposed and CSE kidney proteome profiles as determined by Partial Least Squares-Discriminant Analysis. The proteins with decreased abundance are labeled with a blue number, while the proteins with increased abundance are shown by a green number. The proteins (decreased and increased abundance) contributing to the separation of groups according to the PLS-DA model are listed in Table 1. For several spots, more than one protein was identified indicating that a mixture of proteins with similar isoelectric focusing point and molecular weight are present within the spot.
Figure 4. Differential Abundance of Kidney Proteins.

Protein spots with altered pixel density in the kidneys of the CSE group are outlined and numbered. Green indicates increased spot pixel density and blue indicates decreased spot pixel density in the CSE group. Refer to Table 1 for a listing of proteins identified in each spot.
Table 1. Identification of Proteins in Spots with Decreased and Increased Pixel Density that Contributed to the Separation of Sham and CSE groups (PLS-DA model).
Data corresponds to Figure 4 (numbers in blue represent spots with apparent decreased pixel density and numbers in green represents spots with apparent increased pixel density).
| Spot | ANOVA | VIP | Name | Score | Abb. Name |
|---|---|---|---|---|---|
| 1 | 0.001 | 3.46 | Aldo-keto reductase family 1, member A4 (aldehyde reductase), gi|10946870 | 671 | AKR1A1 |
| D-amino acid oxidase, gi|198572 | 138 | DAO | |||
| 2 | 0.002 | 3.32 | Aldose reductase, gi|3046247 | 477 | AKR1B1 |
| 3 | 0.019 | 2.67 | Voltage-dependent anion channel 2, gi|6755965 | 515 | VDAC2 |
| Electron transferring flavoprotein, alpha polypeptide, gi|13097375 | 384 | ETFA | |||
| 4 | 0.042 | 2.61 | Phosphoglycerate kinase, gi|202423 | 688 | PGK1 |
| Argininosuccinate synthetase 1, gi|6996911 | 672 | ASS1 | |||
| Acetyl-Coenzyme A acyltransferase 2 (mitochondrial 3-oxoacyl-Coenzyme A thiolase), gi|29126205 | 480 | ACAA2 | |||
| Acetyl-Coenzyme A acetyltransferase 1 precursor, gi|21450129 | 201 | ACAA1 | |||
| 5 | 0.036 | 2.45 | PREDICTED: similar to glyceraldehyde-3-phosphate dehydrogenase, gi|62653546 | 432 | GAPDH |
| 6 | 0.067 | 2.34 | Homogentisate 1, 2-dioxygenase, gi|37572245 | 349 | HGD |
| Hypothetical protein LOC433182, gi|55491 | 279 | - | |||
| 2-phosphopyruvate-hydratase alpha-enolase, gi|693933 | 269 | ENO1 | |||
| 7 | 0.063 | 2.34 | Acetyl-Coenzyme A acetyltransferase 1 precursor, gi|21450129 | 555 | ACAA1 |
| 8 | 0.051 | 2.27 | PREDICTED: similar to glyceraldehyde-3-phosphate dehydrogenase, gi|62653546 | 449 | GAPDH |
| 9 | 0.057 | 2.14 | Mitochondrial short-chain enoyl-coenzyme A hydratase 1, gi|12805413 | 538 | ECHS1 |
| 10 | 0.057 | 2.13 | PREDICTED: similar to glyceraldehyde-3-phosphate dehydrogenase, gi|62653546 | 432 | GAPDH |
| 11 | 0.143 | 2.10 | Peroxiredoxin 1, gi|6754976 | 460 | PRDX1 |
| rCG64140, gi|149025344 | 136 | ||||
| 12 | 0.140 | 2.04 | Glyceraldehyde-3-phosphate dehydrogenase, gi|6679937 | 486 | GAPDH |
| 13 | 0.095 | 2.02 | Aldolase B, fructose-bisphosphate, gi|21450291 | 476 | ALDOB |
| Similar to glyceraldehyde-3-phosphate dehydrogenase, gi|62653546 | 270 | GAPDH | |||
| 14 | 0.094 | 2.00 | Malate dehydrogenase 2, NAD (mitochondrial), gi|31982186 | 636 | MDH2 |
| Carbonyl reductase 1, gi|113680352 | 402 | CBR1 | |||
| Inducible carbonyl reductase, gi|1906812 | 192 | CBR1 | |||
| 15 | 0.080 | 1.93 | Mitochondrial ATP synthase beta subunit, gi|31980648 | 1121 | ATP5B |
| 16 | 0.091 | 1.65 | Acetyl-Coenzyme A acyltransferase 2 (mitochondrial 3-oxoacyl-Coenzyme A thiolase), gi|29126205 | 486 | ACAA2 |
| Argininosuccinate synthetase 1, gi|6996911 | 427 | ASS1 | |||
| 17 | 0.146 | 1.98 | Calreticulin, gi|6680836 | 314 | CALR |
| 18 | 0.217 | 1.70 | Calbindin-28K, gi|6753242 | 356 | CALB1 |
| 19 | 0.110 | 1.99 | Transferrin, gi|17046471 | 1340 | TF |
| KH-type splicing regulatory protein, gi|19424312 | 235 | KHSRP | |||
| Albumin,gi|158138568 | 165 | ALB | |||
| 20 | 0.238 | 1.60 | Eno1 protein, gi|34784434 | 311 | ENO1 |
| Hypothetical protein LOC433182, gi|70794816 | 310 | - | |||
| 21 | 0.153 | 1.82 | 3-oxoacid CoA transferase 1, gi|189181716 | 259 | OXCT1 |
| Methylmalonate-semialdehyde dehydrogenase (Aldehyde dehydrogenase family 6 member A1), gi|400269 | 226 | ALDH6A1 | |||
| 22 | 0.206 | 1.65 | Glycerol-3-phosphate dehydrogenase, gi|387177 | 404 | GPD1 |
| 23 | 0.300 | 1.51 | Citrate lyase beta like, gi|19173728 | 356 | - |
| Glucosamine-6-phosphate isomerase 1, gi|12644084 | 257 | GNPDA1 | |||
| 24 | 0.162 | 1.85 | Carbonic anhydrase II, gi|157951596 | 252 | CA2 |
| Fructose-bisphosphate aldolase B, gi|15723268 | 144 | ALDOB | |||
| 25 | 0.261 | 1.60 | Electron transferring flavoprotein, beta polypeptide, gi|38142460 | 514 | ETFB |
| 3-hydroxybutyrate dehydrogenase, type 2, gi|23956202 | 168 | BDH2 | |||
| 26 | 0.015 | 2.70 | Proteasome (prosome, macropain) subunit, alpha type 6, gi|6755198 | 230 | PSMA6 |
| 27 | 0.024 | 2.71 | ATP synthase, H+ transporting, mitochondrial F1 complex, alpha subunit, isoform 1, gi|127798841 | 558 | ATP5B |
| Glutathione peroxidase, gi|2673845 | 317 | GPX1 | |||
| Peroxiredoxin 1, gi|6754976 | 252 | PRDX1 | |||
| 28 | 0.031 | 2.58 | Cu/Zn superoxide dismutase, gi|226471 | 276 | SOD |
| 29 | 0.058 | 2.22 | ATP synthase, H+ transporting, mitochondrial F1 complex, alpha subunit, isoform 1, gi|6680748 | 303 | ATP5A1 |
| Peroxiredoxin 1, gi|6754976 | 221 | PRDX1 | |||
| 30 | 0.070 | 2.03 | Prohibitin, gi|6679299 | 623 | PHB |
| Gamma-actin, gi|809561 | 185 | ACTG1 | |||
| 31 | 0.070 | 2.26 | Not identified | - | |
| 32 | 0.081 | 2.24 | NADH-ubiquinone oxidoreductase 75 kDa subunit, gi|47117271 | 922 | NDUFS1 |
| 33 | 0.085 | 1.86 | Trypsin, gi|136429 | 129 | - |
| 34 | 0.087 | 1.73 | Albumin, gi|163310765 | 211 | ALB |
| 35 | 0.163 | 2.14 | mCG13235, gi|148684097 | 159 | - |
| PREDICTED: similar to polyubiquitin, gi|109497721 | 152 | - | |||
| 36 | 0.088 | 2.08 | Tumor metastatic process-associated protein NM23, gi|387496 | 211 | NME1 |
| 37 | 0.116 | 2.01 | Enoyl coenzyme A hydratase 1, peroxisomal, gi|7949037 | 431 | ECH1 |
| Carbonyl reductase 3, gi|27413160 | 337 | CBR3 | |||
| 3-hydroxyisobutyrate dehydrogenase precursor, gi|21704140 | 282 | HIBADH | |||
| Mercaptopyruvate sulfurtransferase, gi|63100260 | 275 | MPST | |||
| Ketohexokinase/Hepatic fructokinase, gi|6016435 | 128 | KHK | |||
| 38 | 0.101 | 1.86 | Not identified | - | |
| 39 | 0.126 | 1.85 | L-lactate dehydrogenase B, gi|6678674 | 595 | LDHB |
| Albumin, gi|163310765 | 303 | ALB | |||
| Crystallin, lambda 1, gi|19525729 | 300 | CRYL1 | |||
| Pyruvate dehydrogenase (lipoamide) beta, gi|18152793 | 278 | PDHB | |||
| Capping protein alpha 1 subunit, gi|595917 | 223 | CAPZA1 | |||
| Copper binding protein/S-adenosyl-L-homocysteine hydrolase, gi|904132 | 217 | AHCY | |||
| Protein phosphatase 1, catalytic subunit, alpha, gi|13994195 | 196 | PPP1CA | |||
| Potassium channel tetramerization domain containing 12, gi|123701966 | 170 | KCTD12 | |||
| 40 | 0.176 | 1.66 | Elongation factor 1-delta, gi|13124192 | 139 | EEF1D |
| Epsilon subunit of coatomer protein complex, gi|10946972 | 132 | COPE | |||
| 41 | 0.135 | 1.69 | Cytochrome c oxidase subunit Va preprotein, gi|50527 | 110 | COX5A |
| 42 | 0.126 | 1.74 | Glutathione peroxidase, gi|2673845 | 400 | GPX1 |
| Parkinson disease protein 7, gi|55741460 | 191 | PARK7 | |||
| 43 | 0.112 | 1.58 | Not identified | - | |
| 44 | 0.229 | 1.54 | Crystallin, alpha B, gi|6753530 | 201 | CRYAB |
| 45 | 0.251 | 1.51 | PREDICTED: similar to polyubiquitin, gi|109497721 | 144 | - |
3.5. Ingenuity Pathway Analysis
Proteins identified in spots contributing to the separation between the groups were categorized as increased or decreased in abundance in the kidney of the CSE group and imported for IPA analysis. Proteins that represent the predominant contribution to the spot intensity, as determined by a minimum of 200% of the MOWSE score of the next ranked protein identified, were included in the identification of nodes of interest within the affected networks (see Table 1). The analysis did not include proteins from Spot 4 (and similar Spots 3, 6, 13, 14, 16, 20, 21, 23, 24, 27, 35, 37, 39, 40) since the relative MOWSE scores for identification of the multiple proteins within the spot were similar and therefore a single likely candidate for alteration in abundance could not be identified. In Spot 1, this is not the case. Aldo-keto reductase family 1, member A4 is clearly the dominant protein in the spot (MOWSE score 671) while D-amino acid oxidase is present in much lower abundance (MOWSE score 138). In this case, Aldo-keto reductase family 1, member A4 was included in the IPA analysis.
In the associated figures, solid lines indicate a direct interaction while dotted lines indicate an indirect interaction. Geometric shapes identify classes of proteins: cytokines (square), growth factors (dotted square), phosphatases (triangle), kinases (inverted triangle), ligand-dependent nuclear receptors (rectangle), G-protein coupled receptors (vertical rectangle), ion channels (dotted vertical rectangle), peptidases (horizontal diamond), enzymes (vertical diamond), transcription regulators (horizontal ellipse), transmembrane receptors (vertical ellipse), transporters (trapezoid), and other important molecules (circle).
3.5.1. Proteins With Decreased Abundance in the Kidney of CSE Mice
Dominant or single proteins with decreased abundance in kidneys of CSE mice were grouped by membership in metabolic networks via IPA analysis. Proteins in Spots 1, 2, 7, 9, 18 consisting respectively of: Aldoketoreductase family 1, member A4; Aldoketoreductase family 1, member B1; Acetyl-coenzyme A acetyltransferase 1 precursor; Mitochondrial short-chain enoyl-coenzyme A hydratase 1; and Calbindin-28K are members of the lipid metabolism network. Proteins in Spots 1, 2, 7, 9, 11, 13, 14, 15, 17, 18, 19, 22, 24 consisting respectively of: Aldoketoreductase family 1, member A4; Aldoketoreductase family 1, member B1; Acetyl-coenzyme A acetyltransferase 1 precursor; Mitochondrial short-chain enoyl-coenzyme A hydratase 1; Peroxiredoxin 1; Aldolase B; Malate dehydrogenase 2; Mitochondrial ATP synthase beta subunit; Calreticulin; Calbindin-28K; Transferrin; Glycerol-3-phosphate dehydrogenase; and Carbonic anhydrase II are members of the small molecule biochemistry network.
Figure 5 depicts a portion of the lipid metabolism and small molecule biochemistry networks. Proteins with decreased abundance in the CSE group are shaded in gray. A central node in the network is Solute Carrier Family 2 (Facilitated Glucose Transporter Member 4). The following protein spots were linked to this node: Spot 7 (Acetyl-CoA acyltransferase 2), Spot 9 (Mitochondrial short-chain enoyl-coenzyme A hydratase 1), Spot 13 (Aldolase B). Spots with multiple proteins of equivalent abundance also support the designation of alteration in this pathway, although the designation of a decrease in pixel density of these spots cannot be unambiguously attributed to the specific network member protein. The following proteins are part of this network however more than one protein was present in the spots: Spot 3 (Voltage-dependent anion channel 2, Electron transfer flavoprotein alpha polypeptide); Spot 6 (Enolase 1); Spot 21 (Aldehyde dehydrogenase 6 family, member A1). Homogentisate 1, 2-dioxygenase (Spot 6) is listed in the network but not shown in the figure. For Spot 3, both proteins identified as present in the spot belong to this node. Similarly for Spot 6, two of the three proteins present were related to this node. Seven proteins present in Spots 3, 6, 7, 9 and 13 were considered supportive of the designation of a probable alteration in the SCF2 node of the lipid metabolism and small molecule biochemistry networks in kidney of CSE offspring. Though other nodes exist in this network, limited individual protein spot identifiers were linked to these nodes.
Figure 5. The Lipid Metabolism and Small Molecule Biochemistry Network of the Kidney is Impacted by Developmental CSE.

Kidney proteins identified as contributing to the separation of groups (Sham exposed and CSE) are shadowed and connected to the network by arrows denoting directionality of impact. All shadowed proteins were decreased in abundance.
Three additional networks contained proteins with decreased abundance in the kidney of CSE mice. The following proteins in Spots 2, 6, 12, 13, 15, 21, 22 of the nucleic acid metabolism network were decreased: Aldoketoreductase family 1, member B1; Homogentisate 1,2-dioxygenase; Glyceraldehyde-3-phosphate dehydrogenase; Aldolase B; Mitochondrial ATP synthase beta subunit; 3-oxoacid CoA transferase 1; and Glycerol-3-phosphate dehydrogenase. For the respiratory disease network, proteins in Spots 11, 12, 19, and 24 consisting of: Peroxiredoxin 1; Glyceraldehyde-3-phosphate dehydrogenase; Transferrin; and Carbonic Anhydrase were decreased in abundance in the kidney following developmental CSE. The inflammatory disease network possessed the following proteins with decreased abundance from Spots 1, 11, 12, 13, 17, 19, 24: Aldoketo reductase family 1, member A1; Peroxiredoxin 1; Glyceraldehyde-3-phosphate dehydrogenase; Aldolase B; Calreticulin; Transferrin; and Carbonic Anhydrase.
Figure 6 shows a portion of the inflammatory disease, respiratory disease and nucleic acid metabolism networks. The proteins identified in this network had decreased abundance in the kidney of the CSE group. Nuclear receptor subfamily 3 group C member 1 (NR3C1; glucocorticoid receptor) is a chief node in the network. The following protein spots were associated with the NR3C1 node: Spot 11 (Peroxiredoxin 1 as dominant protein); Spot 12 (Glyceraldehyde-3-phosphate dehydrogenase); Spot 17 (Calreticulin); and Spot 19 (Transferrin as dominant protein, Albumin as minor protein). Homogentisate 1, 2-dioxygenase (Spot 6) is linked to this node through Glyceraldehyde-3-phosphate dehydrogenase (Spot 12) but cannot be counted as support for the designation of an alteration in this node due to the presence of multiple proteins in Spot 12. The presence of five proteins including 3 single proteins per spot and a dominant and minor protein in a spot from Spots 11, 12, 17, and 19 indicate that the NR3C1 network node may be affected in the kidney by developmental CSE.
Figure 6. The Inflammatory Disease, Respiratory Disease and Nucleic Acid Metabolism Network of the Kidney is Impacted by Developmental CSE.

Proteins identified as contributing to the separation of groups by PLS-DA (Sham exposed and CSE) are shadowed and connected to the network by arrows denoting directionality of impact. All shadowed proteins were present in protein spots with decreased abundance.
Insulin, another central node in the inflammatory disease, respiratory disease and nucleic acid metabolism networks, is impacted in the kidney of CSE offspring. The following proteins were connected to the Insulin node: Spot 7 (Acetyl Co-A acetyltransferase 1); Spot 15 (ATP synthase, H+ transporting, mitochondrial F1); and Spot 18 (Calbindin 1, 28 kDa). Proteins from Spots 4, 14, and 19 were altered in support of the inference of an alteration in this node. However, each spot possesses multiple proteins and therefore unambiguous attribution of alterations in abundance to a single protein cannot be made. The contribution of Phosphoglycerate kinase 1 (Spot 4), Malate dehydrogenase 2, NAD mitochondrial (Spot 14), and Albumin (minor component of Spot 19) must be judged as unsubstantiated. Identification of this node as affected in the kidney by developmental CSE is primarily supported by a decreased in abundance of 3 proteins from 3 separate spots.
In summary, 15 proteins in the kidney that decreased in abundance with developmental CSE (either a single or dominant protein in a spot) were attributed to redundant membership in multiple metabolic networks. These networks possess 3 nodes that may be impacted by developmental CSE: Solute Carrier Protein 2 (GLUT4), Nuclear receptor subfamily 3 group C member 1 (NR3C1), and Insulin.
3.5.2. Proteins With Increased Abundance in the Kidney of CSE Mice
Dominant or single proteins in spots with increased abundance in kidney following developmental CSE were grouped by membership in metabolic networks via IPA analysis. The small molecule biochemistry network possessed four spots with increased pixel density (Spots 27, 32, 36, 42) with the following proteins affected: ATPs synthase, H+ transporting, mitochondrial F1 complex, alpha subunit; NADH-ubiquinone oxidoreductase 75 kDa subunit; Tumor metastatic process-associated protein NM23; and Glutathione Peroxidase. The cell to cell signaling and interaction network was also impacted with proteins from Spots 30, 34, 36, 42 possessing increased abundances in the kidney following developmental CSE. The following proteins of this network were increased in abundance: Prohibitin; Albumin; Tumor metastatic process-associated protein NM23; and Glutathione peroxidase. In summary, 5 proteins that increased in abundance with developmental CSE were attributed to redundant membership in these two metabolic networks.
Figure 7 shows the lipid metabolism, small molecule biochemistry, and carbohydrate metabolism network. The proteins shaded gray in this figure had increased abundance in the kidney of the CSE group. The Solute Carrier Family 2 (Facilitated Glucose Transporter Member 4) protein is again a central node of this network that may be impacted in the kidney by developmental CSE. Increased pixel density of three spots on the 2D gels consisting of four additional proteins in the kidney lipid metabolism, small molecule biochemistry, and carbohydrate metabolism networks connected to the SLC2A4 node further supports the impact of developmental CSE on kidney metabolic networks.
Figure 7. The Lipid Metabolism, Small Molecule Biochemistry, and Carbohydrate Metabolism Network of the Kidney is Impacted by Developmental CSE.

Proteins identified as contributing to the separation of groups by PLS-DA (Sham exposed and CSE) are shadowed and connected to the network by arrows denoting directionality of impact. All shadowed proteins were present in protein spots with increased abundance.
4. DISCUSSION
Cigarette smoke exposure impairs the function of the respiratory, digestive, urogenital, endocrine and cardiovascular systems (Doll, 1996; Hoffman and Hoffman, 1997; Nordlund et al., 1997). In adults, CSE induces kidney glomerular and proximal tubular damage, mesangial cell proliferation in the renal capsule, dilation and congestion in the peritubular capillaries, degeneration in the proximal tubules, and atrophy of the renal capsule (Chu et al., 2001; EL-safty et al., 2003; Czekaj et al., 2002; Odoni et al., 2002). Developmental CSE reduces the proximal tubule cuboidal epithelium thickness, alters the shape of the proximal and distal convoluted tubules, and yields immature glomeruli in neonates (Czekaj et al., 2002; Nelson et al., 1999).
The current study is considered an “active” cigarette smoke exposure model. Maternal cotinine levels, which are indicative of nicotine dosage were above 50 ng/mL. Pup cotinine levels were also increased to a comparable range indicative of “active” cigarette smoke exposure. This “active” CSE during pre- and post-natal development - spanning the entirety of kidney organogenesis - (Kuure et al., 2000; Ingelfinger, 2003) resulted in decreased offspring birthweight and persistent reduced weights throughout postnatal development (13.2% decrease at PD21). Together with our prior finding of decreased crown-rump length, offspring weight, and brain wet weight (Esposito et al., 2008), the reduction in kidney weight in the CSE offspring is interpreted as a proportional decrease in tissue size when normalized to offspring weight.
CSE induced low birth weight is linked to hypertension and diet induced obesity (Doherty et al., 2009; Ng et al., 2009; Oken et al., 2008; Gao et al., 2005) consistent with the Barker hypothesis (Calkins and Devaskar, 2011; Barker et al., 2009; Barker, 1992) which states that an adverse fetal environment results in low birth weight and an increased risk of maturity onset disease. The Brenner hypothesis (Brenner and Chertow; 1994) further postulates a causal association of low birth weight and hypertension. This may in part be attributed to decreased nephron number related to proportionally smaller kidney mass that results in glomerular enlargement and hyperfiltration status once mature organism weight is attained (Benz and Amman, 2010). Of note, a companion study of the liver proteome profiles of CSE offspring notes decreased expression of proteins impacted by retinoic acid availability. A mild reduction in retinoic acid availability during development has been shown to decrease nephron number (Leliever-Pegorier and Merlet-Benichou, 1998). Though nephron number was not assessed, the reduced kidney mass observed in the current study has previously been established as indicative of a reduction in nephron number (Luyckx and Brenner 2010; Xu and Zuo, 2010; Murawski et al., 2010).
Calcium signaling is essential for the conversion of the metanephric mesenchyme into a functional nephron epithelium (Gilbert et al., 2011) with the non-canonical calcium/NFAT Wnt pathway controlling tubulogenesis (Tanigawa et al., 2011; Burn et al., 2011). Calbindin 28K (Spot 18) and Calreticulin (also known as Calregulin; Spot 17) levels were identified as important in the separation of the CSE and Sham groups in the multivariate PLS-DA model with a general trend toward decreased abundance in the kidney of the CSE offspring. Calbindin 28K, a vitamin D dependent calcium binding protein, is present in the mouse metanephric duct from embryonic day 12 and in the advancing ampullae of the ureteric buds (Liu et al., 1993). In the adult, Calbindin 28K is located in the distal convoluted tubule, the connecting tubule, and in the cortical collecting duct (Roth et al., 1981). The CSE-induced decrease in kidney calcium regulatory protein abundance, which indicates a decreased number of tubule segments, is consistent with a decrease in total nephron population.
Similarly in the CSE offspring, kidney antioxidant and chaperone protein expression were altered. Spots identified as Cu/Zn Superoxide Dismutase (Spot 28; increased), Glutathione Peroxidase (Spot 42; increased), Proteasome subunit alpha type 6 (Spot 26; increased), αB-crystallin (Spot 44; increased) and Peroxiredoxin (Spot 11 decreased; also present in Spot 27 and 29 but unable to attribute increased intensity solely to this protein) were found to be important in the separation of the groups by PLS-DA. This finding likely reflects a cellular adaptive response to ongoing cigarette smoke induced oxidative stress which necessitates a scavenging of free radicals and a stabilization of protein secondary and tertiary structures. Of particular interest is the impact of CSE on kidney αB-crystallin, a small heat shock protein with structural and sequence similarity to HSP27. Though crystallins are primarily found in the ocular lens, αB-crystallin is present in extra-ocular tissues and is classified as an inducible small molecular weight chaperone. In the kidney, αB-crystallin expression increases following osmotic stress as well as with oxidative stress (Michl et al., 2006; Beck et al., 2000; Gabert and Kultz, 2011). The observed increase in stress response proteins yields a cellular phenotype that might be incapable of further responding to a secondary stress such as high fat diet. Additional studies are needed to answer whether the kidney from CSE offspring are capable of responding to the hypertonicity accompanying the induction of hypertension.
Glycolysis is a partially reversible central pathway for the catabolism of carbohydrates. In this study, two enzymes shared between the glycolytic/gluconeogenic pathways were decreased in availability: Enolase 1 and Aldolase B. Glyceraldehyde-3-phosphate dehydrogenase and Phosphoglycerate kinase 1 are glycolytic enzymes that do not participate in gluconeogenesis. The decreased abundance of these enzymes supports the interpretation of a probable decrease in glycolytic activity in the kidney of CSE offspring. A corresponding increase in protein abundance related to pyruvate metabolism may reflect a cellular requirement for additional substrate in support of gluconeogenesis or the Tricarboxylic Acid (TCA) cycle. Lactate dehydrogenase B (LDHB) and Mercaptopyruvate sulfurtransferase (MPST) generate pyruvate; Pyruvate dehydrogenase (PDBH) converts pyruvate to acetyl-CoA. However, Malate dehydrogenase, an enzyme in the TCA cycle, was decreased in abundance in the kidney of CSE offspring. Together these data support the interpretation that developmental CSE results in stimulation of gluconeogenesis coupled to limited glycolysis resulting in a deficit in energy production during of kidney development and maturation.
Ingenuity Pathway Analysis was utilized to predict kidney metabolic pathways impacted by developmental CSE. The present study found both decreased and increased abundance of proteins present as part of the lipid metabolism, small molecule biochemistry and cell cycle network with Solute Carrier Family 2 (SLC2A4; also known as Insulin Dependent Glucose Transporter Member 4, GLUT4) as a central node. SLC2A4 mediates the homeostatic transport of glucose from the blood into cell cytoplasm (Mueckler et al., 1994). Insulin, which mediates cellular uptake of glucose from the blood, was identified as a node of interest as well in both the inflammatory disease, respiratory disease and nucleic acid metabolism pathway and the lipid metabolism, small molecule biochemistry, and carbohydrate metabolism network. These findings also point to a deficit in cellular kidney glucose availability accompanying developmental CSE.
In summary, the current study examined proteome profiles from whole kidney homogenates and thus cannot directly shed light on glomerular or tubule dysfunction though the finding of smaller kidney mass indicates decreased nephron number. Developmental cigarette smoke exposure alters several metabolic networks in the kidney including the lipid metabolism, small molecule biochemistry, carbohydrate metabolism network and the inflammatory disease, respiratory disease and nucleic acid metabolism networks. In contrast to the finding of impaired gluconeogenesis in the liver of these offspring, a stimulation of kidney gluconeogenic activity was noted and may reflect a systemic lack of glucose availability. We interpret the findings of this study as an indication that continuing CSE on the background of low birth weight (LBW) leads to systemic metabolic dysregulation characterized by impaired chaperoning/antioxidant scavenging and lipid dysregulation as well as impaired glucose metabolism. The impact of CSE cannot be separated from LBW in the current model though the coupled decrease in nephron number may compromise kidney function post-cessation of exposure in adulthood or in the presence of a subsequent challenge. Whether these metabolic alterations in the kidney persist past the cessation of exposure and into maturity is the subject of future studies.
Acknowledgments
Research described in this article was supported in part by PHS grants NIH P20 RR/DE-17702, NIH P30 ES014443, NIH R21 DA027466, and the University of Louisville School of Interdisciplinary Graduate Studies-Ethnic Minority Scholarship program. We thank Dr. Bogdan Bogdanov of the University of Louisville Center for Regulatory and Environmental Analytical Metabolomics for assistance with FT-ICR-MS. We also thank Dr. Partha Mukhopadhyay for assistance with Ingenuity Pathway Analysis, Cynthia Webb for the maintenance of the Teague exposure system, and Elizabeth Kelty for assistance with manuscript preparation.
Footnotes
Publisher's Disclaimer: This is a PDF file of an unedited manuscript that has been accepted for publication. As a service to our customers we are providing this early version of the manuscript. The manuscript will undergo copyediting, typesetting, and review of the resulting proof before it is published in its final citable form. Please note that during the production process errors may be discovered which could affect the content, and all legal disclaimers that apply to the journal pertain.
References
- Abitbol CL, Ingelfinger JR. Nephron mass and cardiovascular and renal disease risks. Semin Nephrol. 2009;29(4):445–54. doi: 10.1016/j.semnephrol.2009.03.019. [DOI] [PubMed] [Google Scholar]
- Barker DJ. Fetal growth and adult disease. Br J Obstet Gynaecol. 1992;99:275–6. doi: 10.1111/j.1471-0528.1992.tb13719.x. [DOI] [PubMed] [Google Scholar]
- Barker DJ, Osmond C, Kajantie E, Eriksson JG. Growth and chronic disease: findings in the Helsinki Birth Cohort. Ann Hum Biol. 2009;36:445–58. doi: 10.1080/03014460902980295. [DOI] [PubMed] [Google Scholar]
- Beck FX, Grünbein R, Lugmayr K, Neuhofer W. Heat shock proteins and the cellular response to osmotic stress. Cell Physiol Biochem. 2000;10:303–6. doi: 10.1159/000016362. [DOI] [PubMed] [Google Scholar]
- Benz K, Amman K. Maternal nutrition, low nephron number and arterial hypertension in later life. Biochim Biophys Acta. 2010;1802(12):1309–17. doi: 10.1016/j.bbadis.2010.03.002. [DOI] [PubMed] [Google Scholar]
- Boadi WY, Urbach J, Barnea ER, Brandes JM, Yannai S. Enzyme activities in the term human placenta: In vitro effect of cadmium. Pharmacology and Toxicology. 1992;71:209–212. doi: 10.1111/j.1600-0773.1992.tb00547.x. [DOI] [PubMed] [Google Scholar]
- Bradford M. Analytical Biochemistry. 1976;72:248. doi: 10.1006/abio.1976.9999. [DOI] [PubMed] [Google Scholar]
- Brenner BM, Chertow GM. Congenital oligonephropathy and the etiology of adult hypertension and progressive renal injury. Am J Kidney Dis. 1994;23:171–5. [PubMed] [Google Scholar]
- Burn SF, Webb A, Berry RL, Davies JA, Ferrer-Vaquer A, Hadjantonakis AK, Hastie ND, Hohenstein P. Calcium/NFAT signalling promotes early nephrogenesis. Dev Biol. 2011;352:288–98. doi: 10.1016/j.ydbio.2011.01.033. [DOI] [PMC free article] [PubMed] [Google Scholar]
- Calkins K, Devaskar SU. Fetal origins of adult disease. Curr Probl Pediatr Adolesc Health Care. 2011;41:158–76. doi: 10.1016/j.cppeds.2011.01.001. [DOI] [PMC free article] [PubMed] [Google Scholar]
- Centers for Disease Control and Prevention. Surgeon General’s Report. U.S. Department of Health and Human Services Coordinating Center for Health Promotion National Center for Chronic Disease Prevention and Health Promotion Office of Smoking and Health; 2001. Women and smoking. [Google Scholar]
- Centers for Disease Control and Prevention. Low Birth Weight and Growth Retardation in the Environment. 2010. Reproduction and Birth Outcomes. [Google Scholar]
- Chu P, Lu K, Lin Y. Acute correction of metabolic acidosis increases serum procollagen type I carboxyterminal propeptide in patients with chronic renal failure. J Formos Med Assoc. 2001;100:748–52. [PubMed] [Google Scholar]
- Czekaj P, Pałasz A, Lebda-Wyborny T, Nowaczyk-Dura G, Karczewska W, Florek E, Kamiński M. Morphological changes in lungs, placenta, liver and kidneys of pregnant rats exposed to cigarette smoke. Int Arch Occup Environ Health. 2002;75:S27–S35. doi: 10.1007/s00420-002-0343-3. [DOI] [PubMed] [Google Scholar]
- Doherty SP, Grabowski J, Hoffman C, Ng SP, Zelikoff JT. Early life insult from cigarette smoke may be predictive of chronic diseases later in life. Biomarkers Suppl. 2009;1:97–101. doi: 10.1080/13547500902965898. [DOI] [PubMed] [Google Scholar]
- Doll R. Cancers weakly related to smoking. British Medical Bulletin. 1996;52:35–49. doi: 10.1093/oxfordjournals.bmb.a011531. [DOI] [PubMed] [Google Scholar]
- El-Safty IA, Gadallah M, Shouman AE, Nessim DE. Subclinical nephrotoxicity caused by smoking and occupational silica exposure among Egyptian industrial workers. Arch Med Res. 2003;34:415–421. doi: 10.1016/S0188-4409(03)00077-8. [DOI] [PubMed] [Google Scholar]
- Esposito ER, Horn KH, Greene RM, Pisano MM. An animal model of cigarette smoke-induced in utero growth retardation. Toxicology. 2008;246:193–202. doi: 10.1016/j.tox.2008.01.014. [DOI] [PMC free article] [PubMed] [Google Scholar]
- Gabert BJ, Kültz D. Osmoprotective proteome adjustments in mouse kidney papilla. Biochim Biophys Acta. 2011;1814:435–48. doi: 10.1016/j.bbapap.2011.01.003. [DOI] [PMC free article] [PubMed] [Google Scholar]
- Gao Y, Holloway JA, Zeng CZ, Lim HG, Petrik EJJ, Foster WG, Lee RM. Prenatal exposure to nicotine causes postnatal obesity and altered perivascular adipose tissue function. Obes Res. 2005;13:687–92. doi: 10.1038/oby.2005.77. [DOI] [PubMed] [Google Scholar]
- Gilbert T, Leclerc C, Moreau M. Control of kidney development by calcium ions. Biochimie. 2011 doi: 10.1016/j.biochi.2011.07.007. [Epub ahead of print] [DOI] [PubMed] [Google Scholar]
- Hoffman D, Hoffman I. The changing cigarette, 1950–1995. J Toxicol Environ Health. 1997;50:307–364. doi: 10.1080/009841097160393. [DOI] [PubMed] [Google Scholar]
- Hughson M, Farris AB, Douglas-Denton R, Hoy WE, Bertram JF. Glomerular number and glomerular size in autopsy kidneys: the relationship to birth weight. Kidney Int. 2003;63:2113–2122. doi: 10.1046/j.1523-1755.2003.00018.x. [DOI] [PubMed] [Google Scholar]
- Ingelfinger JR. Congenital ureteral obstruction: new technology, new targets. Kidney Int. 2003;64:25–35. doi: 10.1046/j.1523-1755.2003.00086.x. [DOI] [PubMed] [Google Scholar]
- Ingenuity Systems. [Accessed on October 27, 2010];Ingenuity Pathway Analysis: Overview. http://www.ingenuity.com/products/pathways_analysis.html.
- Karp NA, Griffin JL, Lilley KS. Application of partial least squares discriminant analysis to two-dimensional difference gel studies in expression proteomics. Proteomics. 2005;5:81–90. doi: 10.1002/pmic.200400881. [DOI] [PubMed] [Google Scholar]
- Kuure S, Vuolteenaho R, Vainio S. Kidney morphogenesis: cellular and molecular regulation. Mechanisms of development. 2000;92:31–45. doi: 10.1016/s0925-4773(99)00323-8. [DOI] [PubMed] [Google Scholar]
- Kyerematen GA, Vesell ES. Metabolism of Nicotine. Drug metabolic review. 1991;23:3–41. doi: 10.3109/03602539109029754. [DOI] [PubMed] [Google Scholar]
- Lelievre-Pegorier M, Vilar J, Ferrier ML, Moreau E, Freund N, Gilbert T, Merlet-Benichou C. Mild vitamin A deficiency leads to inborn nephron deficit in the rat. Kidney Int. 1998;54(5):1455–1462. doi: 10.1046/j.1523-1755.1998.00151.x. [DOI] [PubMed] [Google Scholar]
- Liu L, Dunn ST, Christakos S, Hanson-Painton O, Bourdeau JE. Calbindin-D28k gene expression in the developing mouse kidney. Kidney Int. 1993;44:322–30. doi: 10.1038/ki.1993.247. [DOI] [PubMed] [Google Scholar]
- Luyckx VA, Brenner BM. The clinical importance of nephron mass. J Am Soc Nephrol. 2010;21:898–910. doi: 10.1681/ASN.2009121248. [DOI] [PubMed] [Google Scholar]
- Smoking During Pregnancy. Apr, 2010. March of Dimes. Retrieved on May 12, 2010. [Google Scholar]
- Michl M, Ouyang N, Fraek ML, Beck FX, Neuhofer W. Expression and regulation of alphaB-crystallin in the kidney in vivo and in vitro. Pflugers Arch. 2006;452:387–95. doi: 10.1007/s00424-005-0033-6. [DOI] [PubMed] [Google Scholar]
- Mueckler M. Facilitated Glucose Transporters. Eur J Biochem. 1994;219:713–725. doi: 10.1111/j.1432-1033.1994.tb18550.x. [DOI] [PubMed] [Google Scholar]
- Murawski IJ, Maina RW, Gupta IR. The relationship between nephron number, kidney size and body weight in two inbred mouse strains. Organogenesis. 2010;6:189–94. doi: 10.4161/org.6.3.12125. [DOI] [PMC free article] [PubMed] [Google Scholar]
- Nelson E, Goubet-Wiemers C, Guo Y, Jodscheit K. Maternal passive smoking during pregnancy and foetal developmental toxicity. Part 2: histological changes. Hum Exp Toxicol. 1999;18:257–64. doi: 10.1191/096032799678840011. [DOI] [PubMed] [Google Scholar]
- Neuhoff V, Stamm R, Eibl H. Clear background and highly sensitive protein staining with Coomassie Blue dyes in polyacrylamide gels: a systematic analysis. Electrophoresis. 1985;6:427–448. [Google Scholar]
- Ng SP, Conklin DJ, Bhatnagar A, Bolanowski DD, Lyon J, Zelikoff JT. Prenatal exposure to cigarette smoke induces diet- and sex-dependent dyslipidemia and weight gain in adult murine offspring. Environ Health Perspect. 2009;117:1042–8. doi: 10.1289/ehp.0800193. [DOI] [PMC free article] [PubMed] [Google Scholar]
- Nordlund LA, Carstensen JM, Pershagen G. Cancer incidence in female smokers: A 26 year follow up. Int J Cancer. 1997;73:625–628. doi: 10.1002/(sici)1097-0215(19971127)73:5<625::aid-ijc2>3.0.co;2-z. [DOI] [PubMed] [Google Scholar]
- Odoni G, Ogata H, Viedt C, Amann K, Ritz E, Orth SR. Cigarette smoke condensate aggravates renal injury in the renal ablation model. Kidney International. 2002;61:2090–8. doi: 10.1046/j.1523-1755.2002.00382.x. [DOI] [PubMed] [Google Scholar]
- Oken E, Levitan EB, Gillman MW. Maternal smoking during pregnancy and child overweight: systematic review and meta-analysis. Int J Obes (Lond) 2008;32:201–10. doi: 10.1038/sj.ijo.0803760. [DOI] [PMC free article] [PubMed] [Google Scholar]
- Rahman I, Nee Mac. Oxidant/antioxidant imbalance in smokers and chronic obstructive pulmonary disease. Thorax. 1996;51:348–350. doi: 10.1136/thx.51.4.348. [DOI] [PMC free article] [PubMed] [Google Scholar]
- Roth J, Thorens B, Hunziker W, Norman AW, Orci L. Vitamin D--dependent calcium binding protein: immunocytochemical localization in chick kidney. Science. 1981;214:197–200. doi: 10.1126/science.7025212. [DOI] [PubMed] [Google Scholar]
- Society for Research on Nicotine, Tobacco Subcommittee on Biochemical Verification . Biochemical verification of tobacco use and cessation. Nicotine Tob Res. 2002;4(2):149–59. doi: 10.1080/14622200210123581. [DOI] [PubMed] [Google Scholar]
- Shah PK, Helfant RH. Smoking and coronary artery disease. Chest. 1988;94:449–452. doi: 10.1378/chest.94.3.449. [DOI] [PubMed] [Google Scholar]
- Shea AK, Steiner M. Cigarette smoking during pregnancy. Nicotine and Tobacco research. 2008;10:267–278. doi: 10.1080/14622200701825908. [DOI] [PubMed] [Google Scholar]
- Sisman AR, Bulbul M, Coker C, Onvural B. Cadmium exposure in tobacco workers: possible renal effects. Journal of trace elements and Medical Biology. 2003;17:51–55. doi: 10.1016/S0946-672X(03)80046-9. [DOI] [PubMed] [Google Scholar]
- Substance Abuse and Mental Health Services Administration. Office of Applied Studies. National Household Survey on Drug Abuse; 1999. [Google Scholar]
- Stack AG, Murthy AV. Cigarette use and cardiovascular risk in chronic kidney disease: An unappreciated modifiable lifestyle risk factor. Seminars in Dialysis. 2010;23:298–305. doi: 10.1111/j.1525-139X.2010.00728.x. [DOI] [PubMed] [Google Scholar]
- Tanigawa S, Wang H, Yang Y, Sharma N, Tarasova N, Ajima R, Yamaguchi TP, Rodriguez LG, Perantoni AO. Wnt4 induces nephronic tubules in metanephric mesenchyme by a non-canonical mechanism. Dev Biol. 2011;352:58–69. doi: 10.1016/j.ydbio.2011.01.012. [DOI] [PMC free article] [PubMed] [Google Scholar]
- Teague SV, Pinkerton KE, Goldsmith M, Gebremichael A, Chang S. Sidestream cigarette smoke generation and exposure system for environmental tobacco smoke studies. 1994. [Google Scholar]
- Tomatis L. Overview of perinatal and multigeneration carcinogenesis. In: Napapkov NP, Rice JM, Tomatis L, Yamasaki H, editors. Prenatal and Multigeneration Carcinogenesis. Agency for Research on Cancer; Lyon France: 1989. pp. 1–15. Sci. Publ., No.96. [Google Scholar]
- Xu R, Zuo L. Low birthweight and chronic kidney disease. Nephrology (Carlton) 2010;15(Suppl 2):18–22. doi: 10.1111/j.1440-1797.2010.01306.x. [DOI] [PubMed] [Google Scholar]
- Zavos PM. Cigarette smoking and human reproduction: effects on female and male fecundity. Infertility. 1989;12:35–46. [Google Scholar]
- Zdravkovic T, Genbacev O, McMaster MT, Fisher SJ. The adverse effects of maternal smoking on the human placenta: a review. Placenta. 2005;26:S81–S86. doi: 10.1016/j.placenta.2005.02.003. [DOI] [PubMed] [Google Scholar]