Abstract
MicroRNAs (miRs) seem to mediate renal fibrosis in several renal diseases, with some miRs having profibrotic effects and others having opposing effects. Although differential expression of certain miRs has been described in lupus nephritis, it is unknown whether miRs contribute to fibrosis or could serve as biomarkers of specific histologic manifestations of lupus nephritis. Here, we compared miR expression in kidney biopsies from patients with lupus nephritis and identified miR-150 as the most differentially expressed miR in kidneys with high chronicity (chronicity index [CI] ≥4); miR-150 positively correlated with chronicity scores and the expression of profibrotic proteins. Overexpression of miR-150 significantly reduced expression of the antifibrotic protein suppressor of cytokine signaling 1 (SOCS1) and upregulated profibrotic proteins in both proximal tubular and mesangial cells. Directly targeting SOCS1 with a small interfering RNA produced similar results. Furthermore, TGF-β1 induced miR-150 expression, decreased SOCS1, and increased profibrotic proteins in proximal tubular cells and podocytes; a miR-150 inhibitor reversed these changes, suggesting that the profibrotic effects of TGF-β1 are, at least in part, mediated by miR-150. Consistent with these in vitro observations, biopsies with high miR-150 and high CI exhibited substantial expression of TGF-β1, reduced SOCS1, and an increase in profibrotic proteins. In summary, miR-150 is a promising quantitative renal biomarker of kidney injury in lupus nephritis. Our results suggest that miR-150 promotes renal fibrosis by increasing profibrotic molecules through downregulation of SOCS1.
Despite improvements in renal outcomes in lupus nephritis (LN), a significant proportion of patients still progress to ESRD.1,2 Fibrosis is the main pathologic feature in progressive LN and is captured by the chronicity index (CI), a semiquantitative score of chronic kidney injury, strongly associated with progression to ESRD.3
MicroRNAs (miRs) are involved in the pathogenesis of CKD and renal fibrosis,4–6 with some miRs showing profibrotic and others antifibrotic effects.7 miR-192, miR-141, miR-205, miR-377, and miR-21 are increased, whereas miR-29 and miR-200 are decreased in patients or animal models with renal fibrosis due to diabetic nephropathy (DN),8–10 obstructive nephropathy,11–13 IgA nephropathy,14 and hypertensive nephrosclerosis.15 Moreover, inhibition of miR-192 ameliorated renal fibrosis in diabetic mice.10 These findings suggest that miRs are important mediators in renal fibrosis and might be potential therapeutic targets to prevent ESRD.
There are few studies of miRs in LN. One study identified 66 differentially expressed miRs in renal biopsies from LN patients compared with normal controls.16 Another study found that the intrarenal expression of miR-638, miR-198, and miR-146a was different between LN and normal controls.17 No study explored miRs as biomarkers of any specific histologic manifestation or their potential role in renal fibrosis in LN.
In this study, we aimed to identify miR biomarkers reflective of CI in kidney biopsies from LN patients and to explore the potential pathogenic role of differentially expressed miRs in renal fibrosis. We show that miR-150 is significantly increased in renal biopsies with high CI and that increased miR-150 levels lead to increased production of profibrotic molecules through downregulation of suppressor of cytokine signaling 1 (SOCS1), a negative regulator of fibrosis.18–20
Results
Renal miR-150 is Associated with Increased Chronicity in LN
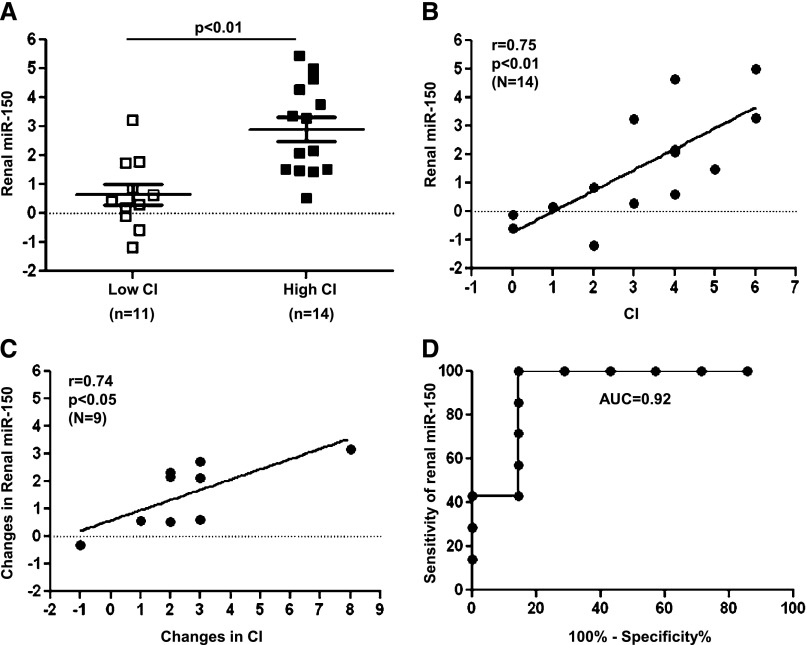
To identify miRs reflecting increased chronicity in renal biopsies from LN patients, we compared miR expression from kidneys with low (<4) or high CI (≥4) (Table 1). Using microRNA microarrays, we identified 16 miRs with >2-fold differences in their expression in 18 kidneys including baseline and repeated biopsies from 8 LN patients (http://www.ncbi.nlm.nih.gov/geo/query/acc.cgi?acc=GSE42648). Of these, miR-150 was upregulated nearly 4-fold in the kidneys with high CI compared with low CI (Supplemental Table 1). The differential expression of miR-150 was validated by TaqMan RT-PCR (Figure 1A) including an additional seven biopsies from six patients. Renal miR-150 levels correlated positively with histologic CI in baseline biopsies from independent patients (r=0.75, P<0.01) (Figure 1B). The results were essentially identical when we replaced the baseline biopsies with repeated biopsies from the same patients (data not shown). There was a strong correlation between the changes in renal miR-150 and the changes in CI between baseline and repeated biopsies (r=0.74, P<0.05) (Figure 1C). In a receiver operating characteristic (ROC) analysis, renal miR-150 predicted CI ≥4 with a high diagnostic accuracy (area under the curve, 0.92; 95% confidence interval, 0.75 to 1.08) (Figure 1D).
Table 1.
Clinical information of kidney biopsies from LN patients
| Patient No. | Renal Biopsies | CI | |||||
|---|---|---|---|---|---|---|---|
| CI Score | Category | Glomerular Sclerosis | Fibrous Crescents | Tubular Atrophy | Interstitial Fibrosis | ||
| 1 | Baseline | 2 | Low | 0 | 0 | 1 | 1 |
| Repeat | 5 | High | 2 | 1 | 1 | 1 | |
| 2 | Baseline | 0 | Low | 0 | 0 | 0 | 0 |
| Repeat | 1 | Low | 0 | 0 | 1 | 0 | |
| 3 | Baseline | 0 | Low | 0 | 0 | 0 | 0 |
| Repeat | 4 | High | 1 | 0 | 1 | 2 | |
| Repeat | 0 | Low | 0 | 0 | 0 | 0 | |
| Repeat | 2 | Low | 1 | 0 | 1 | 0 | |
| 4 | Baseline | 6 | High | 1 | 2 | 1 | 2 |
| Repeat | 8 | High | 3 | 1 | 2 | 2 | |
| 5 | Baseline | 3 | Low | 0 | 1 | 1 | 1 |
| Repeat | 5 | High | 2 | 1 | 1 | 1 | |
| 6 | Baseline | 4 | High | 1 | 1 | 1 | 1 |
| Repeat | 3 | Low | 1 | 0 | 1 | 1 | |
| 7 | Baseline | 4 | High | 0 | 1 | 1 | 2 |
| Repeat | 7 | High | 2 | 1 | 2 | 2 | |
| 8 | Baseline | 1 | Low | 0 | 0 | 0 | 1 |
| Repeat | 9 | High | 3 | 2 | 2 | 2 | |
| 9 | Baseline | 2 | Low | 0 | 0 | 1 | 1 |
| Repeat | 5 | High | 2 | 1 | 1 | 1 | |
| 10 | Single | 6 | High | 2 | 2 | 1 | 1 |
| 11 | Single | 3 | Low | 0 | 0 | 1 | 2 |
| 12 | Single | 4 | High | 2 | 0 | 1 | 1 |
| 13 | Single | 4 | High | 1 | 0 | 1 | 2 |
| 14 | Single | 5 | High | 1 | 0 | 2 | 2 |
Kidney biopsies (n=25) from 14 patients with proliferative LN. Nine patients had baseline and repeated biopsies. Biopsies with CI ≥4 were categorized as having a high degree of chronicity. CI score consists of the sum of individual scores of four features, including glomerular sclerosis, fibrous crescents, tubular atrophy, and interstitial fibrosis. The maximum score was 12 points for CI.
Figure 1.
miR-150 expression in individual kidney biopsies and its correlation with CI of LN. (A) miR-150 expression is increased in the biopsies with high CI (≥4) compared with low CI (<4) in 25 FFPE kidney specimens from 14 patients including baseline and repeated biopsies by TaqMan RT-PCR. (B) The correlation between renal miR-150 and CI in 14 independent patients with baseline biopsies from same patients. (C) The correlation between changes in miR-150 and changes in CI score (repeated – baseline) in nine patients. (D) Logistic regression and ROC of renal miR-150 for CI ≥4 in 14 patients (area under the curve, 0.92). The renal miR-150 level is expressed in relation to the expression of U48 (ΔCt: U48Ct − miR-150Ct).
Cellular Localization of miR-150 in Kidney
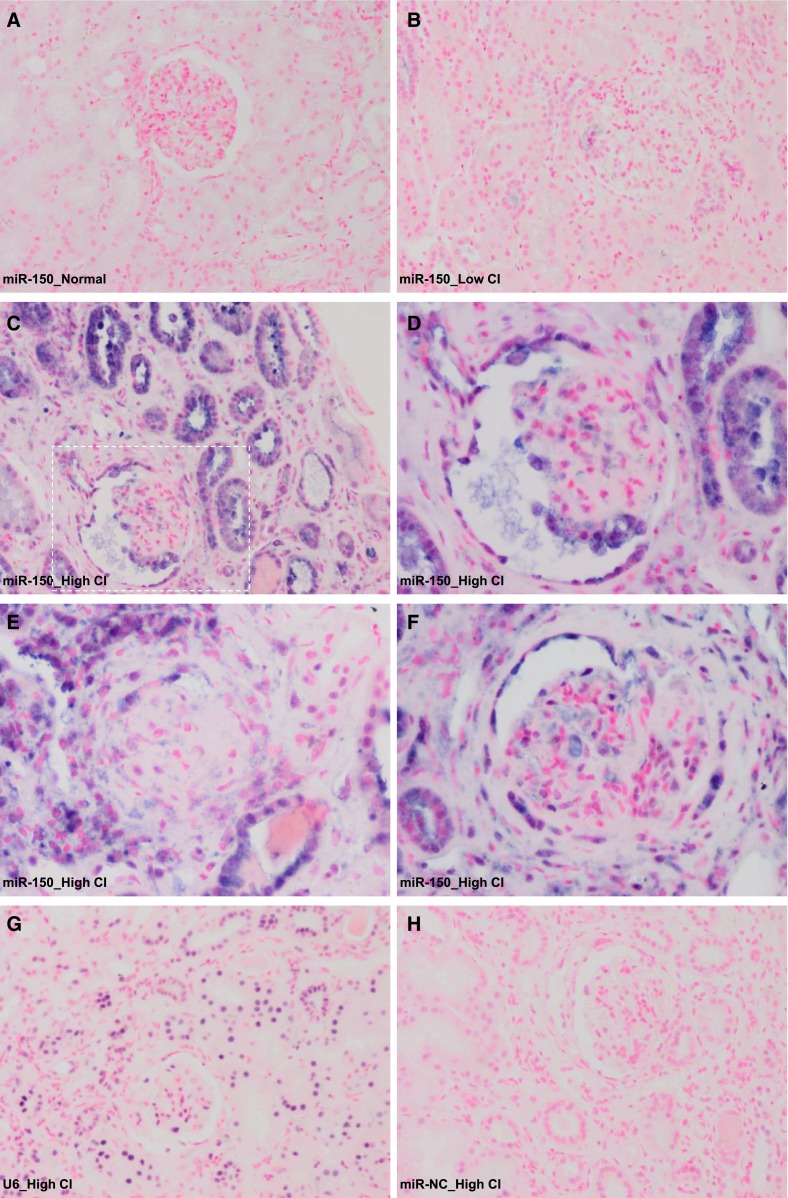
No miR-150 was detected by in situ hybridization in two control kidneys (Figure 2A). Very weak staining was seen in kidneys with low miR-150 and low CI (n=3) (Figure 2B). In contrast, strong positive staining was observed in kidneys with high miR-150 and high CI (n=3), predominantly in the proximal tubular cells (Figure 2C). A moderate staining also appeared in podocytes in both normal looking and sclerotic glomeruli (Figure 2, D and E). Interestingly, strikingly positive miR-150 staining was seen in parietal epithelial cells of Bowman’s capsules (Figure 2F). Weak positive staining was also seen in some, but not all, infiltrating cells with no difference between biopsies with high or low miR-150 expression (Supplemental Figure 1, A1 and A2). To exclude infiltrating cells as the main source of increased miR-150, first we showed that miR-150 expression levels did not correlate with the activity index (AI) (Supplemental Figure 1, A3), which includes a measure of interstitial infiltration.3 To show that using the AI as a surrogate for interstitial infiltration is reasonable, we performed immunofluorescence staining for CD45, a pan-leukocyte marker on a subset of biopsies (n=8), and showed a strong correlation between CD45+ staining and the AI (r=0.77, P=0.03) and no correlation between CD45+ staining and miR-150 expression (Supplemental Figure 1, B1–B5).
Figure 2.
Cellular localization of miR-150 in human kidneys by in situ hybridization. (A) Normal renal cortex without known kidney disease. Needle renal biopsy from a LN patient with low renal miR-150 level and low CI (B), and needle renal biopsies from LN patients with high renal miR-150 expression and high CI (C–H). (C) Most of the positive staining is in proximal tubules. (D) High magnification of the indicated area in C showing positive staining of podocytes in a glomerulus. (E) A sclerotic glomerulus with positive staining. (F) Positive staining in parietal epithelial cells of Bowman’s capsule. Positive control with U6 (G) and miR negative control (miR-NC) (H). Original magnification, ×200 in A–C, G, and H; ×400 in D–F.
Renal Collagen I Staining Correlates with miR-150 Expression
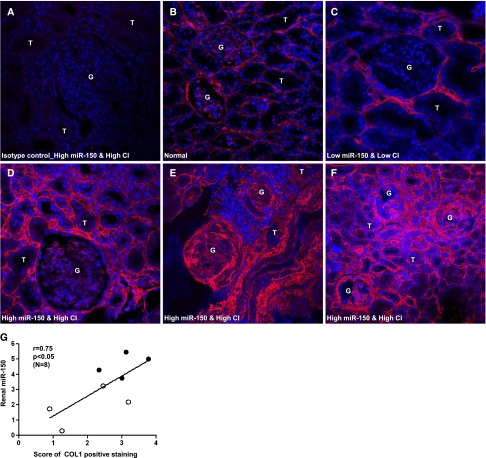
Collagen I (COL1) accumulation is a central feature of renal fibrosis.21 Therefore, we assessed the extent of COL1 staining using a semiquantitative score ranging from 0 to 4. Normal kidneys showed very low expression of COL1 (Figure 3B). In the kidneys with low miR-150 and low CI, COL1 was only modestly increased in peritubular and periglomerular areas (Figure 3C). In contrast, COL1 expression was significantly increased in the tubulointerstitium and sclerotic glomeruli in the kidneys with high miR-150 and high CI (Figure 3, D–F). A significant positive correlation was seen between COL1 and miR-150 expression in biopsies including high (n=4) and low chronicity (n=4) (Figure 3G).
Figure 3.
Immunofluorescence staining of COL1 in human kidneys. (A) Isotype control (normal rabbit IgG) in a LN kidney with high renal miR-150 and high CI. (B) Normal kidney cortex. (C) LN kidney with low renal miR-150 and low CI. (D–F) LN kidneys with high renal miR-150 and high CI. COL1 is stained red; the nuclei are stained with 4',6-diamidino-2-phenylindole and are blue. (G) The correlation between COL1 staining scores and renal miR-150 level in eight patients with high CI (solid dots) or low CI (open circles). The level of renal miR-150 is expressed in relation to the expression of U48 (ΔCt: U48Ct − miR-150Ct). Original magnification, ×400 in A–E; ×200 in F.
miR-150 Directly Targets SOCS1
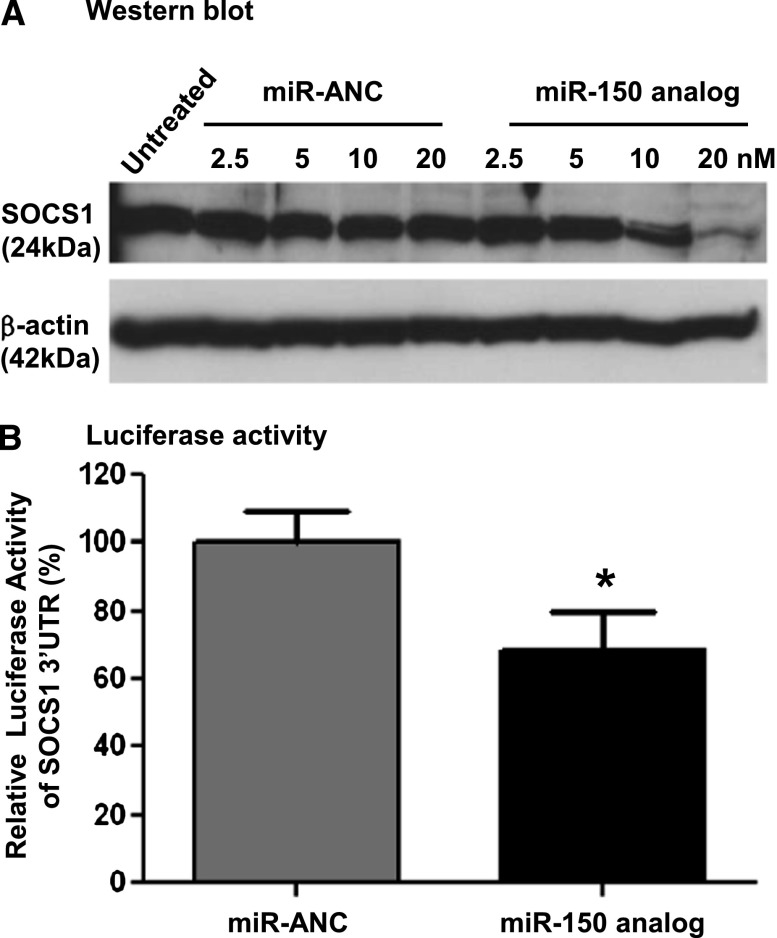
The positive correlation between renal fibrosis and miR-150 expression suggested that any effect of miR-150 on fibrosis would most likely be mediated by decreasing a negative regulator of fibrosis. We identified SOCS1 as such a target predicted by the European Bioinformatics Institute database (http://www.ebi.ac.uk/enright-srv/microcosm/cgi-bin/targets/v5/hit_list.pl?genome_id=native;mirna_id=hsa-miR-150;page=2). SOCS1 was shown to have an antifibrotic role both in vivo and in vitro.19,22,23 To confirm that SOCS1 is a target of miR-150, we examined the effect of a miR-150 analog in primary human renal proximal tubular cells (PTCs). Overexpression of miR-150 (Supplemental Figure 2A) significantly decreased SOCS1 protein levels 48 hours after miR-150 transfection in a dose-dependent manner (Figure 4A). To provide more direct evidence that miR-150 targets SOCS1, we cotransfected PTCs with a plasmid containing a luciferase gene under the control of SOCS1 3′ untranslated region (UTR) and either a miR-150 analog or a miR analog negative control. Luciferase activity decreased by 31.5% 48 hours after the transfection in the presence of miR-150 analog compared with the negative control (Figure 4B).
Figure 4.
The inhibitory effect of miR-150 analog on SOCS1 in primary normal human renal PTCs. (A) miR-150 analog results in a dose-dependent suppression of SOCS1 protein levels compared with miR analog negative control (miR-ANC) 48 hours after transfection. (B) Cotransfection of miR-150 analog (10 nM) and SOCS1 3′UTR luciferase reporter significantly decreases the luciferase activity compared with miR-ANC (16 replicates per group). *P<0.05 versus negative control.
miR-150 Increases Profibrotic Proteins Indirectly through Downregulation of SOCS1
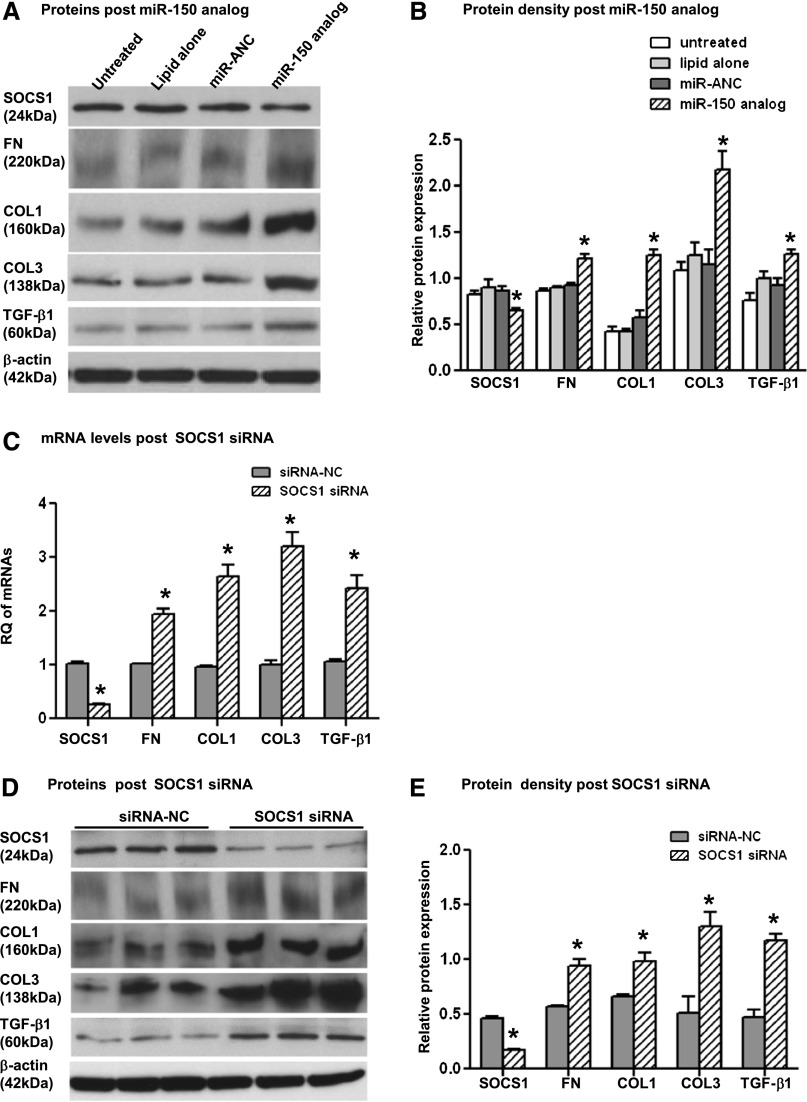
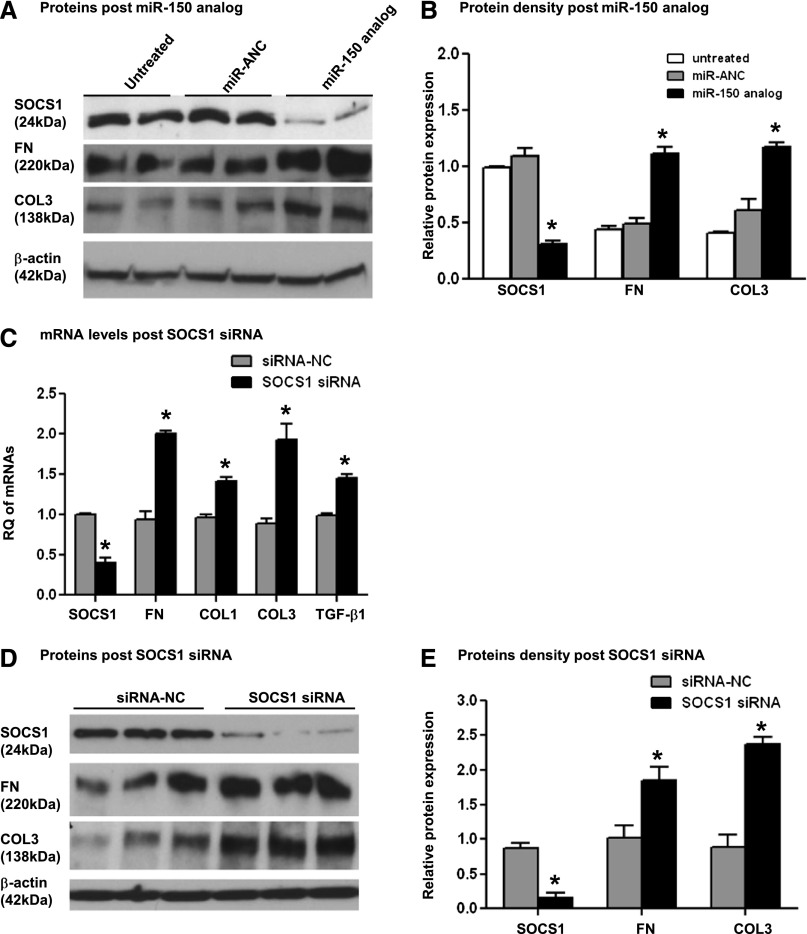
Next, we investigated whether the miR-150–induced decrease of SOCS1 led to an increase in the synthesis of profibrotic proteins in PTCs, primary human mesangial cells (MCs), and human podocytes, all of which are known to contribute to renal fibrosis. Transfection of MCs with miR-150 analog resulted in significantly decreased SOCS1 and a corresponding significantly increased protein expression of fibronectin (FN), COL1, collagen III (COL3), and TGF-β1 48 hours after transfection (Figure 5, A and B, and Supplemental Figure 2B). Transfection of PTCs with miR-150 analog led to a significant decrease in SOCS1 protein and significantly increased FN and COL3 protein levels 48 hours after transfection (Figure 6, A and B). COL1 and TGF-β1 were not detected in either untreated or miR-150 transfected PTCs.
Figure 5.
The effects of SOCS1 suppression with miR-150 analog or SOCS1 siRNA on profibrotic molecules in primary normal human MCs. Western blots (A) and relative protein levels (B) of SOCS1, FN, COL1, COL3, TGF-β1, and β-actin 48 hours after transfection of miR-150 analog (50 nM) or miR analog negative control (miR-ANC) and 48 hours after transfection of SOCS1 siRNA (50 nM) or siRNA negative control (siRNA-NC) (D and E). (C) mRNA expression of SOCS1 and profibrotic genes 48 hours after the transfection of SOCS1 siRNA or siRNA-NC. RQ expresses relative quantification of individual genes normalized by GAPDH. The relative expression of SOCS1 and profibrotic proteins is presented as a ratio of Western blot density of individual proteins and β-actin. *P<0.05 versus negative control.
Figure 6.
The effects of SOCS1 suppression with miR-150 analog or SOCS1 siRNA on profibrotic molecules in primary normal human renal PTCs. Western blots (A) and relative protein levels (B) of SOCS1, FN, COL3, and β-actin 48 hours after transfection of miR-150 analog (10 nM) or miR analog negative control (miR-ANC) and 48 hours after transfection of SOCS1 siRNA (20 nM) or siRNA negative control (siRNA-NC) (D and E). (C) mRNA expression of SOCS1 and profibrotic genes 48 hours after the transfection of SOCS1 siRNA or siRNA-NC. RQ expresses as relative quantification of individual genes normalized by GAPDH. The relative protein expression presents as a ratio of Western blot density of individual proteins and β-actin. *P<0.05 versus negative control.
To verify that the effect of miR-150 analog transfection on the increased production of profibrotic proteins is mediated through the downregulation of SOCS1 and not by other molecules targeted by miR-150, we specifically downregulated SOCS1 with a small interfering RNA (siRNA). Consistent with our previous findings, downregulation of SOCS1 significantly increased the expression of profibrotic genes at both mRNA and protein levels in both PTCs and MCs (Figures 5, C–E, and 6, C–E).
We saw no change in miR-150 levels or suppression of SOCS1 in podocytes after several attempts to transfect them, strongly suggesting that differentiated podocytes are refractory to these transfections, which is consistent with other studies.24
Human TGF-β1 Induces miR-150 Expression
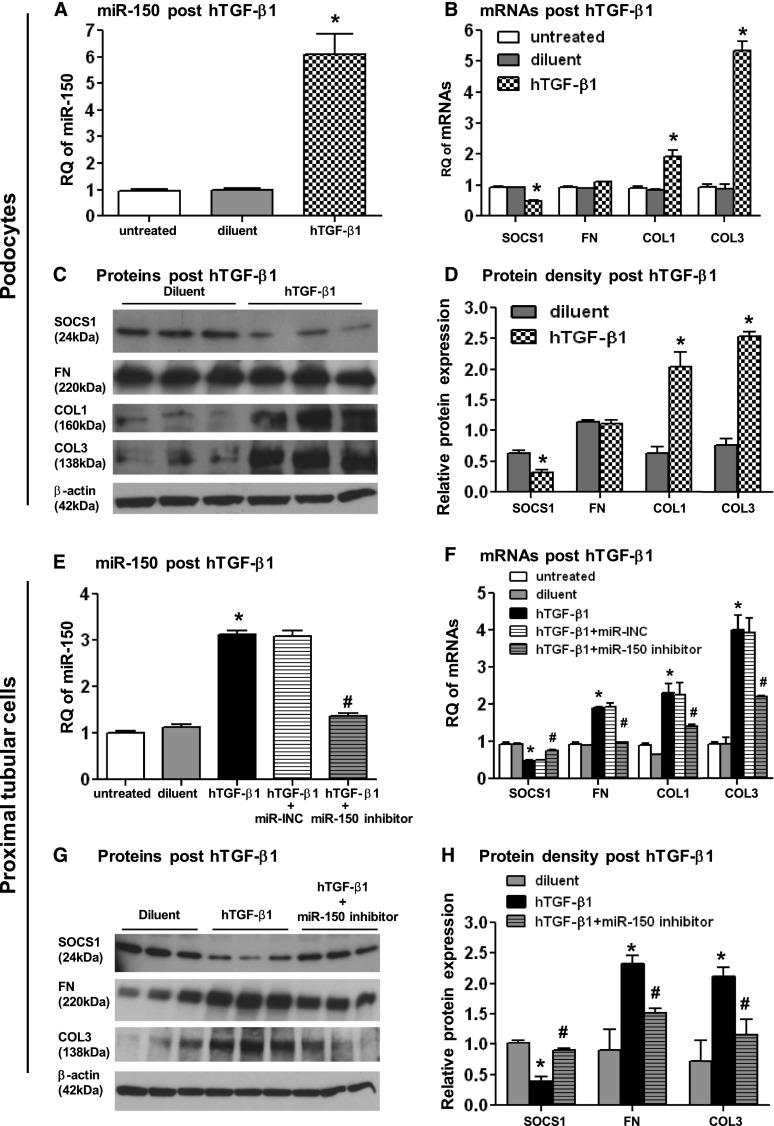
TGF-β1 is an important regulator of fibrosis7,25,26; therefore, we evaluated miR-150 expression after stimulation with human TGF-β1 (hTGF-β1). Compared with diluent treatment, 10 ng/ml of hTGF-β1 induced a 6-fold increase of miR-150 in podocytes (Figure 7A). It was previously reported that undifferentiated and differentiated podocytes exhibit different patterns of miR expression.27 Importantly, we did not observe any difference in miR-150 expression in podocytes with short (5 days) or long time (14 days) differentiation. In addition, 48-hour treatment with hTGF-β1 induced similar increases of miR-150 at both time points (Supplemental Figure 3). This hTGF-β1–induced upregulation of miR-150 gave us an opportunity to examine the effect of miR-150 on SOCS1 and profibrotic molecules in podocytes, which were refractory to transfection with both miR-150 analog and SOCS1 siRNA. Consistent with results obtained with overexpression of miR-150 in PTCs and MCs, SOCS1 significantly decreased, and COL1 and COL3 significantly increased in podocytes after hTGF-β1 stimulation at both mRNA (Figure 7B) and protein levels (Figure 7, C and D). Consistent with another study,12 no significant increase was seen in FN expression (Figure 7, C and D).
Figure 7.
Human TGF-β1–induced changes of miR-150, SOCS1, and profibrotic molecules can be reversed by miR-150 inhibitor. hTGF-β1 treatment of podocytes (10 ng/ml) (A–D) and primary human PTCs (250pg/ml) (E–H) induces a significant increase of miR-150 expression (A and E), and downregulation of SOCS1 and upregulation of profibrotic molecules at both mRNA (B and F) and protein levels (C, D, G, and H). miR-150 inhibitor suppressed overexpression of miR-150 (E) and reverses the decrease of SOCS1 as well as the increase of profibrotic molecules in PTCs (F–H) compared with hTGF-β1 alone or hTGF-β1 plus miR inhibitor negative control (miR-INC). RQ expresses as relative quantification of miR normalized by U48 and mRNA normalized by GAPDH. The relative protein expression presents as a ratio of Western blot density of individual protein and β-actin. *P<0.05 (hTGF-β1 versus diluent); #P<0.05 (hTGF-β + miR-150 inhibitor versus hTGF-β1).
In MCs, even high doses of hTGF-β1 (10 ng/ml) had no effect on miR-150 (data not shown). TGF-β1 is known to induce apoptosis, and epithelial-to-mesenchymal transition in PTCs.26 To minimize the potential confounding effect of these mechanisms, we used a concentration of hTGF-β1 (250 pg/ml) at which stimulated cells did not differ morphologically from diluent treated cells and observed a nearly 3-fold increase in miR-150 levels 48 hours after hTGF-β1stimulation (Figure 7E). This change led to a decrease in mRNA and protein levels of SOCS1 and an increase in profibrotic molecules (Figure 7, F–H). Cells incubated with diluent alone did not show such changes.
miR-150 Inhibitor Reversed hTGF-β1–Induced Changes of SOCS1 and Profibrotic Molecules
To show that the effect of hTGF-β1 on SOCS1 is linked to the upregulation of miR-150, we transfected hTGF-β1–stimulated PTCs with a miR-150 inhibitor or a miR inhibitor negative control. The miR-150 inhibitor significantly suppressed hTGF-β1–induced overexpression of miR-150 and reversed the changes of SOCS1 and profibrotic molecules at both mRNA and proteins levels (Figure 7, E–H), demonstrating that the profibrotic effects of hTGF-β1 are, at least in part, mediated by miR-150.
Confirmation of SOCS1 and Profibrotic Molecules in Kidney Biopsies
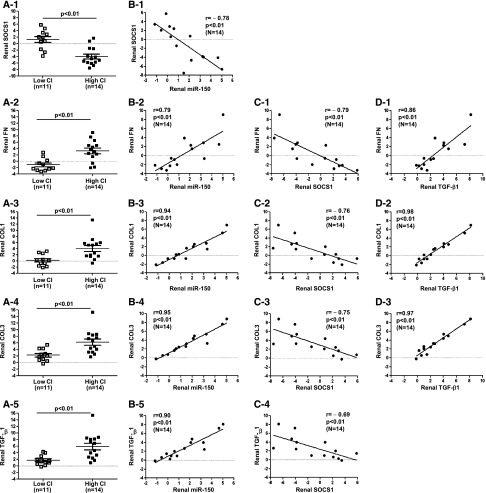
Next, we sought to confirm our in vitro results in kidney biopsies from LN patients. SOCS1 mRNA was significantly decreased, whereas the expression of profibrotic genes was increased in the kidneys with high CI compared with low CI (Figure 8, A1–A5). Moreover, SOCS1 showed a significant negative correlation with miR-150 expression, whereas profibrotic gene expression positively correlated with miR-150 levels (Figure 8, B1–B5). All profibrotic genes showed a negative correlation with SOCS1 level (Figure 8, C1–C4) and a positive correlation with TGF-β1 expression (Figure 8, D1–D3).
Figure 8.
mRNA expression of SOCS1 and profibrotic genes in kidney biopsies from LN patients. SOCS1 is decreased (A1) and FN, COL1, COL3, and TGF-β1 are increased (A2–A5) in biopsies (n=25) with high CI compared with low CI. (B1–B5) Renal miR-150 correlates negatively with SOCS1 and positively with profibrotic genes. All profibrotic genes negatively correlate with SOCS1 (C1–C4) and positively correlate with TGF-β1 (D1–D3) in 14 independent patients with baseline biopsies from same patients. mRNA level of individual gene is expressed in relation to the expression of GAPDH (ΔCt: GAPDH Ct − individual gene Ct).
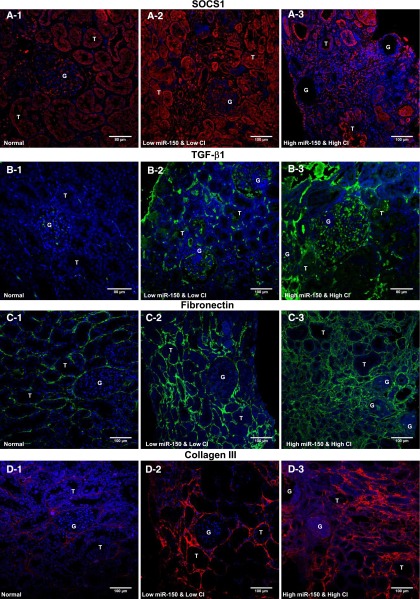
Immunofluorescence staining of SOCS1 was increased in LN kidneys with low miR-150 and CI compared with normal kidneys. In contrast, SOCS1 staining decreased in kidneys with high miR-150 and CI compared with the kidneys with low miR-150 and CI or normal kidneys (Figure 9, A1–A3, and Supplemental Figure 4). Consistent with previous reports,28,29 TGF-β1 staining was increased in LN biopsies compared with normal kidneys. Compared with the kidneys with low miR-150 and CI, kidneys with high miR-150 and CI showed much higher TGF-β1 signals (Figure 9, B1–B3). FN staining was significantly increased in kidneys with high miR-150 and high CI compared with normal and low CI kidneys (Figure 9, C1–C3). This increase in FN was more pronounced in the tubulointerstitium than in glomeruli, which is consistent with our in vitro findings showing a more robust upregulation of FN in PTCs compared with MCs or podocytes after miR-150 upregulation. In addition, similar to COL1 expression (Figure 3), the extent of COL3 expression in the peritubular and periglomerular areas increases with increasing chronicity (Figure 9, D1–D3). In globally sclerotic glomeruli, COL3 staining was much weaker than COL1 staining (Figures 3E and 9D3), which is consistent with a previous report.30
Figure 9.
Confirmation of SOCS1 and profibrotic proteins by immunofluorescence staining in human kidneys. (A) Compared with normal kidneys (A1), SOCS1 expression significantly increases in kidneys with low miR150 and CI (A2) and decreases in kidneys with high miR-150 and CI (A3). (B) Normal glomeruli show weak TGF-β1 staining (B1); TGF-β1 is significantly increased in glomeruli, the interstitium, and some tubules in the kidneys with low miR-150 and CI (B2), and continues to increase in kidneys with high miR-150 and high CI (B3). (C) FN shows very low amount FN in normal kidneys (C1); FN accumulation increases significantly in the tubulointerstitium of kidneys with low miR-150 and low CI (C2), and the amount of FN accumulation continues to increase in the tubulointerstitium of kidneys with high miR-150 and high CI (C3). The degree of increase in FN is much less in the glomeruli than the tubulointerstitium (C3). (D) Single staining of COL3 shows very faint positive staining in normal tubulointerstitium (D1), increased signals in the biopsies with low miR-150 and low CI (D2), and much stronger positive staining in the biopsies with high miR-150 and high CI with a weaker signal in glomeruli (D3). Original magnification, ×200.
Discussion
We have shown that miR-150 expression is increased in kidneys (predominantly in tubular cells) of LN patients with high CI and correlates with chronicity scores. In renal cells, overexpression or TGF-β1–induced increase of miR-150 directly decreases SOCS1 leading to increases in profibrotic protein production. The expression of SOCS-1 and profibrotic proteins in LN kidney biopsies is consistent with these observations and supports the pathophysiologic relevance of this mechanism.
The CI captures many aspects of renal fibrosis and is strongly associated with progression to ESRD in LN.3 We found a positive correlation between miR-150 levels in kidney biopsies and chronicity scores in a small cohort. If these data are confirmed in larger studies, miR-150 might be used as a quantitative diagnostic marker of intrarenal fibrosis and the risk of progression to ESRD. Future studies also need to assess the potential of serum and urine miR-150 as noninvasive biomarkers of renal fibrosis.
Previous studies focused on the proapoptotic role of miR-150 in lymphocyte-related cancers and immune diseases,31–33 but there is no report of miR-150 in fibrosis. Because miRs decrease the expression of their targets, the positive correlation of miR-150 with CI and profibrotic proteins could not be explained by a direct effect of miR-150 on the expression of profibrotic genes. We hypothesized that increased levels of miR-150 lead to increased fibrosis by targeting negative regulators of profibrotic proteins. A similar role was suggested for miR-192 (through suppression of ZEB1/ZEB2 or smad38,11) in DN models8 and other renal fibrosis models.11 In contrast, in patients with DN, renal miR-192 was decreased and correlated negatively with renal fibrosis.34 Similarly, decrease of miR-29 upregulated profibrotic genes in fibrotic heart tissues and renal fibrosis.12,35 These findings show that the profibrotic or antifibrotic roles of miRs may vary depending on the species, diseases, or stages of disease.
We identified SOCS1, a protein with known antifibrotic effects, as a predicted target of miR-150. Overexpression of SOCS1 reduced high glucose-induced TGF-β1 and FN synthesis in MCs19 and inhibited IL-1β–induced COL1 and FN production in PTCs,18 whereas SOCS1gene delivery inhibited renal TGF-β1 expression in DN mice.36 Upregulation of SOCS1 in kidneys from rats and patients with DN was considered as a compensatory protective response because SOCS1 gene delivery attenuated kidney injury in diabetic rats.23 SOCS1 was also decreased in human lung interstitial fibrosis22 and liver cirrhosis.37 Interestingly, SOCS1−/− mice developed lupus-like disease with severe GN and renal fibrosis20,38 and polycystic kidneys.38 These data provided the rationale for our hypothesis that increased miR-150 would lead to an increase in the production of profibrotic proteins through the downregulation of SOCS1. After confirming that SOCS1 is a target of miR-150, we have shown that increasing miR-150 either by transfection or hTGF-β1 stimulation leads to downregulation of SOCS1 and a corresponding increase in profibrotic proteins in three renal cell lines. In LN biopsies compared with normal biopsies, SOCS1 is increased in patients with low miR-150 and low CI but is decreased in patients with high miR-150 and high CI. This suggests that SOCS1 may play a compensatory protective role in early stages of renal fibrosis and that the miR-150–mediated loss of SOCS1 may accelerate the progression of fibrosis. In DN, the renal protective mechanism of SOCS1 was mediated by suppressing monocyte chemoattractant protein-1 and inhibiting the pathway of Janus kinase/signal transducers and activators of transcription, and decreasing infiltrating macrophages in kidneys.23 Although we cannot exclude a role for macrophages as an additional mediator of fibrosis in LN, our results suggest that the miR-150–induced increase of profibrotic proteins is primarily mediated by the decrease of SOCS1 in renal resident cells.
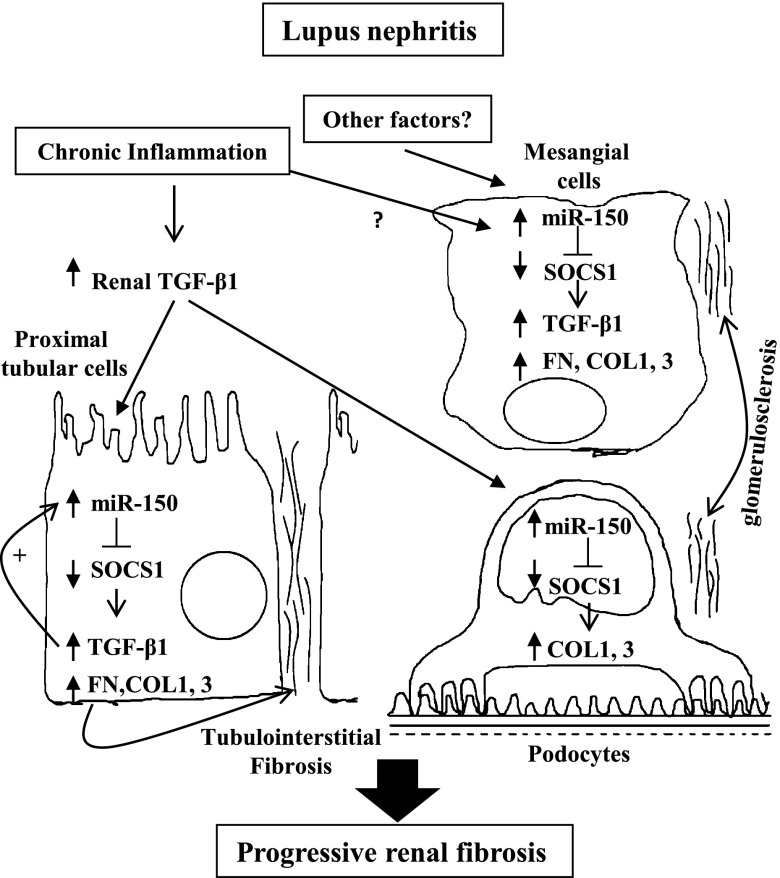
TGF-β1 is both an important regulator of miRs in kidneys8,11,12,34 and a well known mediator of renal fibrosis.7,25,39 In a murine model of LN,40 enhanced TGF-β production in kidneys induced local fibrogenesis and ultimately ESRD. In LN patients, serum TGF-β1 is decreased, whereas urinary TGF-β141–43 and renal TGF-β128,29 are significantly increased. In this study, the physiologic relevance of miR-150 in promoting fibrosis was evaluated both in vitro and on LN biopsies. In response to hTGF-β1, both podocytes and PTCs upregulated miR-150 and downregulated SOCS1, which led to an increase in profibrotic proteins. Transfection of PTCs with a miR-150 inhibitor significantly suppressed the hTGF-β1–induced increase of profibrotic molecules by decreasing SOCS1, confirming miR-150 as a mediator of the profibrotic effects of TGF-β1. Suppression of SOCS1 also increased TGF-β1 gene expression in PTCs, suggesting that a positive feedback loop between miR-150 and TGF-β1 expression might contribute to the maintenance and amplification of the fibrotic process leading to ESRD (Figure 10). Gene expression and protein immunostaining done on LN kidney biopsies were consistent with our model and in vitro studies, showing a negative correlation between miR-150 and SOCS-1 and SOCS-1 and profibrotic molecules. This strongly suggests that miR-150 plays a pathologic role in renal fibrosis in LN.
Figure 10.
A model for the role of miR-150 in renal fibrosis in LN. Chronic inflammation leads to an increase in TGF-β, which induces miR-150 expression in PTCs and podocytes. Simultaneously, miR-150 is upregulated in MCs by as-yet unidentified factor(s). miR-150 directly decreases SOCS1 levels, which leads to upregulation of the production of profibrotic proteins in all three types of renal cells. miR-150 and TGF-β1 mutually upregulate each other’s expression leading to a positive feedback loop in PTCs that maintains the profibrotic process.
We focused on the role of miR-150 in regulating profibrotic proteins in renal cells. More studies are needed to define the exact mechanisms by which SOCS1 regulates profibrotic proteins and to explore the effects of miR-150 on SOCS1 in other cells, such as lymphocytes and macrophages. miR-150 inhibition in animals with primary or secondary renal fibrosis may define the value of miR-150 as a therapeutic target in organ fibrosis.
Our data suggest that renal miR-150 plays an important role in renal fibrogenesis by increasing the synthesis of profibrotic molecules through downregulation of SOCS1. The positive feedback loop between the expression of miR-150 and TGF-β1 may play an important role in the maintenance of the profibrotic process leading to ESRD. The value of renal miR-150 as a potential biomarker to quantitatively evaluate the extent of chronic kidney injury and to estimate renal outcome in LN needs validation in a large cohort of patients.
Concise Methods
Human Kidney Tissue Samples
Formalin-fixed paraffin-embedded (FFPE) kidney specimens (n=25) including baseline and repeated needle renal biopsies were from 14 patients with LN enrolled in institutional review board–approved protocols at the National Institute of Diabetes and Digestive and Kidney Diseases between 1976 and 1999. The specimens were divided into two groups based on histologic CI. Biopsies with CI ≥4 were categorized as having a high degree of chronicity (Table 1). Eighteen kidneys from eight patients including high CI (n=9) and low CI (n=9) were used for miR profiling by microRNA microarrays. The 18 kidneys and additional 7 kidneys from six patients were used for miR validation and mRNA confirmation by TaqMan RT-PCR. Two FFPE normal kidneys without any known kidney diseases were used as control specimens for in situ hybridization and immunofluorescence staining.
miR Profiling
Total RNA was extracted from FFPE kidney specimens using the RecoverAll Total RNA Isolation Kit (Ambion Inc, Austin, TX). RNA qualities were assessed with NanoDrop 2000 to determine the concentration and 260/280 ratio and TaqMan RT-PCR for a discrete panel of miRs. Eighteen total RNA samples passing the quality examination from eight patients (top eight patients in Table 1) were used for miR profiling studies by Asuragen Inc (Austin, TX). One hundred nanograms of total RNA per sample was purified and hybridized to Affymetrix GeneChip miRNA arrays (Santa Clara, CA), which contain probes of 847 human-specific mature miRNAs. The intensity values of the microarray data were subjected to robust multi-array average background correction and quartile normalization, followed by mean summarization. A two-way ANOVA was performed to distinguish genes significantly changed between the two groups with low or high chronicity.
TaqMan RT-PCR
Total RNAs (20 ng) from kidney biopsies or cell lysates were used for measurement of miR-150. RT reaction (15 μl) was performed with the TaqMan MicroRNA Reverse Transcription Kit, and 3 μl of cDNA products were used for PCR by TaqMan MicroRNA Assays. Total RNAs (100 ng) from kidney biopsies were used for measuring mRNA expression of SOCS1, FN, COL1, COL3, and TGF-β1 (primer IDs are shown in Supplemental Table 2). Total RNAs (500 ng) from cell lysates were used for examination of the above mRNA expression. A high-capacity cDNA RT kit was used for RT reaction. An additional preamplification of RT products was performed by TaqMan PreAmp Master Mix with pooled primers and probes containing the above genes and glyceraldehyde 3-phosphate dehydrogenase (GAPDH) in the RT products from renal biopsies. RT direct cDNAs from cells or preamplified cDNAs from kidney biopsies were then completed with a PCR procedure that followed the manufacturer’s protocol (Applied Biosystems, Foster City, CA). The renal miR-150 level and mRNA of individual profibrotic genes were expressed, respectively, in relation to the expression of U48 (ΔCt: U48Ct − miR-150Ct) or to the expression of GAPDH (ΔCt: GAPDH Ct − individual gene Ct) for human renal biopsies. The cellular miR-150 level and profibrotic gene mRNAs are expressed as RQ indicating a relative quantification of miR-150 normalized by U48 and mRNAs normalized by GAPDH automatically generated by a quantitative PCR system.
In Situ Hybridization
In situ hybridization of miR-150 was performed in six biopsies with high CI or low CI and two control kidneys by the following procedure (Histoserve Inc, Germantown, MD). The slides were deparaffinized and washed by diethyl pyrocarbonate-dH20, permeabilized in 0.1 N HCl for 15 minutes at room temperature, and then washed in PBS followed by acetylation for 15 minutes and washing in SSC. The slides were covered with probe solution (miR-150, U6 as positive control and scrambled siRNA as negative control) and denatured at 75°C for 12 minutes followed by incubation at 55°C for 22 hours. A series of posthybridization washes in 2×SSC, 1×SSC, 0.5×SSC, and 0.25×SSC for 10 minutes each at 55°C was conducted. Slides were placed in blocking solution for 1 hour at room temperature followed by incubation in digoxigenin-AP Fab fragments (1:100) for 2 hours, which was followed by wash in PBS Tween for 15 minutes at room temperature and then wash in alkaline phosphatase buffer for 10 minutes at room temperature. Slides were developed with 5-bromo-4-chloro-3′-indolyphosphate/nitro blue tetrazolium chloride and counterstained with nuclear fast red.
Immunofluorescence Staining in Human Kidneys
Slides (5 μm) of FFPE kidneys biopsies from eight biopsies with high CI and low CI and two control kidneys were deparaffinized, rehydrated, and then incubated in 10 mM citrate buffer (pH 6.0) or 1 mM EDTA buffer with 0.05% Tween (pH 8.0) in a microwave for 10 minutes to retrieve antigen. Nonspecific binding was blocked with 10% normal donkey serum for 30 minutes at room temperature. The slides were incubated with antibody of COL1, SOCS1, TGF-β1, FN, COL3, and CD45 at 4°C overnight, followed by incubation with Alexa-594/Alexa-488 donkey anti-rabbit/anti-mouse IgG (Supplemental Table 3 presents information on all antibodies and dilutions) at room temperature for 1 hour in the dark. After five washes with 1×PBS in the dark, the slides were mounted with 4',6-diamidino-2-phenylindole mounting medium (Vector Labs, Burlingame, CA). Images were captured using an immunofluorescence confocal microscope (Olympus Fluoview FV1000; Olympus America, Center Valley, PA). All immunostaining, image capture, and quantification were performed on blinded slides. For semiquantitative analysis of COL1 accumulation, all cortical fields were scored from 0 to 4 for each field, with an average for each kidney calculated. The score of COL1 expression was assessed as 0 for 0%, 1 for <25%, 2 for 25%–50%, 3 for 50%–75%, and 4 for >75% of each field occupied by COL1-positive area.44 The expression of SOCS1 and CD45 (all images per biopsy, ×200) were quantified using ImageJ software with a similar method used by Ortiz-Muñoz et al.23 SOCS1 staining was expressed as a ratio of the intensity to positive area in glomeruli and tubulointerstitium. CD45 staining was expressed as a percentage of the total area.
Human Kidney Cells
Primary normal human renal PTCs and primary normal human MCs were purchased from Lonza (Walkersville, MD) and were grown in the recommended media provided by the manufacturer. Conditionally immortalized human podocyte cells (AB8/13; gift from Dr. Moin Saleem) were cultured in RPMI (Gibco, Grand Island, NY) supplemented with 10% FBS, insulin-transferrin-selenium G, and 100 U/ml of penicillin and streptomycin (Invitrogen, Grand Island, NY). After incubation for 5 and 14 days at 37°C under growth-restricted conditions, differentiated podocytes at both days 5 and 14 were used for examination of miR-150 expression and podocytes at day 5 were used for all other experiments as in our previous study.45
Transfection of miR-150 Analog/Inhibitor or SOCS1 siRNA and Stimulation with hTGF-β1
First, the optimal concentrations of miR-150 analog, miR-150 inhibitor, SOCS1 siRNA, and hTGF-β1 were determined by testing a serial differential concentration of each agent in three different cells. The expression of miR-150 and SOCS1 measured by TaqMan RT-PCR was used to determine the successful transfection and significant reduction of SOCS1 protein was used to determine the optimal concentration of each transfect agent. Then cells plated on 12-well plates were transfected with the selected optimal concentration of each transfection agent or stimulated with optimized hTGF-β1 concentration and their respective negative controls (Supplemental Table 4 provides agent details and optimized concentrations). The cells were collected 48 hours after the treatment. The total RNAs were extracted with the miRCURY RNA Isolation Kit (Exiqon, Woburn, MA). The total proteins were harvested with radioimmunoprecipitation assay buffer and an equal volume of 2× Laemmli sample buffer containing 60 mg/ml dithiothreitol and denatured at 60°C for 10 minutes. RNA and protein samples were stored at −80°C until use.
Luciferase Activity Analyses
PTCs were seeded in 96-well plates for 24 hours and then were cotransfected using DharmaFECT Duo transfect reagent (Thermo Fisher Scientific, Lafayette, CO) with 40 ng of pEZX-MT01-SOCS1 3′UTR plus 10 nM of miR-150 analog or miR negative control (16 duplicates per group). The pEZX-MT01-SOCS1 3′UTR plasmid contains firefly luciferase and miR binding site from SOCS1 3′UTR, which is inserted between firefly luciferase cDNA and PolyA. This plasmid also includes Renilla luciferase as an internal control (GeneCopoeia, Rockville, MD). Transfected cells were lysed by reporter lysis buffer (Promega, Madison, WI). Dual luciferase activity was measured with the Dual-Luciferase Reporter Assay System (Promega) by FLUOstar Omega (BMG Labtech, Ortenberg, Germany).
Immunoblotting Analyses
Protein samples were separated by SDS-PAGE and gels were then transferred to polyvinylidene difluoride membranes. After blocking with 5% milk, membranes were probed overnight at 4°C with rabbit polyclonal antibody to SOCS1 (1:200; Santa Cruz Biotechnology, Santa Cruz, CA), COL1 (1:5000), COL3 (1:4000: Thermo Fisher Scientific), rabbit mAb to TGF-β1 (1:1000; Cell Signaling Technology, Danvers, MA), and mouse mAb to FN (1:500; Santa Cruz Biotechnology) and to β-actin (1:20,000; Sigma, St. Louis, MO). Blots were then incubated with peroxidase-conjugated, affinity-purified donkey anti-rabbit/anti-mouse IgG (1:100,000; Jackson Laboratories, West Grove, PA) for 90 minutes at room temperature. The antibody-antigen reactions were visualized by using the ECL Plus Western Blotting Detection System (GE Healthcare, Piscataway, NJ). The density of blots was analyzed by ImageJ software (National Institutes of Health, Bethesda, MD). The relative expression of proteins is expressed as the ratio of blot density from individual protein to β-actin.
Statistical Analyses
Three independent experiments (16 duplicates per group for luciferase study and triplicates per group for all other studies) were performed to confirm the reproducibility of each experiment. All data are expressed as mean ± SEM. Differences between groups were analyzed for statistical significance by the t test or ANOVA. Correlation between two variables was analyzed by Pearson’s linear correlation analysis. ROC analysis was used to assess the predictive accuracy of renal miR-150 level for CI ≥4. A P value <0.05 was accepted as statistically significant.
Disclosures
None.
Supplementary Material
Acknowledgments
The authors thank Dr. Osamu Icchi for technical assistance, Xiongce Zhao for statistical consultation, and Ziyao Wang for illustration assistance.
This research was supported by the National Institutes of Health Intramural Research Programs of the National Institute of Dental and Craniofacial Research and the National Institute of Diabetes and Digestive and Kidney Diseases.
Footnotes
Published online ahead of print. Publication date available at www.jasn.org.
This article contains supplemental material online at http://jasn.asnjournals.org/lookup/suppl/doi:10.1681/ASN.2012080849/-/DCSupplemental.
See related editorial, “Post-Transcriptional Gene Regulation Makes Things Clearer in Renal Fibrosis,” on pages 1026–1028.
References
- 1.Nowling TK, Gilkeson GS: Mechanisms of tissue injury in lupus nephritis. Arthritis Res Ther 13: 250, 2011 [DOI] [PMC free article] [PubMed] [Google Scholar]
- 2.Fanouriakis A, Krasoudaki E, Tzanakakis M, Boumpas DT: Recent progress in the treatment of lupus nephritis. Mod Rheumatol 22: 803–813, 2012 [DOI] [PubMed] [Google Scholar]
- 3.Austin HA, 3rd, Muenz LR, Joyce KM, Antonovych TT, Balow JE: Diffuse proliferative lupus nephritis: Identification of specific pathologic features affecting renal outcome. Kidney Int 25: 689–695, 1984 [DOI] [PubMed] [Google Scholar]
- 4.Lorenzen JM, Haller H, Thum T: MicroRNAs as mediators and therapeutic targets in chronic kidney disease. Nat Rev Nephrol 7: 286–294, 2011 [DOI] [PubMed] [Google Scholar]
- 5.Chandrasekaran K, Karolina DS, Sepramaniam S, Armugam A, Wintour EM, Bertram JF, Jeyaseelan K: Role of microRNAs in kidney homeostasis and disease. Kidney Int 81: 617–627, 2012 [DOI] [PubMed] [Google Scholar]
- 6.Patel V, Noureddine L: MicroRNAs and fibrosis. Curr Opin Nephrol Hypertens 21: 410–416, 2012 [DOI] [PMC free article] [PubMed] [Google Scholar]
- 7.Farris AB, Colvin RB: Renal interstitial fibrosis: Mechanisms and evaluation. Curr Opin Nephrol Hypertens 21: 289–300, 2012 [DOI] [PMC free article] [PubMed] [Google Scholar]
- 8.Kato M, Zhang J, Wang M, Lanting L, Yuan H, Rossi JJ, Natarajan R: MicroRNA-192 in diabetic kidney glomeruli and its function in TGF-beta-induced collagen expression via inhibition of E-box repressors. Proc Natl Acad Sci U S A 104: 3432–3437, 2007 [DOI] [PMC free article] [PubMed] [Google Scholar]
- 9.Wang Q, Wang Y, Minto AW, Wang J, Shi Q, Li X, Quigg RJ: MicroRNA-377 is up-regulated and can lead to increased fibronectin production in diabetic nephropathy. FASEB J 22: 4126–4135, 2008 [DOI] [PMC free article] [PubMed] [Google Scholar]
- 10.Putta S, Lanting L, Sun G, Lawson G, Kato M, Natarajan R: Inhibiting microRNA-192 ameliorates renal fibrosis in diabetic nephropathy. J Am Soc Nephrol 23: 458–469, 2012 [DOI] [PMC free article] [PubMed] [Google Scholar]
- 11.Chung AC, Huang XR, Meng X, Lan HY: miR-192 mediates TGF-beta/Smad3-driven renal fibrosis. J Am Soc Nephrol 21: 1317–1325, 2010 [DOI] [PMC free article] [PubMed] [Google Scholar]
- 12.Wang B, Komers R, Carew R, Winbanks CE, Xu B, Herman-Edelstein M, Koh P, Thomas M, Jandeleit-Dahm K, Gregorevic P, Cooper ME, Kantharidis P: Suppression of microRNA-29 expression by TGF-β1 promotes collagen expression and renal fibrosis. J Am Soc Nephrol 23: 252–265, 2012 [DOI] [PMC free article] [PubMed] [Google Scholar]
- 13.Xiong M, Jiang L, Zhou Y, Qiu W, Fang L, Tan R, Wen P, Yang J: The miR-200 family regulates TGF-β1-induced renal tubular epithelial to mesenchymal transition through Smad pathway by targeting ZEB1 and ZEB2 expression. Am J Physiol Renal Physiol 302: F369–F379, 2012 [DOI] [PubMed] [Google Scholar]
- 14.Wang G, Kwan BC, Lai FM, Choi PC, Chow KM, Li PK, Szeto CC: Intrarenal expression of microRNAs in patients with IgA nephropathy. Lab Invest 90: 98–103, 2010 [DOI] [PubMed] [Google Scholar]
- 15.Wang G, Kwan BC, Lai FM, Choi PC, Chow KM, Li PK, Szeto CC: Intrarenal expression of miRNAs in patients with hypertensive nephrosclerosis. Am J Hypertens 23: 78–84, 2010 [DOI] [PubMed] [Google Scholar]
- 16.Dai Y, Sui W, Lan H, Yan Q, Huang H, Huang Y: Comprehensive analysis of microRNA expression patterns in renal biopsies of lupus nephritis patients. Rheumatol Int 29: 749–754, 2009 [DOI] [PubMed] [Google Scholar]
- 17.Lu J, Kwan BC, Lai FM, Tam LS, Li EK, Chow KM, Wang G, Li PK, Szeto CC: Glomerular and tubulointerstitial miR-638, miR-198 and miR-146a expression in lupus nephritis. Nephrology (Carlton) 17: 346–351, 2012 [DOI] [PubMed] [Google Scholar]
- 18.Liu Q, Liu S, Shi Y, Li H, Hao J, Xing L, Cao Y, Duan H: Suppressors of cytokine signaling inhibit tubular epithelial cell-myofibroblast transdifferentiation. Am J Nephrol 34: 142–151, 2011 [DOI] [PubMed] [Google Scholar]
- 19.Shi Y, Zhang Y, Wang C, Du C, Zhao S, Qi Z, Zhang Q, Duan H: Suppressor of cytokine signaling-1 reduces high glucose-induced TGF-beta1 and fibronectin synthesis in human mesangial cells. FEBS Lett 582: 3484–3488, 2008 [DOI] [PubMed] [Google Scholar]
- 20.Fujimoto M, Tsutsui H, Xinshou O, Tokumoto M, Watanabe D, Shima Y, Yoshimoto T, Hirakata H, Kawase I, Nakanishi K, Kishimoto T, Naka T: Inadequate induction of suppressor of cytokine signaling-1 causes systemic autoimmune diseases. Int Immunol 16: 303–314, 2004 [DOI] [PubMed] [Google Scholar]
- 21.Alexakis C, Maxwell P, Bou-Gharios G: Organ-specific collagen expression: Implications for renal disease. Nephron, Exp Nephrol 102: e71–e75, 2006 [DOI] [PubMed] [Google Scholar]
- 22.Nakashima T, Yokoyama A, Onari Y, Shoda H, Haruta Y, Hattori N, Naka T, Kohno N: Suppressor of cytokine signaling 1 inhibits pulmonary inflammation and fibrosis. J Allergy Clin Immunol 121: 1269–1276, 2008 [DOI] [PubMed] [Google Scholar]
- 23.Ortiz-Muñoz G, Lopez-Parra V, Lopez-Franco O, Fernandez-Vizarra P, Mallavia B, Flores C, Sanz A, Blanco J, Mezzano S, Ortiz A, Egido J, Gomez-Guerrero C: Suppressors of cytokine signaling abrogate diabetic nephropathy. J Am Soc Nephrol 21: 763–772, 2010 [DOI] [PMC free article] [PubMed] [Google Scholar]
- 24.Shankland SJ, Pippin JW, Reiser J, Mundel P: Podocytes in culture: Past, present, and future. Kidney Int 72: 26–36, 2007 [DOI] [PubMed] [Google Scholar]
- 25.Boor P, Ostendorf T, Floege J: Renal fibrosis: Novel insights into mechanisms and therapeutic targets. Nat Rev Nephrol 6: 643–656, 2010 [DOI] [PubMed] [Google Scholar]
- 26.García-Sánchez O, López-Hernández FJ, López-Novoa JM: An integrative view on the role of TGF-beta in the progressive tubular deletion associated with chronic kidney disease. Kidney Int 77: 950–955, 2010 [DOI] [PubMed] [Google Scholar]
- 27.Landgraf P, Rusu M, Sheridan R, Sewer A, Iovino N, Aravin A, Pfeffer S, Rice A, Kamphorst AO, Landthaler M, Lin C, Socci ND, Hermida L, Fulci V, Chiaretti S, Foà R, Schliwka J, Fuchs U, Novosel A, Müller RU, Schermer B, Bissels U, Inman J, Phan Q, Chien M, Weir DB, Choksi R, De Vita G, Frezzetti D, Trompeter HI, Hornung V, Teng G, Hartmann G, Palkovits M, Di Lauro R, Wernet P, Macino G, Rogler CE, Nagle JW, Ju J, Papavasiliou FN, Benzing T, Lichter P, Tam W, Brownstein MJ, Bosio A, Borkhardt A, Russo JJ, Sander C, Zavolan M, Tuschl T: A mammalian microRNA expression atlas based on small RNA library sequencing. Cell 129: 1401–1414, 2007 [DOI] [PMC free article] [PubMed] [Google Scholar]
- 28.Yamamoto T, Noble NA, Cohen AH, Nast CC, Hishida A, Gold LI, Border WA: Expression of transforming growth factor-beta isoforms in human glomerular diseases. Kidney Int 49: 461–469, 1996 [DOI] [PubMed] [Google Scholar]
- 29.Onetti Muda A, Feriozzi S, Rahimi S, Faraggiana T: Expression of TGF-beta receptors type I and II in human glomerulonephritis. Nephrol Dial Transplant 13: 279–284, 1998 [DOI] [PubMed] [Google Scholar]
- 30.Goumenos DS, Tsamandas AC, Oldroyd S, Sotsiou F, Tsakas S, Petropoulou C, Bonikos D, El Nahas AM, Vlachojannis JG: Transforming growth factor-beta(1) and myofibroblasts: A potential pathway towards renal scarring in human glomerular disease. Nephron 87: 240–248, 2001 [DOI] [PubMed] [Google Scholar]
- 31.Ghisi M, Corradin A, Basso K, Frasson C, Serafin V, Mukherjee S, Mussolin L, Ruggero K, Bonanno L, Guffanti A, De Bellis G, Gerosa G, Stellin G, D’Agostino DM, Basso G, Bronte V, Indraccolo S, Amadori A, Zanovello P: Modulation of microRNA expression in human T-cell development: Targeting of NOTCH3 by miR-150. Blood 117: 7053–7062, 2011 [DOI] [PubMed] [Google Scholar]
- 32.Watanabe A, Tagawa H, Yamashita J, Teshima K, Nara M, Iwamoto K, Kume M, Kameoka Y, Takahashi N, Nakagawa T, Shimizu N, Sawada K: The role of microRNA-150 as a tumor suppressor in malignant lymphoma. Leukemia 25: 1324–1334, 2011 [DOI] [PubMed] [Google Scholar]
- 33.Hedrich CM, Tsokos GC: Epigenetic mechanisms in systemic lupus erythematosus and other autoimmune diseases. Trends Mol Med 17: 714–724, 2011 [DOI] [PMC free article] [PubMed] [Google Scholar]
- 34.Krupa A, Jenkins R, Luo DD, Lewis A, Phillips A, Fraser D: Loss of MicroRNA-192 promotes fibrogenesis in diabetic nephropathy. J Am Soc Nephrol 21: 438–447, 2010 [DOI] [PMC free article] [PubMed] [Google Scholar]
- 35.van Rooij E, Sutherland LB, Thatcher JE, DiMaio JM, Naseem RH, Marshall WS, Hill JA, Olson EN: Dysregulation of microRNAs after myocardial infarction reveals a role of miR-29 in cardiac fibrosis. Proc Natl Acad Sci U S A 105: 13027–13032, 2008 [DOI] [PMC free article] [PubMed] [Google Scholar]
- 36.Shi Y, Du C, Zhang Y, Ren Y, Hao J, Zhao S, Yao F, Duan H: Suppressor of cytokine signaling-1 ameliorates expression of MCP-1 in diabetic nephropathy. Am J Nephrol 31: 380–388, 2010 [DOI] [PubMed] [Google Scholar]
- 37.Yoshida T, Ogata H, Kamio M, Joo A, Shiraishi H, Tokunaga Y, Sata M, Nagai H, Yoshimura A: SOCS1 is a suppressor of liver fibrosis and hepatitis-induced carcinogenesis. J Exp Med 199: 1701–1707, 2004 [DOI] [PMC free article] [PubMed] [Google Scholar]
- 38.Metcalf D, Mifsud S, Di Rago L, Nicola NA, Hilton DJ, Alexander WS: Polycystic kidneys and chronic inflammatory lesions are the delayed consequences of loss of the suppressor of cytokine signaling-1 (SOCS-1). Proc Natl Acad Sci U S A 99: 943–948, 2002 [DOI] [PMC free article] [PubMed] [Google Scholar]
- 39.Zeisberg M, Neilson EG: Mechanisms of tubulointerstitial fibrosis. J Am Soc Nephrol 21: 1819–1834, 2010 [DOI] [PubMed] [Google Scholar]
- 40.Saxena V, Lienesch DW, Zhou M, Bommireddy R, Azhar M, Doetschman T, Singh RR: Dual roles of immunoregulatory cytokine TGF-beta in the pathogenesis of autoimmunity-mediated organ damage. J Immunol 180: 1903–1912, 2008 [DOI] [PMC free article] [PubMed] [Google Scholar]
- 41.Hammad AM, Youssef HM, El-Arman MM: Transforming growth factor beta 1 in children with systemic lupus erythematosus: A possible relation with clinical presentation of lupus nephritis. Lupus 15: 608–612, 2006 [DOI] [PubMed] [Google Scholar]
- 42.Jin T, Almehed K, Carlsten H, Forsblad-d’Elia H: Decreased serum levels of TGF-β1 are associated with renal damage in female patients with systemic lupus erythematosus. Lupus 21: 310–318, 2012 [DOI] [PubMed] [Google Scholar]
- 43.Xing Q, Su H, Cui J, Wang B: Role of Treg cells and TGF-β1 in patients with systemic lupus erythematosus:A possible relation with lupus nephritis. Immunol Invest 41: 15–27, 2012 [DOI] [PubMed] [Google Scholar]
- 44.Mao H, Li Z, Zhou Y, Li Z, Zhuang S, An X, Zhang B, Chen W, Nie J, Wang Z, Borkan SC, Wang Y, Yu X: HSP72 attenuates renal tubular cell apoptosis and interstitial fibrosis in obstructive nephropathy. Am J Physiol Renal Physiol 295: F202–F214, 2008 [DOI] [PMC free article] [PubMed] [Google Scholar]
- 45.Sakairi T, Abe Y, Kopp JB: TGF-beta1 reduces Wilms’ tumor suppressor gene expression in podocytes. Nephrol Dial Transplant 26: 2746–2752, 2011 [DOI] [PMC free article] [PubMed] [Google Scholar]
Associated Data
This section collects any data citations, data availability statements, or supplementary materials included in this article.


