

Abstract
Rabies, as the oldest known infectious disease, remains a serious threat to public health worldwide. The eukaryotic cytosolic chaperonin TRiC/CCT complex facilitates the folding of proteins through ATP hydrolysis. Here, we investigated the expression, cellular localization, and function of neuronal CCTγ during neurotropic rabies virus (RABV) infection using mouse N2a cells as a model. Following RABV infection, 24 altered proteins were identified by using two-dimensional electrophoresis and mass spectrometry, including 20 upregulated proteins and 4 downregulated proteins. In mouse N2a cells infected with RABV or cotransfected with RABV genes encoding nucleoprotein (N) and phosphoprotein (P), confocal microscopy demonstrated that upregulated cellular CCTγ was colocalized with viral proteins N and P, which formed a hollow cricoid inclusion within the region around the nucleus. These inclusions, which correspond to Negri bodies (NBs), did not form in mouse N2a cells only expressing the viral protein N or P. Knockdown of CCTγ by lentivirus-mediated RNA interference led to significant inhibition of RABV replication. These results demonstrate that the complex consisting of viral proteins N and P recruits CCTγ to NBs and identify the chaperonin CCTγ as a host factor that facilitates intracellular RABV replication. This work illustrates how viruses can utilize cellular chaperonins and compartmentalization for their own benefit.
INTRODUCTION
Rabies virus (RABV), the prototype of the Lyssavirus genus, is a neurotropic virus that almost exclusively invades neurons (1) and causes rabies disease that is fatal in almost 100% of cases. As the oldest known infectious disease, rabies remains incurable but preventable by pre- and postinfection vaccine therapy (2). Currently, approximately 15,000,000 individuals receive postexposure prophylaxis annually for rabies, which is responsible for over 55,000 human deaths globally each year (3). Therefore, rabies remains a serious threat to public health worldwide, especially in developing countries.
The life cycle of RABV progresses in the cytoplasm with transcription of the five viral genes encoding nucleoprotein (N), matrix protein (M), phosphoprotein (P), glycoprotein (G), and large protein (L). Aggregates called Negri bodies (NBs) form during RABV replication, as first described in 1903 by Adelchi Negri, an Italian pathologist and microbiologist (4). NBs resemble the intranuclear Cowdry bodies in herpesvirus-infected cells (5) and Guarnieri bodies in the cytoplasm of poxvirus-infected cells (6). Several research groups reported that NBs are characterized by the accumulation of viral nucleocapsid proteins (7–9) and also contain endothelial nitric oxide synthase (eNOS) (10) and Hsp70 (11). Recently published data demonstrated that NBs are sites of viral transcription and replication (12).
Researchers are paying increasingly close attention to the role of host factors in virus replication by using comparative proteomic approaches. Host factors related to infection have been identified for approximately 20 viruses. Several critical host proteins, such as BAG3 (13), cyclophilin A (14), Hsp90 (15), RACK1 (16), and desmin (17), have been shown to be involved in virus replication and carcinogenesis. In the past decade, multiple studies have been carried out in different laboratories to investigate the host response to RABV infection at the transcriptional (18–20) and translational levels (21–24). The cellular chaperone protein Hsp70 was reported to be incorporated into rabies virions (25), and TLR3 is a major host molecule involved in the spatial arrangement of RABV-induced NBs and viral replication (26). However, less is known about whether other host factors are involved in RABV replication.
The eukaryotic cytosolic chaperonin TRiC/CCT is a large complex comprised of two stacked rings of eight subunits (CCT1 to -8) each that facilitates the folding of proteins through ATP hydrolysis (27). The folding of several mammalian proteins mediated by TRiC/CCT, such as tubulin, actin, WD-repeat proteins, cyclin E, Cdc20, and von Hippel-Lindau tumor suppressor protein, has been identified. Chaperonin CCT also plays critical roles in the nervous system and is ultimately required for the morphogenesis and survival of sensory neurons of the retina (28). In zebrafish, chaperonin CCTγ specifically controls retinotectal development (29). With regard to functions in the virus life cycle, t-complex polypeptide 1 (TCP-1) may be involved in hepatitis B virus capsid assembly (30), while CCT5 participates in hepatitis C virus (HCV) RNA replication and virion production by its interaction with NS5B (31). CCTβ is known to associate with influenza virus RNA polymerase subunit PB2 (32), and the chaperonins TCP-1 γ and ε interact with the Gag polyprotein of retrovirus type D and nuclear protein EBNA-3 of Epstein-Barr virus, respectively (33, 34). However, the exact mechanism of CCT function in the RABV life cycle has yet to be determined, and the intrinsic in vivo events leading to the recruitment of CCT to the aggregation site remain poorly understood.
In the present study, we analyzed the differentially expressed host protein profiles using mouse N2a cells as a RABV infection model and further investigated the association between NBs involved in viral transcription and replication and the chaperone protein CCTγ, as well as the functions of this host factor.
MATERIALS AND METHODS
Cells and viruses.
Mouse neuroblastoma N2a cells (a gift of professor Xiaofeng Guo, South China agricultural University, Guangzhou, People's Republic of China) and 293T cells (ATCC, Rockville, MD, USA) were cultured at 37°C with 5% CO2 in Dulbecco's modified Eagle's medium (DMEM) supplemented with 10% heat-inactivated fetal bovine serum (Gibco/Invitrogen, Carlsbad, CA, USA). All media were supplemented with penicillin (100 U/ml) and streptomycin (100 μg/ml). The RABV HEP-Flury strain was stored in our laboratory and propagated in N2a cell monolayers for two-dimensional electrophoresis (2-DE) sample preparation.
Antibodies and reagents.
Rabbit polyclonal antibodies (PAb) against TCP-1 γ (H-300, CCTγ), Hsp90, and glyceraldehyde-3-phosphate dehydrogenase (GAPDH) were purchased from Santa Cruz Biotechnology (Santa Cruz, CA, USA), Abcam (Cambridge, MA, USA), and Hangzhou GoodHere Biotechnology Co. Ltd. (Hangzhou, China), respectively. Mouse monoclonal antibody (MAb) anti-Flag M2 antibody was purchased from Sigma-Aldrich (Mission collection, St. Louis, MO, USA). Mouse MAbs to N and P proteins of RABV, as well as rabbit PAb to N protein of RABV, were prepared in our laboratory. Urea, thiourea, sodium dodecyl sulfate (SDS), glycine, Tris, Biolyte (pH 3 to 10), iodoacetamide, dithiothreitol (DTT), low-melting-temperature agarose, CHAPS {3-[(3-cholamidopropyl)-dimethylammonio]-1-propanesulfonate}, and 24-cm ReadyStrip immobilized pH gradient (IPG) strips (linear, pI 5 to 8) were all from Bio-Rad Laboratories (Hercules, CA, USA).
In vitro cell infection and sample preparation.
Sample preparation was carried out according to a previously described method (35, 36). Briefly, N2a cells were grown in T-flasks (75 cm2, 15-ml working volume) to 80 to 90% confluence before being infected with the RABV Flury strain at a multiplicity of infection (MOI) of 1. The cells were harvested at 12, 48, and 96 h postinfection (h.p.i.) with a cell scraper and centrifuged at 20,000 × g for 5 min. The pellet was washed 3 times with prechilled 0.25 M sucrose Tris buffer (pH 7.0).
The cell pellet was disrupted in lysis buffer, which contained 7 M urea, 2 M thiourea, 4% (wt/vol) CHAPS, and 65 mM DTT and was supplemented with 0.2% Biolyte 3/10, 1 mM phenylmethylsulfonyl fluoride (PMSF), 20 units/ml DNase I, and 0.25 mg/ml RNase A before use. The mixture was vortexed for 1 h and sonicated on ice for 20 min, followed by centrifugation at 20,000 × g for 1 h at 4°C. The supernatant was kept at −80°C until used. The protein concentration of all samples diluted 1:10 was determined by the Bradford method (37) with 0.5 mg/ml bovine serum albumin (BSA) as the standard for quantitation.
2-DE and image analysis.
2-DE procedures were carried out as described previously (35) with minor modifications. The first dimension of 2-DE was performed in the Protean isoelectric focusing (IEF) cell (Bio-Rad) with commercial 24-cm-long ReadyStrip IPG strips (pH 5 to 8, linear; Bio-Rad) according to the manufacturer's instructions. A total of 250 μg of protein was loaded onto each IPG strip. The following parameter settings and conditions for active rehydration of the IPG strips and IEF were modified from a previously described method (35, 38): constant temperature at 17°C and (i) 50 V for 14 h; (ii) 250 V, linear, for 1 h; (iii) 1,000 V, rapid, for 1 h; (iv) 10,000 V, linear, for 5 h; and (v) 10,000 V, rapid, for 90,000 V-h. After the IEF, the isoelectric-focused strips were incubated for 15 min in an equilibration buffer (6 M urea, 30% glycerol, 2% SDS, and 0.375 M Tris, pH 8.8) containing 1% DTT and then incubated for 15 min in an equilibration buffer containing 2.5% iodoacetamide. The equilibrated IPG strips were sealed with 1% low melting-point agarose in SDS running buffer (supplemented with 0.001% bromophenol blue marker) on top of the gels and further resolved by 11% SDS-polyacrylamide gel electrophoresis (PAGE) at 80 V for 45 min and then 200 V until the dye front reached the end of the gels. The gels were stained by the modified silver-staining method compatible with mass spectrometry (MS) (39) and scanned at a resolution of 500 dots per inch using the ImageScanner III (GE Healthcare, USA). Spot detection, spot matching, and quantitative intensity analysis were carried out with PDQuest 2-D analysis software 8.0.1 according to the manufacturer's protocol (Bio-Rad). The gel images were normalized according to the total quantity in the analysis set. Comparison of the relative intensities of the spots between RABV-infected and mock-infected groups at three time points (four replicates for each group) was analyzed by Student's t test. Only the spots with intensity ratios (infected versus uninfected group) larger than 2.0 (P ≤ 0.05) or smaller than 0.5 (P ≤ 0.05) were considered to have significantly changed due to infection and subjected to identification by MS.
In-gel tryptic digestion.
Differentially expressed protein spots were excised from the silver-stained gels, transferred to a V-bottom 96-well microplate, and washed with 100 μl 50% (vol/vol) acetonitrile (ACN) in 25 mM ammonium bicarbonate for 1 h. The following procedure was performed as previously described (35, 36). Briefly, after being dehydrated with 100 μl of 100% ACN for 20 min, gel plugs were thoroughly dried in a SpeedVac concentrator (Thermo Savant, Holbrook, NY, USA) for 30 min. The dried gel particles were treated with 2 μl/well of trypsin (Promega, Madison, WI) in 25 mM ammonium bicarbonate at 4°C for 45 min for rehydration and then incubated at 37°C for 12 h. Following the trypsin digestion, the peptide mixtures were extracted by 8 μl/well of extraction solution (0.5% TFA, 50% ACN) at 37°C for 1 h. Finally, the extracts were dried under the protection of N2.
MS analysis and database searches.
Matrix-assisted laser desorption ionization–time of flight (MALDI-TOF) MS and tandem TOF (TOF/TOF) MS were performed at the Proteomic Core Facility, Fudan University, China, as described previously (35, 36). Mixtures of the peptide were redissolved in 0.8 μl of matrix solution (α-cyano-4-hydroxycinnamic acid [Sigma, St. Louis, MO, USA] in 0.1% TFA, 50% ACN) and then spotted on the MALDI plate. After air drying, samples were analyzed on a 4700 Proteomics Analyzer (Applied Biosystems, Foster City, CA, USA). The trypsin-digested peptides of myoglobin with internal calibration mode to calibrate the mass instrument were added to the six calibration spots on the MALDI plate. An accelerating voltage of 20 kV was applied to the sample plate. The UV laser was operated at a 200-Hz repetition rate with a wavelength of 355 nm. Data interpretation of acquired MS and tandem MS (MS/MS) peptide spectra were carried out with Data Explorer software version 4.5 (Applied Biosystems) in default mode. Parent mass peaks with a mass range of 700 to 3,200 Da and minimum signal-to-noise ratio of 20 were selected for TOF/TOF analysis. The MS and MS/MS spectra generated were subsequently submitted to MASCOT (version 2.1, Matrix Science, London, United Kingdom) by GPS Explorer software (version 3.6, Applied Biosystems). The parameters for searches were as follows: National Center for Biotechnology Information nonredundant (NCBInr) database (release date 2009), taxonomy of mouse and viruses, carbamidomethylation selected as a fixed modification, peptide mass tolerance of 100 ppm; MS/MS ion mass tolerance of 0.6 Da, maximum of one missed cleavage; and tryptic digestion. Modifications included methionine oxidation. Known contaminant ions (human keratin and tryptic autodigest peptides) were excluded. In total, 11,505,486 sequences and 3,925,745,078 residues in the database were actually searched. MASCOT protein scores (based on combined MS and MS/MS spectra) of greater than 64 were considered statistically significant (P ≤ 0.05). The individual MS/MS spectrum with a statistically significant (confidence interval of ≥95%) ion score (based on MS/MS spectra) was accepted. Only proteins with a significant ion score or an ion score above 21 were reported. To eliminate the redundancy of proteins that appeared in the database under different names and accession numbers, the single protein member belonging to the Mus musculus species or with the highest protein score (top rank) was separated from the multiprotein family.
Quantitative real-time PCR.
To validate the results of the differential proteome analysis at the mRNA level, specific primers (Table 1) were designed to simultaneously amplify various target genes corresponding to the MS/MS-identified proteins and RABV-encoded proteins. Quantitative real-time PCR was performed using cDNA from N2a cells (12, 48, and 96 h.p.i.) as the template with a RevertAid first strand cDNA synthesis kit (Fermentas). cDNA synthesis was performed with 1 μg RNA using oligo(dT) primers (100 ng). The quantitative real-time PCR was performed on the 7500 real-time PCR system (Applied Biosystems) in a total volume of 20 μl containing 200 ng of cDNA template, 200 nM each primer, and 1× SYBR premix Ex Taq (perfect real time, TaKaRa, Dalian, China). The target genes were amplified in triplicate with the following conditions: an initial denaturation at 95°C for 10 min and 40 cycles of 95°C for 10 s, 60°C for 30 s, and 72°C for 10 s. Melting curves were obtained, and quantitative analysis of the data was performed using the 7500 system SDS software version 1.3.1 with a relative quantification (cycle threshold [ΔΔCT]) method (Applied Biosystems). The uniqueness and sizes of PCR products were confirmed by generating melting curves. N2a cells mock infected in parallel were used as controls.
Table 1.
Primers designed for quantitative real-time PCR
| Gene | Forward primer (5′→3′) | Reverse primer (5′→3′) | Length (bp) | GenBank accessionno. |
|---|---|---|---|---|
| HSP90 | ATAGGCTTGTGTCTTCACCCTGCT | AGCCCATTGTAGAGTTGTCTCGCA | 111 | S46109 |
| CCTγ | GCAAGTGTGCCGCAATGTTCTACT | TGTTCCACACCAGTCATGGCCTTA | 117 | NM_009836 |
| CCTθ | GCAGGCACTGGTGCAAATGTCATA | TGTCCCATTTCTTCTTGGACGGGA | 188 | AK172867 |
| Prph1 | AAAGACGACTGTGCCTGAGATGGA | AAGACTTGTCCAGGTCACTGTGCT | 143 | BC046291 |
| ACTB | TGTGATGGTGGGAATGGGTCAGAA | TGTGGTGCCAGATCTTCTCCATGT | 140 | X03765 |
| Srm | ACCAGCTCATGAAGACAGCACTCA | TGCTACACAGCATGAAGCCGATCT | 189 | L19311 |
| EIF2S2 | TTGCACCCACCAGGATAAGGACAT | ACAGCAGGGCTAACTGACTGTTCT | 101 | NM_026030 |
| DLST | TGGTGTGAGCATGTTCTGGGAAGA | ATGACACCATCATCTCGTCGCTGT | 166 | NM_030225.4 |
| OAS1B | ATGCCTTCATCCTCCCTTCCAGTT | TTAGCCATGGTTCCGGATCACACA | 100 | AM887912 |
| PSMA6 | ACGGAAAGCATTGGCTGTGTGATG | TCATACAACAACCGAGTGGCCTCA | 199 | NM_011968 |
| SEPT2b | TGTGCTTTCATTTGCTGCAGGAGG | TGCAATGTGAAGAGGCAAAGCGAG | 168 | NM_001159718 |
| HNRPDL | TTGGAGGCTTGAGCTGGGATACAA | ATCTTCCCGTGACTGGGTCTGTTT | 108 | BC021374 |
| SET | ACGAAGGCGAGGATGATTAGCACA | ACAGGGAGGAAAGGACTGCAACTT | 119 | BX005298.9 |
| GAPDH | TCAACAGCAACTCCCACTCTTCCA | ACCCTGTTGCTGTAGCCGTATTCA | 115 | NM_008084 |
Immunoblotting.
Samples of RABV-infected and mock-infected N2a cells were lysed at 12, 48, and 96 h.p.i., and the protein concentrations were determined by the Bradford assay as described above. Equivalent amounts of cell lysates (80 μg) were subjected to 12% SDS-PAGE and then transferred to nitrocellulose membranes (Hybond-C extra; Amersham Biosciences, USA). After blocking with 5% skimmed milk in phosphate-buffered saline (PBS) with 0.05% Tween 20 for 1 h, the membranes were incubated with mouse MAb to RABV N or rabbit PAb against CCTγ at 37°C for 2 h, followed by horseradish peroxidase (HRP)-conjugated goat anti-mouse IgG or goat anti-rabbit IgG (Kirkegaard & Perry Laboratories, Inc. [KPL], Gaithersburg, MD, USA) at 37°C for 1 h. Finally, the blots were developed with SuperSignal West Femto maximum sensitivity substrate (Thermo Fisher Scientific, Rockford, IL, USA).
Double-staining immunofluorescence and nuclear staining.
After RABV- and mock-infected N2a cells were cultured for 48 h, they were washed once with PBS, fixed with cold acetone-methanol (1/1) for 20 min at −20°C, and then allowed to be air dried. The fixed cells were incubated with a mixture of MAbs against the proteins N and P of RABV, rabbit anti-N PAb and PAb to CCTγ (Santa Cruz), or PAb to Hsp90 (Abcam). Nuclei were stained with 4′,6-diamidino-2-phenylindole (DAPI) for indirect immunofluorescence assay (IFA). Viral proteins were detected by incubation with tetramethyl rhodamine isocyanate (TRITC)-conjugated goat anti-mouse secondary antibody (KPL), and the host proteins were detected by incubation with fluorescein isothiocyanate (FITC)-conjugated goat anti-rabbit secondary antibody (KPL). The triple-stained cells were washed 5 times with PBS-Tween 20 and subsequently examined under a laser confocal microscope. Confocal images were acquired using an inverted Leica TCS SP5 microscope with proper excitation laser wavelengths.
Construction of plasmids and DNA transfection.
The full-length N and P genes of RABV and the CCTγ gene were amplified via PCR from the cDNA of RABV-infected N2a cells and then cloned into pCI-neo (Promega, WI, USA), pCMV-N-Flag (Clontech, CA, USA), and pCMV-N-HA (Clontech, CA, USA) by using the XhoI/XbaI, EcoRI/SalI, and EcoRI/XhoI cloning sites, respectively. The specific primer sequences for the P gene are as follows: for the pCI-neo construct, forward primer 5′-GCCGAATTCATGAGCAAGATCTTTGTC-3′ and reverse primer 5′-GACGTCGACTTAGCAAGATGTATAGCG-3′ (EcoRI and SalI restriction sites are underlined), and for the pCMV-N-Flag construct, forward primer 5′-GGAATTCGGATGAGCAAGATCTTTGTTAATCCGAGTG-3′ and reverse primer 5′-CCCTCGAGTTAGCATGATTTGTAGCGATCCAAGTCAT-3′ (EcoRI and XhoI restriction sites are underlined). The specific primer sequences for the N gene are as follows: for the pCI-neo construct, forward primer 5′-GAACTCGAGATGGATGCCGACAAGATT-3′ and reverse primer 5′-GCTCTAGATTATGAGTCACTCGAATACGTT-3′ (XhoI and XbaI restriction sites are underlined), and for the pCMV-N-Flag construct, forward primer 5′-GGAATTCGGATGGATGCCGACAAGATTGTGTT-3′ and reverse primer 5′-CCCTCGAGTTATGAGTCACTCGAATACGTTTTGTT-3′ (EcoRI and XhoI restriction sites are underlined). The specific primer sequences for the CCTγ gene are as follows: for the pCI-neo construct, forward primer 5′-GGAATTCATGATGGGCCACCGTC-3′ and reverse primer 5′-GCTCTAGATCACTCCTGGCCAGCAT-3′ (EcoRI and XbaI restriction sites are underlined), and for the pCMV-N-HA construct, forward primer 5′-GGAATTCGGATGATGGGCCACCGTCCAGTGCT-3′ and reverse primer 5′-CCCTCGAGTCACTCCTGGCCAGCATCTGGAG-3′ (EcoRI and XhoI restriction sites are underlined). All constructs were verified by DNA sequencing.
One day prior to DNA transfections, N2a cells and 293T cells were seeded into 96-well plates (Corning, NY, USA) or 35-mm glass bottom dishes (Shengyou Biotechnology Co. Ltd., Hangzhou, China), and the resultant vectors were cotransfected into the N2a cells and 293T cells using Lipofectamine 2000 reagent (Invitrogen) for transient protein expression. Two days later, cells were washed twice with PBS and fixed with ice-cold acetone-methanol (1/1) for subsequent use in IFA. N2a cells and 293T cells transfected with empty vectors pCI-neo, pCMV-N-HA, and pCMV-N-Flag were used as negative controls.
Coimmunoprecipitation assay.
The coimmunoprecipitation assay was conducted with a minor modification as stated previously (36). Briefly, at 48 h after infection or cotransfection, N2a cells inoculated with the Flury strain of RABV and 293T cells cotransfected with the vectors pCMV-HA-CCTγ and pCMV-Flag-P or pCMV-Flag-N were lysed with NP-40 lysis buffer (Beyotime, Jiangsu, China). The lysate supernatant was incubated with the MAb against RABV viral protein N or P, anti-Flag, and antihemagglutinin MAbs overnight at 4°C, respectively. Immune complexes were precipitated by incubation with protein A/G Plus-agarose (Santa Cruz) for 4 h at 4°C. After being washed five times, the immunoprecipitated proteins were analyzed by Western blotting using anti-CCTγ MAb, anti-Flag MAbs, or MAb to RABV viral protein N or P, respectively.
Knockdown of cellular CCTγ by lentivirus transduction and establishment of a stable cell line expressing CCTγ shRNA.
pLKO.1-based lentiviral particles for knockdown of CCTγ (catalog number TRCN0000120448, targeting sequence CCAGTACCATTCGTCTGCTTA) and Mission nontarget small hairpin RNA (shRNA) control transduction particles (catalog number SHC002V, targeting sequence CAACAAGATGAAGAGCACCAA) were purchased from Sigma-Aldrich (Mission Collection, St. Louis, MO, USA). The N2a cells were plated in a 24-well plate with DMEM overnight, and lentivirus transduction was carried out according to the manufacturer's instructions. Hexadimethrine bromide (Sigma-Aldrich) was added to the medium (final concentration, 8 μg/ml) to enhance transduction efficiency. Lentiviral particles (MOI = 0.5) were added, and the plates were swirled gently for mixing. Puromycin dihydrochloride (5 μg/ml) was added 48 h later for 10 to 14 days of selection. After the transduction of lentiviral vectors to target cells, the validation of shRNAs was performed by Western blotting and real-time comparative quantitative PCR. The viability of N2a cells expressing CCTγ shRNA was determined using the CCK-8 assay according to the manufacturer's protocol (Sigma-Aldrich). To further analyze the function of CCTγ, a stable N2a cell line expressing CCTγ shRNA was infected with the Flury strain of RABV at an MOI of 0.1, and the supernatants were collected at 24, 36, and 48 h.p.i. The titers of viruses in the culture supernatants were determined in BHK-21 cells, and 50% tissue culture infective dose (TCID50) values were calculated by the Reed-Muench method (40). The transcript levels of the RABV genomic RNA in the infected cells were quantified by comparative and absolute real-time PCR using the specific primers 5′-AAGGAGTTGAATGACAGGGTGCCA-3′ and 5′-ACTTGGGATGGTTCGAAAGGAGGA-3′. Viral protein N was analyzed in RABV-infected cells by Western blotting assay.
To investigate which step of the RABV life cycle is affected, the stable N2a cells were treated with or without cycloheximide (CHX; Beyotime, Shanghai, China) at a dose of 100 μg/ml as described previously (41) and simultaneously infected with RABV at an MOI of 5. At 8 and 12 h.p.i., cellular total RNA was isolated from the resultant cells using TRIzol reagent following the manufacturer's protocol. Finally the viral mRNA of the RABV N gene was quantified with a relative quantification (ΔΔCT) method using the specific primers 5′-AGCAGCAATGCAGTTCTTTGAGGG-3′ and 5′-TTGTCAGTTCCATGCCTCCTGTCA-3′.
Statistical analysis.
Statistically significant differences between groups were determined using the Student t test. A P value of less than 0.05 was considered significant.
RESULTS
2-DE protein profiles of RABV infection in N2a cells.
To provide a detailed profile of changes in protein expression, RABV-inoculated N2a cell monolayers were evaluated at 12, 48, and 96 h.p.i. by indirect immunofluorescence assay (IFA) and immunoblotting. Successful virus replication was confirmed by IFA analysis of RABV-inoculated N2a cells at 48 h.p.i. (Fig. 1A). Based on the growth curve, RABV replication reached a maximum at about 48 h.p.i. with a titer of 106.55 TCID50 (Fig. 1B). In Western blot analysis, the N protein of RABV was only detected at 48 and 96 h.p.i. from RABV-infected N2a cells (Fig. 1C). These data showed that infectious RABV progeny were generated in the N2a cell monolayers.
Fig 1.

Identification of RABV-infected mouse N2a cells and representative 2-DE proteomic profiles from mock- and RABV-infected N2a cells. (A) Identification of RABV-infected mouse N2a cells by IFA using the MAb to RABV P. (B) RABV infection kinetics in N2a cells. (C) Detection of the viral N protein in RABV-infected and mock-infected N2a cells by Western blotting using a specific MAb. (D) 2-DE gel of RABV-infected N2a cells with upregulated protein spots labeled. (E) 2-DE gel of mock-infected N2a cells with downregulated protein spots marked.
Subsequently, the cellular proteins of RABV-infected N2a cells extracted at 12, 48, and 96 h.p.i. were subjected to 2-DE analysis on 24-cm gels (pI 5 to 8), and a total of 27 protein spots were found to be dynamically changed in the N2a cells based on the average intensity ratios of proteins detected (Fig. 1D and E). Among the upregulated protein spots in infected N2a cells (Fig. 2 and Table 2), 10 protein spots were newly induced at 48 h.p.i., and 10 protein spots were newly induced at 96 h.p.i. Among the downregulated protein spots (Fig. 2 and Table 2), 1 protein spot disappeared at 96 h.p.i., and 4 protein spots decreased in intensity at 96 h.p.i. In essence, most of the differentially expressed proteins were found at 48 and 96 h.p.i.
Fig 2.

Dynamic 2-DE profiles of the differentially expressed proteins in RABV-infected N2a cells. Differentially expressed protein spots are circled. N+ and N- indicate the RABV-infected and mock-infected mouse N2a cells, respectively, and numbers indicate time (h) postransfection.
Table 2.
Differentially expressed protein spots which were successfully identified by MALDI-TOF and MALDI-TOF/TOF
| Type of protein and spot no.a | Protein name | Abbreviation | Accession no.b | Mr (pred/expc) | pI (pred/exp) | Matched/unmatchedd | Abundance ratio in infected/uninfected cells (mean ±SD) at indicated time (h)e |
Coverage (%)f | Protein/best ion scoreg | Peptides identifiedh | ||
|---|---|---|---|---|---|---|---|---|---|---|---|---|
| 12 | 48 | 96 | ||||||||||
| RABV viral proteins | ||||||||||||
| 0442 | Phosphoprotein | M1 | gi|70724981 | 33.43/40.3 | 4.8/5.0 | 14/61 | NI | NI | 42 | 311/105 | IFVNPSAIR AGLADLEMAEETVDLINR NIEDNQAHLQGEPIEVDNLPEDMR | |
| 3135 | M2 protein | M2 | gi|9627200 | 23.14/25.1 | 6.34/6.1 | 6/48 | NI | NI | 25 | 114/55 | TLIFQWADSR | |
| 5679 | Nucleoprotein | NP | gi|18478987 | 50.71/55.5 | 6.37/6.7 | 20/43 | NI | NI | 52 | 204/47 | EALLYFFHK | |
| 5683 | Nucleoprotein | NP | gi|39930275 | 49.15/55.6 | 6.04/6.6 | 20/84 | NI | NI | 49 | 256/52 | FLAGTYDMFFSR | |
| 6680 | Nucleoprotein | NP | gi|38017865 | 50.73/55.3 | 6.08/6.8 | 13/75 | NI | NI | 28 | 91/20 | FLAGTYDMFFSR | |
| Microtubule-associated proteins | ||||||||||||
| 3261 | Unnamed protein product | Unnamed | gi|26355849 | 32.24/26.9 | 5.56/5.9 | 7/32 | 2.59 ± 0.35*** | 17 | 67/23 | FPGQLNADLR | ||
| 3432 | Tubulin, beta 5 | TUBB5 | gi|7106439 | 49.64/39.6 | 4.78/6.1 | 12/59 | 1.32 ± 0.54 | 3.51 ± 0.51*** | 0.63 ± 0.19 | 20 | 131/44 | FPGQLNADLR |
| 3447 | Alpha-tubulin isotype M-alpha-2 | TUBA1B | gi|202210 | 50.13/41.8 | 4.94/6.1 | 8/23 | NI | 24 | 162/50 | AVFVDLEPTVIDEVR | ||
| Intermediate filament proteins | ||||||||||||
| 1649 | Peripherin | Prph1 | gi|2253159 | 52.65/56.5 | 5.36/5.5 | 28/27 | 1.07 ± 0.37 | 2.10 ± 0.16** | ND | 57 | 228/38 | FLEQQNAALR |
| 3272 | Peripherin | Prph1 | gi|2253159 | 52.65/31.4 | 5.36/6.0 | 18/30 | 2.06 ± 0.81 | 0.46 ± 0.09*** | 38 | 136/36 | LLGSGSPSSSAR | |
| Microfilament-associated proteins | ||||||||||||
| 3375 | Putative beta-actin (amino acids 27–375) | Actb | gi|49868 | 39.16/37.1 | 5.78/6.1 | 9/37 | 2.24 ± 0.51** | 1.29 ± 0.05** | 25 | 203/70 | GYSFTTTAER QEYDESGPSIVHR | |
| Energy and metabolism | ||||||||||||
| 3461 | Isocitrate dehydrogenase 3 (NAD+) alpha, isoform CRA_d | IDH3A | gi|148693874 | 39.30/41.3 | 5.88/6.1 | 6/27 | 1.51 ± 0.68* | 2.82 ± 0.91** | 18 | 73/31 | IAEFAFEYAR | |
| 5674 | Dihydrolipoamide S-succinyltransferase (E2 component of 2-oxo-glutarate complex) | DLST | gi|21313536 | 48.96/52.1 | 9.11/6.5 | 14/117 | 0.91 ± 0.34 | 2.71 ± 0.57** | 3.26 ± 0.64*** | 31 | 176/42 | VEGGTPLFTLR NVETMNYADIER |
| 6415 | Transaldolase 1, isoform CRA_e | TALDO1 | gi|148686116 | 31.51/39.1 | 7.66/6.8 | 12/100 | 0.83 ± 0.42 | 0.74 ± 0.23 | 0.36 ± 0.14*** | 38 | 108/23 | FAADAIKLER |
| 6574 | Hypothetical protein LOC433182 | LOC433182 | gi|70794816 | 47.11/49.7 | 6.37/6.9 | 9/113 | NI | NI | 21 | 117/49 | AAVPSGASTGIYEALELR | |
| 8657 | ATP synthase, H+ transporting, mitochondrial F1 complex, alpha subunit, isoform 1, isoform CRA_h | ATP5A1 | gi|148677504 | 54.74/55.8 | 9.36/7.5 | 13/29 | 1.13 ± 0.16 | 2.31 ± 0.64** | 3.78 ± 1.37** | 25 | 98/24 | TGAIVDVPVGEELLGR |
| Signal Transduction | ||||||||||||
| 6477 | Septin 2 b | SEPT2b | gi|228480253 | 36.95/44.3 | 5.74/6.8 | 11/111 | 0.61 ± 0.22* | 1.21 ± 0.12 | 6.20 ± 1.69*** | 31 | 175/51 | STLINSLFLTDLYPER |
| RNA processing and biosynthesis | ||||||||||||
| 5454 | Chain A, crystal Structure Of mRNA decapping enzyme (Dcps) from Mus musculus at 1.83-Å resolution | DCS-1 | gi|52696229 | 40.42/38.6 | 6.25/6.7 | 11/57 | 0.71 ± 0..33 | 1.20 ± 0.12 | 2.29 ± 0.33** | 32 | 103/33 | DLTPEHLPLLR |
| 7328 | Heterogeneous nuclear ribonucleoprotein D-like | HNRPDL | gi|81917948 | 33.54/38.1 | 6.85/7.3 | 12/76 | 1.02 ± 0.23 | 1.63 ± 0.21* | 2.94 ± 0.51*** | 30 | 120/32 | GFGFVLFK DLTEYLSR |
| Cell cycle | ||||||||||||
| 2155 | SET translocation | SET | gi|123295280 | 23.1/24.91 | 5.6/5.43 | 12/39 | 0.23 ± 0.08* | 2.09 ± 0.36** | 57 | 137/24 | EQQEAIEHIDEVQNEIDR | |
| Stress response/protein folding associated proteins | ||||||||||||
| 2381 | mKIAA0002 protein | Cctθ | gi|50510319 | 60.19/37.7 | 5.44/5.6 | 6/20 | NI | 2.17 ± 0.69* | 11 | 64/32 | FAEAFEAIPR | |
| 4255 | HSP90 | HSP90 | gi|13752262 | 52.56/28.0 | 8.81/6.4 | 16/54 | NI | NI | 36 | 88/0 | ||
| 7466 | Chaperonin containing Tcp1, subunit 3 (gamma) | CCTγ | gi|6753320 | 60.59/39 | 6.28/7.3 | 15/95 | NI | NI | 31 | 65/21 | TAVETAVLLLR | |
| Immune response | ||||||||||||
| 6159 | Putative oligoadenylate synthetase 1b | OAS1B | gi|159031195 | 43.86/24.1 | 9.46/7.2 | 11/22 | NI | NI | 24 | 64/0 | ||
| Ubiquitin-proteasome pathway | ||||||||||||
| 6237 | Proteasome alpha 6 subunit | PSMA6 | gi|6755198 | 27.35/26.7 | 6.34/7.0 | 9/63 | 0.80 ± 0.16 | 0.91 ± 0.40 | 0.50 ± 0.14** | 39 | 256/72 | HITIFSPEGR AINQGGLTSVAVR ILTEAEIDAHLVALAERD |
| Protein translation and elongation | ||||||||||||
| 4518 | Eukaryotic translation initiation factor 2, subunit 2 (beta) | EIF2S2 | gi|14149756 | 38..07/51.4 | 5.61/6.3 | 10/25 | 0.95 ± 0.30 | 1.13 ± 0.02 | 18.98 ± 4.63*** | 22 | 76/28 | DYTYEELLNR |
| Macromolecular biosynthesis and metabolism | ||||||||||||
| 3379 | Spermidine synthase | Srm | gi|6678131 | 33.97/33.7 | 5.3/6.2 | 7/40 | 1.11 ± 0.26 | 0.40 ± 0.05*** | 18 | 122/31 | YQDILVFR VLIIGGGDGGVLR | |
Spot no. is the unique sample spot protein number that refers to the labels in Figure 2.
Accession no. is the MASCOT result of MALDI-TOF/TOF searched from the NCBInr database.
pred/exp, predicted/experimental.
Number of peaks that match/do not match the trypsin peptides.
Protein spots with an abundance ratio for infected/uninfected cells of less than 0.5 were downregulated, and spots with a ratio greater than 2 were upregulated. Mean, the average abundance ratio for paired protein samples; SD, standard deviation of abundance ratios of the one certain protein spot; NI, newly induced proteins in RABV-infected N2a cells; ND, protein spot was not detectable in RABV-infected N2a cells. P values from paired t test are shown as follows: *, P ≤ 0.05; **, P ≤ 0.01; ***, P ≤ 0.001.
Sequence coverage (%) is the number of amino acids spanned by the assigned peptides divided by the sequence length.
Protein score (based on combined MS and MS/MS spectra) and best ion score (based on MS/MS spectra) were from MALDI-TOF/TOF identification. The proteins that had a statistically significant protein score of great than 64 (P ≤ 0.05) were considered successfully identified.
Peptides identified by MALDI-TOF/TOF with a statistically significant ion score (confidence interval, ≥95%), or ion score above 21.
Mass spectrometry (MS) identification of differentially expressed proteins.
To identify the differentially expressed proteins in RABV-infected N2a cells, 27 protein spots with a threshold greater than 2-fold were selected for in-gel trypsin digestion and subsequent matrix-assisted laser desorption ionization–tandem time of flight (MALDI-TOF/TOF) identification, resulting in the successful identification of 27 protein spots corresponding to 24 proteins (MS and tandem MS [MS/MS] spectra are shown in Table 2; see also Fig. S1 in the supplemental material). Among these were 22 significantly upregulated protein spots matching 20 proteins (ratio for infected/mock-infected cells of ≥2, Table 2) and 5 significantly downregulated protein spots matching 4 proteins (ratio for infected/mock-infected cells of ≤0.5, Table 2). According to the annotations from the UniProt Knowledgebase (Swiss-Pro/TrEMBL) and Gene Ontology Database, the differentially expressed proteins that were identified are related to the cytoskeleton, macromolecular biosynthesis and metabolism, stress response, energy metabolism, immune response, protein translation and elongation, RNA processing and biosynthesis, signal transduction, and the ubiquitin-proteasome pathway.
Interestingly, several protein spots (e.g., nucleoprotein and peripherin) were identified as the product of the same gene, suggesting that they may have different isoforms and/or posttranslational modifications. Of note, some of the cellular proteins, such as hypothetical protein LOC433182, Hsp90, CCTγ, and OAS1B, were newly induced in RABV-infected N2a cells.
Transcriptional profiles of differentially expressed proteins during RABV infection.
To determine the reliability of our MS analysis, the genes encoding the 13 differentially expressed proteins in RABV-infected cells were selected for validation by real-time PCR (Fig. 3B) using primers shown in Table 1. The GAPDH mRNA transcript was used as an internal control housekeeping gene. Generally, the changes in abundance of most of the mRNA transcripts were consistent with those of the corresponding proteins in the 2-DE gels (Fig. 3A and Table 2). Among the genes selected for validation, the abundance of the Hsp90, CCTγ, ACTB, and OAS1B transcripts increased from 12 to 96 h.p.i., while the transcript abundance of HNRPDL only increased at 96 h.p.i. Intriguingly, a fluctuating expression pattern was observed for some gene transcripts. For example, CCTθ, Prph1, EIF2S2, DLST, PSMA6, SEPT2b, and SET were upregulated at 12 and 96 h.p.i. but downregulated at 48 h.p.i. The Srm mRNA was elevated at 12 h.p.i. but then became significantly downregulated at 48 h and 96 h.p.i. Gene expression was affected by many factors, and we have long known that the correlation between mRNA and protein abundance is typically weak. In this study, although gene transcript levels and protein expression were not absolutely consistent, the results provide information complementary to the differential proteomics data obtained with 2-DE and MS/MS.
Fig 3.
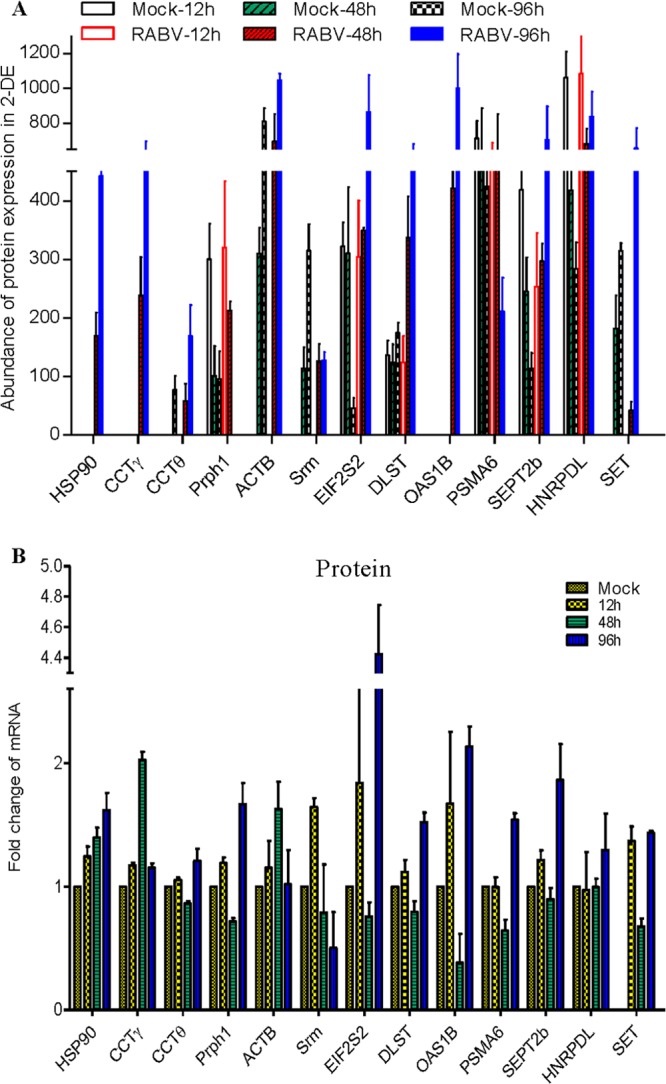
Translational and transcriptional profiling of altered proteins in RABV-infected mouse N2a cells. (A) Translational profiling of the differentially expressed proteins in 2-DE. The spot densities (total pixel intensity within spot boundaries) in 2-DE maps were carried out with PDQuest 2-D analysis software 8.0.1. (B) Total cellular mRNA of mouse N2a cells with or without RABV infection was analyzed by quantitative real-time PCR. All samples were normalized with the results for the GAPDH gene as an internal control and with the results for mock-infected N2a cells at each time point as the reference. The values are quantitation ratios of fold increase or decrease relative to the results for mock-infected cells, and mock-infected-cell transcripts were normalized to 1. Error bars represent standard deviations.
Cellular chaperonins are recruited to the viral N/P protein complex.
The 2-DE analysis showed that RABV replication induced the persistent upregulation of cellular chaperonins CCTγ and Hsp90 in mouse N2a cells (Fig. 2 and 3A). Quantitative real-time PCR also revealed that the CCTγ and Hsp90 transcripts were upregulated in N2a cells during RABV infection (Fig. 3B) compared with their levels in the mock-infected cells. Therefore, the relevance of CCTγ and Hsp90 to the localization of N or P protein of RABV was then analyzed by confocal microscopy. In RABV-infected N2a cells, the hollow ringlike inclusions containing the N (Fig. 4A) or P (Fig. 4B) viral proteins were colocalized with intracellular CCTγ and were confirmed to contain the viral protein N and P (data not shown). Meanwhile, cytosolic Hsp90 showed some colocalization with the hollow ring-like inclusions containing N (Fig. 4C) and P (Fig. 4D). However, in mock-infected N2a cells, CCTγ and Hsp90 were homogeneously distributed in the cytoplasm of N2a cells (data not shown). Similarly, confocal microscopy also showed that CCTγ colocalized with the viral protein N was a hollow circle-like structure in mouse N2a cells cotransfected with the viral N and P genes (Fig. 4E). Notably, there was no colocalization of CCTγ and Hsp90 with viral proteins in N2a cells that only expressed either N or P alone (data not shown). To further investigate whether the hollow ring-like inclusions are composed of the viral proteins N and P, N2a cells cotransfected with the viral N and P genes were labeled with MAbs to viral proteins N and P. Confocal microscopy analysis showed that the colocalization of the viral proteins N and P formed a ring-like inclusion in the cotransfected N2a cell (Fig. 4F). These results indicate that the viral N/P protein complex formed a ring-like structure similar to NBs and recruited the aggregation of intracellular chaperonin CCTγ.
Fig 4.

Subcellular distribution of CCTγ and Hsp90 in N2a cells by confocal microscopy. Immunostaining was conducted using MAbs to RABV N and P proteins followed by TRITC-conjugated IgG (red) or FITC-conjugated IgG (green) and counterstaining using rabbit antibodies to CCTγ and Hsp90 followed by FITC-conjugated IgG (green). Nuclei (Nu) were stained with DAPI (blue). The triple-stained cells were observed by confocal microscopy. (A and B) Colocalization of CCTγ with viral proteins N and P, revealing a hollow ring-like structure in RABV-infected N2a cells. (C and D) Hsp90 has some colocalization with the hollow ring-like structure containing viral N and P proteins in RABV-infected N2a cells. (E) CCTγ colocalized with viral protein N, revealing a hollow ring-like structure in mouse N2a cells cotransfected with RABV N and P genes. (F) Colocalization of viral proteins P (green) and N (red) formed a hollow cricoid-like structure (Merge) in N2a cells cotransfected with RABV N and P genes. Scale bars = 10 μm.
To detect whether CCTγ interacts directly with viral protein N or P of RABV, the coimmunoprecipitation assay was performed in the N2a cells infected with RABV and cotransfected with CCTγ and the viral gene encoding N or P. Regrettably, the coimmunoprecipitation analysis could not confirm the interaction of CCTγ and the viral protein N or P in either RABV-infected N2a cells or cotransfected N2a cells (data not shown), suggesting that interactions between CCTγ and viral protein N or P were either weak or indirect at the lowest detectable levels.
Knockdown of CCTγ results in reduction of infectious RABV progeny.
To examine the potential role of CCTγ in the life cycle of RABV, we further performed small interfering RNA (siRNA)-mediated knockdown of CCTγ. The CCTγ-specific shRNA or nontargeting control shRNA were transfected into N2a cells by lentivirus-mediated shRNA transfer to construct cell lines stably expressing the shRNAs. Western blot analysis confirmed that CCTγ expression was significantly decreased in the N2a cells transfected with CCTγ shRNA (Fig. 5A). To exclude the possibility that the viability of CCTγ-silenced cells is affected, the viability of shCCTγ-transfected N2a cells was detected by CCK-8 assay. The results showed that the viability of shCCTγ-transfected N2a cells was decreased slightly in comparison with that of N2a and nontargeting-shc002v-transfected N2a cells (P > 0.05) (Fig. 5B). Subsequently, CCTγ-silenced N2a cells were inoculated with the Flury strain of RABV at a multiplicity of infection of 0.1, and RABV replication was assessed by determining the virus titer (TCID50) and performing real-time reverse transcription (RT)-PCR. The data showed that the virus titer and viral genomic RNA of RABV were significantly decreased (P < 0.01) in CCTγ-silenced N2a cells (Fig. 5C and E) compared to the results for the parental N2a cells and N2a-shcoo2v cells (transfected with nontargeting shRNA). Also, Western blot analysis showed that the expression of RABV N protein in CCTγ-silenced N2a cells was significantly decreased (P < 0.01) in comparison with its expression in the parental N2a cells and N2a-shcoo2v cells (Fig. 5D). Further transcriptional analysis of the viral N gene demonstrated that the mRNA of the RABV N gene was significantly downregulated in CCTγ-silenced N2a cells treated with or without CHX (P < 0.01) (Fig. 5F), indicating that CCTγ affected RABV replication at the mRNA level. Collectively, our data show that CCTγ is a host factor that is required for the transcription and replication of RABV. Correspondingly, RABV replication was monitored by performing quantitative real-time PCR and determining the virus titer for CCTγ-overexpressing N2a cells. As shown by the results in Figure 6, the virus titer in the cell supernatants and cellular viral genomic RNA had no significant changes (P > 0.05) in CCTγ-overexpressing N2a cells, indicating that RABV replication was not upregulated in CCTγ-overexpressing N2a cells.
Fig 5.

CCTγ knockdown inhibits RABV replication and transcription. (A) Western blotting of CCTγ-silenced N2a cells. (-)shRNA, no shRNA. (B) Viability assay of CCTγ-silenced N2a cells. Cell viability is expressed as the percentage of (-)shRNA N2a cells. (C) Growth curve of RABV in CCTγ-silenced N2a cells. N2a cells only transfected with nontargeting shRNA shcoo2v or CCTγ-specific shRNA, as well as no shRNA, used as positive control [(-)shRNA], were infected at an MOI of 0.1. At 48 h.p.i., the virus titer in cells transfected with CCTγ-specific shRNA decreased nearly 20-fold in comparison with that in cells transfected with nontargeting shRNA shcoo2v. (D) Expression of RABV N protein in N2a cells as determined by Western blotting. (E) Quantitation of RABV genomic RNA by quantitative real-time PCR. The genomic RNA of RABV in shRNA-silenced cells was decreased ∼80% (P < 0.01) in comparison with that in cells transfected with nontargeting shRNA shcoo2v. (F) The mRNA transcripts of RABV N gene as determined by real-time comparative quantitative PCR. The transcription of RABV N was decreased significantly after silencing of CCTγ, although CHX interfered significantly in the N2a cells transfected with and without CCTγ-specific shRNA. Values are means ± standard deviations of three independent experiments.
Fig 6.
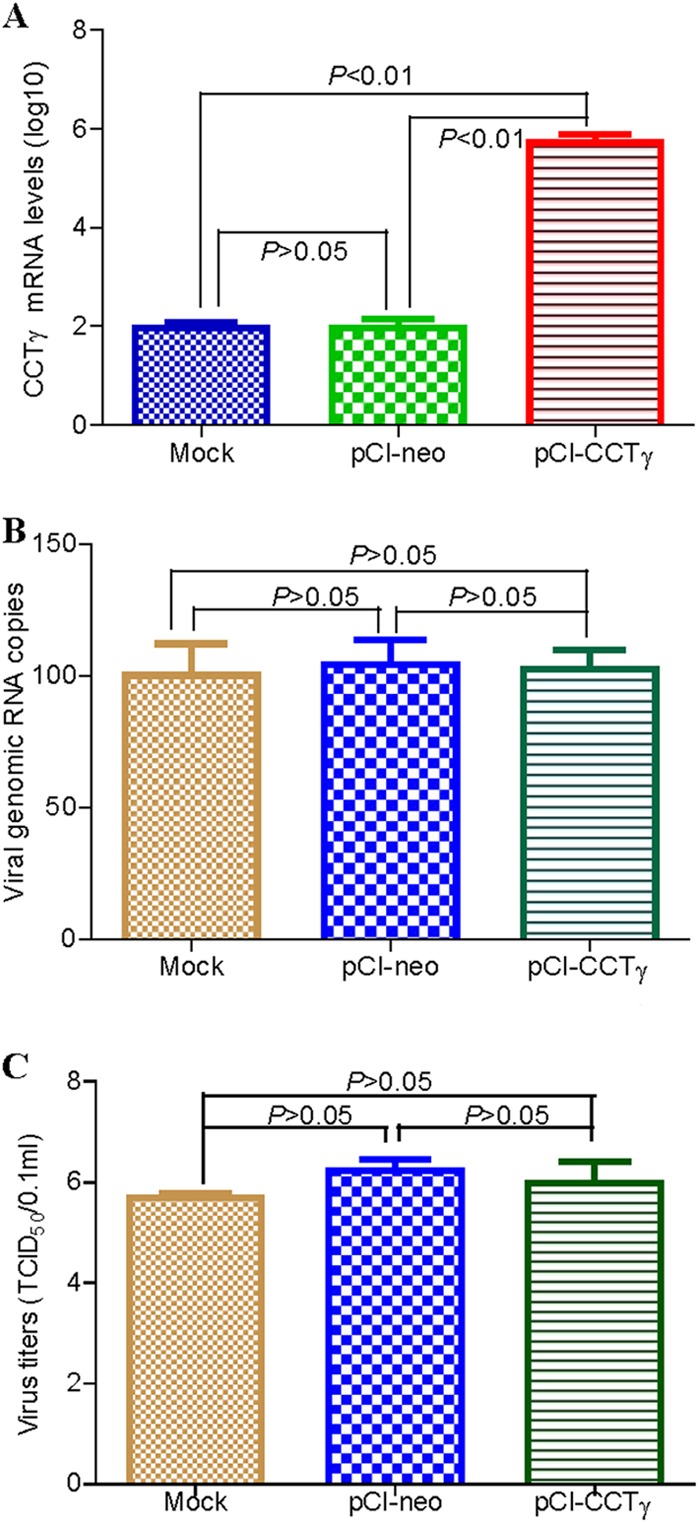
RABV replication in CCTγ-overexpressing N2a cells. (A) CCTγ mRNA transcript. CCTγ mRNA was detected from the transfected N2a cells for 48 h by comparative quantitative PCR (qPCR). GAPDH gene was used as a control. (B) Detection of cellular RABV genomic RNA. The cellular RABV genomic RNA was quantified by absolute qPCR from the RABV-infected N2a cells for 48 h. The RABV genomic copies in the mock N2a cells were normalized to be 100%. (C) Virus titer of RABV. The virus titer in cell supernatants is represented as TCID50.
DISCUSSION
Our study demonstrates colocalization of CCTγ with hollow ring-like structures of NBs containing viral proteins N and P in N2a cells infected by RABV or cotransfected with N and P expression vectors (Fig. 4). Meanwhile, the colocalization of viral proteins N and P was confirmed in N2a cells infected by RABV or cotransfected with N and P expression vectors. The N protein was previously reported to interact with P of RABV (42). However, we found that in N2a cells transfected only with the RABV viral N or P gene, CCTγ was not colocalized with either expressed viral protein (data not shown), indicating that the colocalization and interaction of viral proteins N and P is crucial to NBs. Several research teams reported that neurotropic RABV induces the formation of cytoplasmic inclusion bodies (NBs), which are sites of RABV genomic transcription and replication (12) and have been demonstrated to contain Toll-like receptor 3 (TLR3) (26), Hsp70 (11, 26), viral proteins N and P, and eNOS (10). Taken together, these data confirmed that only the RABV N/P complex and not the individual viral proteins could recruit CCTγ molecules to NBs and that the subcellular distribution of CCTγ was altered in RABV-infected cells. Indeed, our further investigation also showed that the infectious RABV progeny and mRNA were decreased in CCTγ-knockdown N2a cells inoculated with RABV (Fig. 5). Moreover, knockdown of CCTγ did not affect the formation of the NB-like structures (data not shown). These findings demonstrate that CCTγ plays a positive regulatory role in RABV genome replication and that CCTγ is a component but not a core factor of NBs. However, the exact mechanism of CCTγ function in the RABV life cycle needs further investigation.
In the present study, CCTγ overexpression did not show markedly enhanced virus replication in RABV-infected cells as determined by detection of viral genomic RNA and viral titer (Fig. 6). Similarly, in a recent research report (11), the investigators demonstrated that Hsp70 played a proviral role in RABV infection and also found that Hsp70 overexpression only resulted in a slight increase of viral protein synthesis or viral production. Cellular chaperones were involved primarily in assisting the folding of newly synthesized and stress-denatured polypeptides, and they also assisted in the assembly of folded subunits into oligomeric structures (43). As a central mediator of cytosolic protein folding and assembly, CCT provides a physically defined compartment inside which a protein domain or a complete protein can fold while being sequestered from the cytosol (32). Hsp70 is known to be upstream from CCT, is the first target chaperone to bind when the nascent polypeptide chain comes out from the ribosome to help attain a quasinative structure, and will then be transferred to chaperonin CCT for its final folding (44, 45). In in vivo and in vitro experiments, Hsp70 was found to associate with chaperonin CCT, suggesting their cooperation in the process of protein folding (43, 46, 47). Here, a reasonable hypothesis is that the functions of CCTγ in the RABV life cycle may need other cellular factors' cooperation. Interestingly, our 2-DE data also showed that chaperonins Hsp90, CCTγ, and CCTθ were upregulated in RABV-infected cells. Meanwhile, Hsp90 is involved in intracellular transport, complex assembly and disassembly, and protein maturation (24) and is reported to be upregulated in the brainstem and hippocampus of dogs naturally infected by RABV (24) and in RABV-infected mouse brain (18). Therefore, the proteomic data seems to provide further evidence to support our suggestion.
As for the interaction of CCTγ with other viral proteins, a previous study reported that a yeast two-hybrid screening experiment revealed that type D retrovirus p4 specifically interacted with CCTγ (33), and CCTγ also associated with high specificity with the Mason-Pfizer monkey virus pp23/16-p12 domain and human immunodeficiency virus p6. In addition, the crystal structure of the mouse CCTγ apical domain has been determined, and the signature region on the CCTγ apical domains is expected to be involved in the specific binding of its appropriate substrate, partially folded tubulin (48). A recent study demonstrated the interaction of Hsp70 with viral protein N of RABV (11). Unfortunately, our attempts to coimmunoprecipitate viral proteins N and P and chaperonin CCTγ have failed (data not shown) in N2a cells infected with RABV and cotransfected with N and P expression vectors. Whether CCTγ being recruited to NBs interacts directly or indirectly with RABV proteins remains unclear, and further detailed studies are needed to clarify the exact mechanism involved in this process.
Notably, except for altered cellular chaperone expression, in 2-DE coupled with MALDI-MS/MS identification, we demonstrate that cytoskeletal protein profiles were altered by RABV infection in N2a cells. Microtubule-associated proteins (TUBB5 and TUBA1B) and a microfilament-associated protein (Actb) were identified as being upregulated in RABV infection. In contrast, the intermediate filament protein peripherin1 (Prph1) was downregulated in the RABV-infected N2a cells (Fig. 2). Peripherin is a type III intermediate filament protein that is expressed nearly exclusively by peripheral neurons and some central nervous system neurons. In both herpes simplex virus and developmental studies, motor neurons were identified by their expression of peripherin (49). Previous in vivo studies have shown that peripherin is the specific interaction partner of BPAG1-n (50). Taken together, our data indicate that RABV remodels the expression profile of the cytoskeletal proteins in host cells to favor its own replication.
In addition, in dynamic 2-DE imaging of RABV-infected cells, we observed that several differentially expressed spots on the gel represented the same protein (Fig. 2), including peripherin and viral nucleoprotein, and this phenomenon has also been observed in avibirnavirus-infected CEFs (35) and porcine circovirus 2-infected PK15 cells (36). A previous report (51) suggested that the P protein of RABV exists as five isoforms (P, P2, P3, P4, and P5), and not only are their subcellular distributions different, P and P3 interact directly with promyelocytic leukemia protein. Whether the migration of proteins at different spots is the result of posttranslational modification or different isoforms arising during the course of RABV replication and assembly needs further investigation.
In this work, RABV infection resulted in the upregulation of a series of energy metabolism-related proteins, including IDH3A, DLST, LOC433182, and ATP5A1, while TALDO1 was downregulated. Isocitrate dehydrogenase (IDH) is a member of the β-decarboxylating dehydrogenase family of enzymes and catalyzes the oxidative decarboxylation of isocitrate to 2-oxoglutarate (52). NAD+-dependent isocitrate dehydrogenases catalyze the allosterically regulated rate-limiting step of the tricarboxylic acid cycle. DLST (E2) is the structural and catalytic core of the 2-oxo acid dehydrogenase multienzyme complex that catalyzes lipoic acid-mediated and coenzyme A- and NAD+-linked decarboxylation of 2-oxo acids (53). As part of this complex, the induction of DLST may be regarded as an attempt to compensate for the total energy loss in the cell due to the synthesis and transport of viral components.
In summary, our data indicate that the host protein CCTγ is associated with but not a core factor of NBs in RABV-infected N2a cells and contributes to RABV genomic replication. Although further studies are needed to determine the exact mechanism of CCTγ function in the RABV life cycle, the analyses performed in this study highlight the potential of host proteins as useful new targets for drug development.
Supplementary Material
ACKNOWLEDGMENTS
This work was supported by the National Key Technologies Research and Development Program (project no. 2010BAD04B01), National Special Fund for Public Welfare Industry (project no. 201103032), and National High-Tech program (grant 2012AA101303) of China.
We thank Xin-Wen Zhou (Fudan University, China) for help with MALDI-TOF/TOF mass spectrometry and Chun-mei Meng for technical assistance on laser confocal microscopy.
Footnotes
Published ahead of print 1 May 2013
Supplemental material for this article may be found at http://dx.doi.org/10.1128/JVI.03186-12.
REFERENCES
- 1. Lafon M. 2011. Evasive strategies in rabies virus infection. Adv. Virus Res. 79:33–53 [DOI] [PubMed] [Google Scholar]
- 2. Jamin M, Leyrat C, Ribeiro EA, Gerard FCA, Ivanov I, Ruigrok RWH. 2011. Structure, interactions with host cell and functions of rhabdovirus phosphoprotein. Future Virol. 6:465–481 [Google Scholar]
- 3. WHO September 2012. Rabies: fact sheet no. 99. World Health Organization, Geneva, Switzerland: http://www.who.int/mediacentre/factsheets/fs099/en/ Accessed 26 December 2012 [Google Scholar]
- 4. Negri A. 1903. Contributo allo studio dell'eziologia della rabbia. Boll. Soc. Med. Chir. Pavia 2:88–115 [Google Scholar]
- 5. Suchy A, Bauder B, Gelbmann W, Lohr CV, Teifke JP, Weissenbock H. 2000. Diagnosis of feline herpesvirus infection by immunohistochemistry, polymerase chain reaction, and in situ hybridization. J. Vet. Diagn. Invest. 12:186–191 [DOI] [PubMed] [Google Scholar]
- 6. Kamahora J, Sato Y, Kato S, Hagiwara K. 1958. Inclusion bodies of the vaccinia virus. Proc. Soc. Exp. Biol. Med. 97:43–48 [DOI] [PubMed] [Google Scholar]
- 7. Ni YJ, Iwatani Y, Morimoto K, Kawai A. 1996. Studies on unusual cytoplasmic structures which contain rabies virus envelope proteins. J. Gen. Virol. 77:2137–2147 [DOI] [PubMed] [Google Scholar]
- 8. Kristensson K, Dastur DK, Manghani DK, Tsiang H, Bentivoglio M. 1996. Rabies: interactions between neurons and viruses. A review of the history of Negri inclusion bodies. Neuropathol. Appl. Neurobiol. 22:179–187 [PubMed] [Google Scholar]
- 9. Jackson AC, Ye HT, Ridaura-Sanz C, Lopez-Corella E. 2001. Quantitative study of the infection in brain neurons in human rabies. J. Med. Virol. 65:614–618 [PubMed] [Google Scholar]
- 10. Shin T, Weinstock D, Castro MD, Hamir AN, Wampler T, Walter M, Kim HY, Acland H. 2004. Immunohistochemical localization of endothelial and inducible nitric oxide synthase within neurons of cattle with rabies. J. Vet. Med. Sci. 66:539–541 [DOI] [PubMed] [Google Scholar]
- 11. Lahaye X, Vidy A, Fouquet B, Blondel D. 2012. Hsp70 protein positively regulates rabies virus infection. J. Virol. 86:4743–4751 [DOI] [PMC free article] [PubMed] [Google Scholar]
- 12. Lahaye X, Vidy A, Pomier C, Obiang L, Harper F, Gaudin Y, Blondel D. 2009. Functional characterization of Negri bodies (NBs) in rabies virus-infected cells: Evidence that NBs are sites of viral transcription and replication. J. Virol. 83:7948–7958 [DOI] [PMC free article] [PubMed] [Google Scholar]
- 13. Zhang L, Zhang ZP, Zhang XE, Lin FS, Ge F. 2010. Quantitative proteomics analysis reveals BAG3 as a potential target to suppress severe acute respiratory syndrome coronavirus replication. J. Virol. 84:6050–6059 [DOI] [PMC free article] [PubMed] [Google Scholar]
- 14. Li ZY, Zhao X, Bai SJ, Wang Z, Chen LJ, Wei YQ, Huang CH. 2008. Proteomics identification of cyclophilin A as a potential prognostic factor and therapeutic target in endometrial carcinoma. Mol. Cell Proteomics 7:1810–1823 [DOI] [PMC free article] [PubMed] [Google Scholar]
- 15. Radhakrishnan A, Yeo D, Brown G, Myaing MZ, Iyer LR, Fleck R, Tan BH, Aitken J, Sanmun D, Tang K, Yarwood A, Brink J, Sugrue RJ. 2010. Protein analysis of purified respiratory syncytial virus particles reveals an important role for heat shock protein 90 in virus particle assembly. Mol. Cell Proteomics 9:1829–1848 [DOI] [PMC free article] [PubMed] [Google Scholar]
- 16. Wang Z, Jiang L, Huang C, Li Z, Chen L, Gou L, Chen P, Tong A, Tang M, Gao F, Shen J, Zhang Y, Bai J, Zhou M, Miao D, Chen Q. 2008. Comparative proteomics approach to screening of potential diagnostic and therapeutic targets for oral squamous cell carcinoma. Mol. Cell Proteomics 7:1639–1650 [DOI] [PMC free article] [PubMed] [Google Scholar]
- 17. Ma YL, Peng JY, Liu WJ, Zhang P, Huang L, Gao BB, Shen TY, Zhou YK, Chen HQ, Chu ZX, Zhang M, Qin HL. 2009. Proteomics identification of desmin as a potential oncofetal diagnostic and prognostic biomarker in colorectal cancer. Mol. Cell Proteomics 8:1878–1890 [DOI] [PMC free article] [PubMed] [Google Scholar]
- 18. Prosniak M, Hooper DC, Dietzschold B, Koprowski H. 2001. Effect of rabies virus infection on gene expression in mouse brain. Proc. Natl. Acad. Sci. U. S. A. 98:2758–2763 [DOI] [PMC free article] [PubMed] [Google Scholar]
- 19. Wang ZW, Sarmento L, Wang YH, Li XQ, Dhingra V, Tseggai T, Jiang BM, Fu ZF. 2005. Attenuated rabies virus activates, while pathogenic rabies virus evades, the host innate immune responses in the central nervous system. J. Virol. 79:12554–12565 [DOI] [PMC free article] [PubMed] [Google Scholar]
- 20. Zhao P, Zhao L, Zhang T, Qi Y, Wang T, Liu K, Wang H, Feng H, Jin H, Qin C, Yang S, Xia X. 2011. Innate immune response gene expression profiles in central nervous system of mice infected with rabies virus. Comp. Immunol. Microbiol. Infect. Dis. 34:503–512 [DOI] [PubMed] [Google Scholar]
- 21. Dhingra V, Li X, Liu Y, Fu ZF. 2007. Proteomic profiling reveals that rabies virus infection results in differential expression of host proteins involved in ion homeostasis and synaptic physiology in the central nervous system. J. Neurovirol. 13:107–117 [DOI] [PubMed] [Google Scholar]
- 22. Wang X, Zhang S, Sun C, Yuan ZG, Wu X, Wang D, Ding Z, Hu R. 2011. Proteomic profiles of mouse neuro n2a cells infected with variant virulence of rabies viruses. J. Microbiol. Biotechnol. 21:366–373 [PubMed] [Google Scholar]
- 23. Zandi F, Eslami N, Soheili M, Fayaz A, Gholami A, Vaziri B. 2009. Proteomics analysis of BHK-21 cells infected with a fixed strain of rabies virus. Proteomics 9:2399–2407 [DOI] [PubMed] [Google Scholar]
- 24. Thanomsridetchai N, Singhto N, Tepsumethanon V, Shuangshoti S, Wacharapluesadee S, Sinchaikul S, Chen ST, Hemachudha T, Thongboonkerd V. 2011. Comprehensive proteome analysis of hippocampus, brainstem, and spinal cord from paralytic and furious dogs naturally infected with rabies. J. Proteome Res. 10:4911–4924 [DOI] [PubMed] [Google Scholar]
- 25. Sagara J, Kawai A. 1992. Identification of heat-shock protein-70 in the rabies virion. Virology 190:845–848 [DOI] [PubMed] [Google Scholar]
- 26. Menager P, Roux P, Megret F, Bourgeois JP, Le Sourd AM, Danckaert A, Lafage M, Prehaud C, Lafon M. 2009. Toll-like receptor 3 (TLR3) plays a major role in the formation of rabies virus Negri bodies. PLoS Pathog. 5:e1000315. 10.1371/journal.ppat.1000315 [DOI] [PMC free article] [PubMed] [Google Scholar]
- 27. Bigotti MG, Clarke AR. 2008. Chaperonins: the hunt for the group II mechanism. Arch. Biochem. Biophys. 474:331–339 [DOI] [PubMed] [Google Scholar]
- 28. Posokhova E, Song H, Belcastro M, Higgins L, Bigley LR, Michaud NA, Martemyanov KA, Sokolov M. 2011. Disruption of the chaperonin containing TCP-1 function affects protein networks essential for rod outer segment morphogenesis and survival. Mol. Cell. Proteomics 10:M110.000570. 10.1074/mcp.M110.000570 [DOI] [PMC free article] [PubMed] [Google Scholar]
- 29. Matsuda N, Mishina M. 2004. Identification of chaperonin CCT gamma subunit as a determinant of retinotectal development by whole-genome subtraction cloning from zebrafish no tectal neuron mutant. Development 131:1913–1925 [DOI] [PubMed] [Google Scholar]
- 30. Lingappa JR, Martin RL, Wong ML, Ganem D, Welch WJ, Lingappa VR. 1994. A eukaryotic cytosolic chaperonin is associated with a high molecular weight intermediate in the assembly of hepatitis B virus capsid, a multimeric particle. J. Cell Biol. 125:99–111 [DOI] [PMC free article] [PubMed] [Google Scholar]
- 31. Inoue Y, Aizaki H, Hara H, Matsuda M, Ando T, Shimoji T, Murakami K, Masaki T, Shoji I, Homma S, Matsuura Y, Miyamura T, Wakita T, Suzuki T. 2011. Chaperonin TRiC/CCT participates in replication of hepatitis C virus genome via interaction with the viral NS5B protein. Virology 410:38–47 [DOI] [PubMed] [Google Scholar]
- 32. Fislova T, Thomas B, Graef KM, Fodor E. 2010. Association of the influenza virus RNA polymerase subunit PB2 with the host chaperonin CCT. J. Virol. 84:8691–8699 [DOI] [PMC free article] [PubMed] [Google Scholar]
- 33. Hong S, Choi G, Park S, Chung AS, Hunter E, Rhee SS. 2001. Type D retrovirus gag polyprotein interacts with the cytosolic chaperonin TRiC. J. Virol. 75:2526–2534 [DOI] [PMC free article] [PubMed] [Google Scholar]
- 34. Kashuba E, Pokrovskaja K, Klein G, Szekely L. 1999. Epstein-Barr virus-encoded nuclear protein EBNA-3 interacts with the epsilon-subunit of the T-complex protein 1 chaperonin complex. J. Hum. Virol. 2:33–37 [PubMed] [Google Scholar]
- 35. Zheng X, Hong L, Shi L, Guo J, Sun Z, Zhou J. 2008. Proteomics analysis of host cells infected with infectious bursal disease virus. Mol. Cell Proteomics 7:612–625 [DOI] [PubMed] [Google Scholar]
- 36. Zhang X, Zhou JY, Wu YP, Zheng XJ, Ma GP, Wang ZT, Jin YL, He JL, Yan Y. 2009. Differential proteome analysis of host cells infected with porcine circovirus type 2. J. Proteome Res. 8:5111–5119 [DOI] [PubMed] [Google Scholar]
- 37. Bradford MM. 1976. A rapid and sensitive method for the quantitation of microgram quantities of protein utilizing the principle of protein-dye binding. Anal. Biochem. 72:248–254 [DOI] [PubMed] [Google Scholar]
- 38. Wu Y, Peng C, Xu L, Zheng X, Liao M, Yan Y, Jin Y, Zhou J. 2012. Proteome dynamics in primary target organ of infectious bursal disease virus. Proteomics 12:1844–1859 [DOI] [PubMed] [Google Scholar]
- 39. Yan JX, Wait R, Berkelman T, Harry RA, Westbrook JA, Wheeler CH, Dunn MJ. 2000. A modified silver staining protocol for visualization of proteins compatible with matrix-assisted laser desorption/ionization and electrospray ionization-mass spectrometry. Electrophoresis 21:3666–3672 [DOI] [PubMed] [Google Scholar]
- 40. Hierholzer JC, Killington RA. 1996. Virus isolation and quantitation, p 25–46 InMahy BWJ, Kangro HO. (ed), Virology methods manual, Academic Press, London, United Kingdom [Google Scholar]
- 41. Bose S, Mathur M, Bates P, Joshi N, Banerjee AK. 2003. Requirement for cyclophilin A for the replication of vesicular stomatitis virus New Jersey serotype. J. Gen. Virol. 84:1687–1699 [DOI] [PubMed] [Google Scholar]
- 42. Chenik M, Chebli K, Gaudin Y, Blondel D. 1994. In-vivo interaction of rabies virus phosphoprotein (P) and nucleoprotein (N)—existence of 2 N-binding sites on P-protein. J. Gen. Virol. 75:2889–2896 [DOI] [PubMed] [Google Scholar]
- 43. Kabir MA, Uddin W, Narayanan A, Reddy PK, Jairajpuri MA, Sherman F, Ahmad Z. 2011. Functional subunits of eukaryotic chaperonin CCT/TRiC in protein folding. J. Amino Acids 2011:843206. 10.4061/2011/843206 [DOI] [PMC free article] [PubMed] [Google Scholar]
- 44. Melville MW, McClellan AJ, Meyer AS, Darveau A, Frydman J. 2003. The Hsp70 and TRiC/CCT chaperone systems cooperate in vivo to assemble the von Hippel-Lindau tumor suppressor complex. Mol. Cell. Biol. 23:3141–3151 [DOI] [PMC free article] [PubMed] [Google Scholar]
- 45. Cuellar J, Martin-Benito J, Scheres SH, Sousa R, Moro F, Lopez-Vinas E, Gomez-Puertas P, Muga A, Carrascosa JL, Valpuesta JM. 2008. The structure of CCT-Hsc70 NBD suggests a mechanism for Hsp70 delivery of substrates to the chaperonin. Nat. Struct. Mol. Biol. 15:858–864 [DOI] [PMC free article] [PubMed] [Google Scholar]
- 46. Lewis VA, Hynes GM, Zheng D, Saibil H, Willison K. 1992. T-complex polypeptide-1 is a subunit of a heteromeric particle in the eukaryotic cytosol. Nature 358:249–252 [DOI] [PubMed] [Google Scholar]
- 47. Frydman J, Hartl FU. 1996. Principles of chaperone-assisted protein folding: differences between in vitro and in vivo mechanisms. Science 272:1497–1502 [DOI] [PubMed] [Google Scholar]
- 48. Pappenberger G, Wilsher JA, Roe SM, Counsell DJ, Willison KR, Pearl LH. 2002. Crystal structure of the CCTgamma apical domain: implications for substrate binding to the eukaryotic cytosolic chaperonin. J. Mol. Biol. 318:1367–1379 [DOI] [PubMed] [Google Scholar]
- 49. Arvanian VL, Bowers WJ, Petruska JC, Motin V, Manuzon H, Narrow WC, Federoff HJ, Mendell LM. 2004. Viral delivery of NR2D subunits reduces Mg2+ block of NMDA receptor and restores NT-3-induced potentiation of AMPA-kainate responses in maturing rat motoneurons. J. Neurophysiol. 92:2394–2404 [DOI] [PubMed] [Google Scholar]
- 50. Leung CL, Sun DM, Liem RKH. 1999. The intermediate filament protein peripherin is the specific interaction partner of mouse BPAG1-n (dystonin) in neurons. J. Cell Biol. 144:435–446 [DOI] [PMC free article] [PubMed] [Google Scholar]
- 51. Blondel D, Regad T, Poisson N, Pavie B, Harper F, Pandolfi PP, De The H, Chelbi-Alix MK. 2002. Rabies virus P and small P products interact directly with PML and reorganize PML nuclear bodies. Oncogene 21:7957–7970 [DOI] [PubMed] [Google Scholar]
- 52. Zheng PP, van der Weiden M, van der Spek PJ, Vincent AJ, Kros JM. 2012. Isocitrate dehydrogenase 1R132H mutation in microglia/macrophages in gliomas: indication of a significant role of microglia/macrophages in glial tumorigenesis. Cancer Biol. Ther. 13:836–839 [DOI] [PMC free article] [PubMed] [Google Scholar]
- 53. Perluigi M, Poon HF, Maragos W, Pierce WM, Klein JB, Calabrese V, Cini C, De Marco C, Butterfield DA. 2005. Proteomic analysis of protein expression and oxidative modification in R6/2 transgenic mice. Mol. Cell Proteomics 4:1849–1861 [DOI] [PubMed] [Google Scholar]
Associated Data
This section collects any data citations, data availability statements, or supplementary materials included in this article.