Abstract
Advances in mass spectrometry-based proteomic technologies have increased the speed of analysis and the depth provided by a single analysis. Computational tools to evaluate the accuracy of peptide identifications from these high-throughput analyses have not kept pace with technological advances; currently the most common quality evaluation methods are based on statistical analysis of the likelihood of false positive identifications in large-scale data sets. While helpful, these calculations do not consider the accuracy of each identification, thus creating a precarious situation for biologists relying on the data to inform experimental design. Manual validation is the gold standard approach to confirm accuracy of database identifications, but is extremely time-intensive. To palliate the increasing time required to manually validate large proteomic datasets, we provide computer aided manual validation software (CAMV) to expedite the process. Relevant spectra are collected, catalogued, and pre-labeled, allowing users to efficiently judge the quality of each identification and summarize applicable quantitative information. CAMV significantly reduces the burden associated with manual validation and will hopefully encourage broader adoption of manual validation in mass spectrometry-based proteomics.
Keywords: Mass spectrometry, tandem mass spectrometry, protein identification, protein post translational modification, computational analysis
Introduction
Recent advances in mass spectrometry technologies have ushered in a new era of high-content, high-resolution proteomic datasets. Acquisition of hundreds of thousands of tandem mass spectra (MS/MS spectra) in a single analysis is now routine, and by coupling high-speed data acquisition to sample pre-fractionation, millions of MS/MS spectra can be generated from the analysis of a single biological sample. Despite the technological advances that have enabled acquisition of these massive datasets, tools to accurately identify the peptides and post-translational modification (PTM) sites defined by these tandem mass spectra have evolved less rapidly.
In a typical workflow, MS/MS spectra are searched, with database search algorithms such as Sequest [1], MASCOT [2], XTandem [3], or Andromeda [4], against protein databases to generate putative peptide and/or PTM identifications for each MS/MS spectrum. Each of these algorithms relies on a scoring system which weights a variety of parameters, including the mass accuracy of the precursor ion m/z and the percentage and/or sequence of fragment ions matching to the theoretical mass and fragmentation pattern of the putative peptide identification. Due to a variety of factors, including the intensity, peptide sequence (including PTMs), complexity of the sample, and fragmentation method, the MS/MS spectra vary greatly in terms of their quality, as defined by their signal-to-noise and complexity. This variation in quality leads to a wide difference in the searching algorithm scores for putative peptide matches. Currently, there are no set ‘thresholds’ or ‘rules’ for determining whether a particular peptide identification is correct, and each database search algorithm weights aspects of the identification differently. With potentially millions of MS/MS spectra per sample, the challenge of sorting through the putative identifications to determine the accuracy of each assignment is monumental, yet is of utmost importance for correct determination of the components within the biological sample.
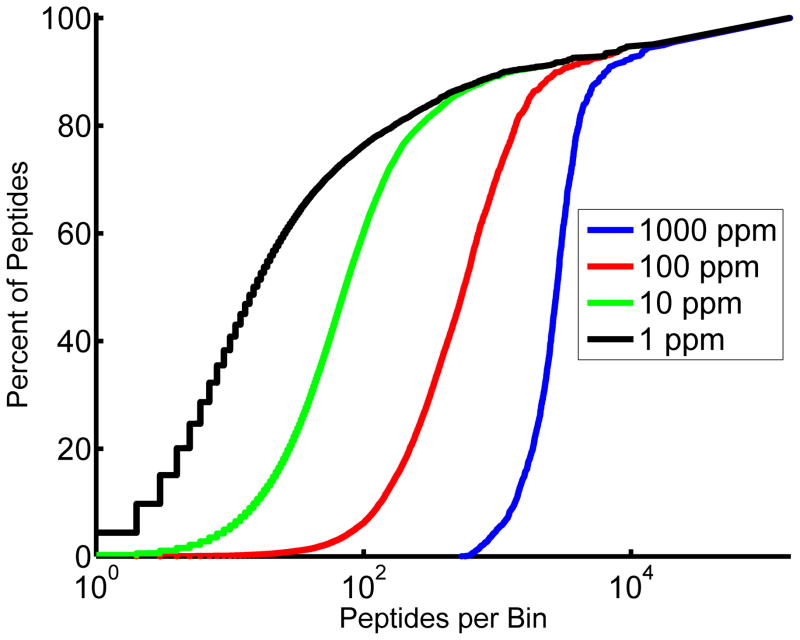
The difficulty of accurately identifying a peptide defined by a given tandem mass spectrum can be exemplified when one considers how much weight should be given to mass accuracy of the measured precursor ion m/z compared to the theoretical m/z of the putative peptide. As the accuracy of the measured mass improves, the number of potential peptides from a given database matching to that mass decreases significantly. However, mass accuracy alone is typically not sufficient for identification. Figure 1 illustrates the issue of relying solely on peptide precursor mass to confirm identification. All tryptic fragments from proteins in the Human 2009 proteome database were in-silico digested and binned based on different accuracies. At 10 ppm, very few peptides are the sole occupant of their m/z bin. At 1 ppm, roughly 5% of peptides are uniquely identifiable from their precursor m/z. The problem becomes more daunting when the database increases in complexity to reflect the complexity found in biological samples: the database should contain missed cleavages, non-tryptic cleavages, and at least the most common dozen of the several hundred potential post-translational or chemical modifications, as all of these are realistic possibilities for any given peptide. Searches performed against a database of this size and complexity would require massive computational resources. Searching algorithms fight an uphill battle against combinatorial explosion as they seek to balance runtime considerations against erroneous exclusion of relevant peptides. Unfortunately, searching against an incomplete database can lead to false positive identifications, simply because the true assignments are not contained within the search space, and therefore the next best match will automatically be reported. Distinguishing between high scoring false positives associated with the ‘next best match’ and true positives is critical, especially given the ultimate goal of utilizing these peptide and PTM assignments to inform biological experimental design [5].
Figure 1.
Sample complexity prevents identification of peptides from complex samples based solely on accurate precursor mass measurements. Precursor masses from all tryptic fragments from the Human 2009 database with charge states +2 to +4 that fall between m/z 350 and 1500 were considered. Precursor masses were binned into windows generated at four different resolutions. As the number of peptides per bin increases the percentage of total peptides accounted for increases. At 10ppm a vanishingly small percentage of peptides are the sole occupant of their bin making it nearly impossible to accurately identify peptides based on their precursor mass alone. At 1ppm this figure is improved to roughly 5%. This problem is exacerbated when post translational modifications and missed or non-tryptic cleavages are included.
Statistical Approaches to Assessing Quality
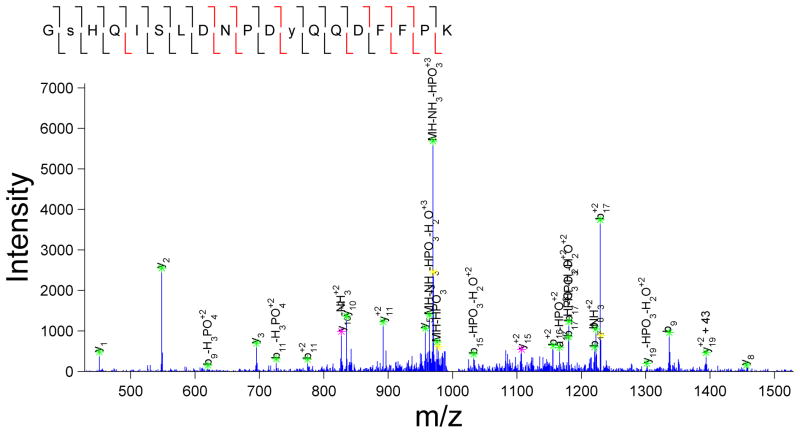
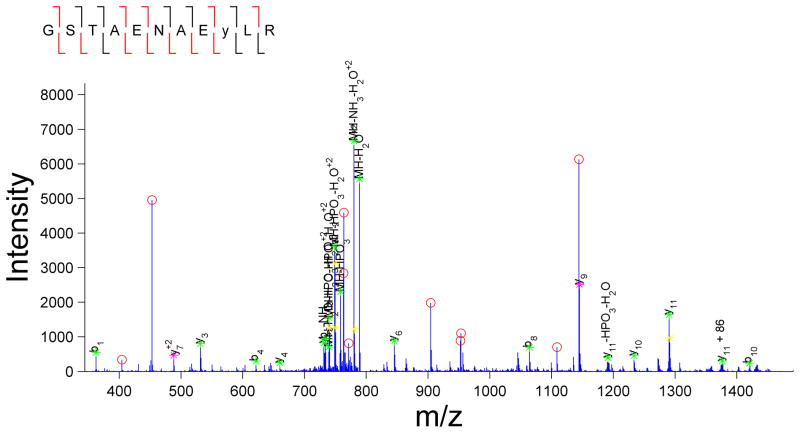
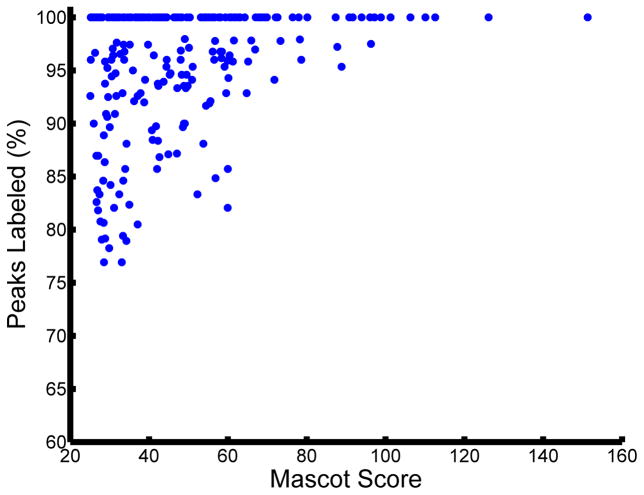
Currently, the most common approaches to assessing the validity of a given set of peptide assignments are based on statistical analyses of the likelihood of incorrect assignments, calculated as either a false-positive or false-discovery rate (FDR). In this approach, the MS/MS spectra are searched against a forward database and also against a decoy, reversed or scrambled, protein database [6]. The score thresholds that separate correct from incorrect peptide assignments are then altered to achieve a pre-determined false discovery rate, defined as the quotient of the number of matches in the randomized decoy database to the number of matches in the target database. While this approach can be used to rapidly assess the quality of the overall set of peptide assignments, there are several factors that need to be considered to accurately calculate the FDR. For instance, construction of an appropriate decoy database is crucial, as the distribution of peptide lengths, amino acid composition, and motif prevalence must be tuned to match that of the species database and the specific enrichment experiment performed. In addition, replicate identifications can artificially deflate the FDR if they are considered as independent tests. Several dozen MS/MS spectra might be generated for an abundant species eluting from the chromatography column (these replicate spectra are the basis for the label free spectral counting quantitative approach); it is expected that each of these spectra will match to the same peptide sequence in the forward database. Since these MS/MS spectra are effectively replicates of the same MS/MS spectrum, if one of the spectra does not match to the decoy database, then it is likely that all of the spectra will not match to the decoy database. Instead of considering these as independent tests with several dozen hits with no decoy hits, corresponding to a low FDR, this set of data should be considered as one hit with no decoy hit. Considering these factors should significantly improve the accuracy of the FDR-based statistical estimate of global data quality. It is worth noting that the FDR-based statistical approach only provides a global quality metric and fails to identify which assignments are true vs. false-positives, leaving doubt about the validity of any given peptide assignment in the dataset. In fact, it is only on further manual inspection that the quality of each peptide assignment becomes evident, even for MS/MS spectra with similar scores for given assignments. For instance, two peptide identifications with similar MASCOT scores are presented in Figure 2. The confidence in the accuracy of the assignment is much higher for the spectrum in Figure 2A, as almost all fragment ions match to the expected theoretical fragment ions from the assigned peptide. By comparison, in Figure 2B there are multiple intense ions that do not correspond to any of the typically theoretical fragment ions for the given peptide assignment, and therefore this MS/MS spectrum is likely to represent either an incorrect assignment or potentially a ‘contaminated’ spectrum resulting from the simultaneous isolation and fragmentation of multiple ions. In most cases, the database score reflects the number of matched fragment ions, but does not consider the number of unmatched abundant ions, as can be seen by the varied percentage of unmatched ions for similar database scores in Figure 2C. Based on this analysis, it appears that any global score threshold will automatically include low-confidence identifications, defined as spectra with a fair number of unassigned abundant fragment ions.
Figure 2.
MASCOT score only provides a rough estimate of the quality of the spectral assignment. Two scans with comparable MASCOT scores: (A) MASCOT score 27.12 and (B) MASCOT score 26.7 were selected. Note the significant disparity in the number of unassigned peaks in the two spectra. (C) Variation in percentage of unassigned peaks for a given MASCOT score can also be visualized at the dataset level. For this analysis, all peptide matches with MASCOT score above 25 from a representative phosphotyrosine enriched analysis were included. In a given spectrum, all of the peaks above ten percent of maximum intensity or above 2.5 percent in a sparsely populated region within a +/−25 m/z window were included for consideration.
An alternative to the FDR approach is to use machine learning-based techniques to automate the validation process. A decision tree validation scheme has been shown to reduce the FDR, yet still relies on searches against a general decoy database [7]. More recently, a hybrid Support Vector Machine (SVM)/Dynamic Bayes Network (DBN) approach was used to classify MS/MS data, and was shown to increase positive identifications in 1% FDR search results [8]. To circumvent the need for large amounts of training data for classification methods, another approach is to create a rule-based framework where prominent fragments are predicted based on expert criteria [9], although codifying experiential human knowledge still limits results to those peptides that match prescribed criteria, therefore hindering generalization to peptides with different PTM’s. The “expect” score in MASCOT provides another, peptide sequence specific, alternative to the FDR. This score reflects the probability that a peptide assignment with a given MASCOT score would occur by chance, taking into account the length of the peptide along with the sequences of other peptides in the database to judge the likelihood of proper assignment.
A number of algorithmic approaches have been proposed to automate the proper localization of PTM’s, one of the key factors in the quality of an assignment. Among the most widely used of these algorithms, ASCORE defines the PTM site(s) by assignment likelihood based on key fragment ion peaks that differentiate multiple putative localizations [Beausoleil 2006]. PhosphoRS uses a similar scheme based on more of the ions in the spectrum and has been applied to data sets from a more varied selection of instruments [Taus 2011]. Mascot Delta Score (MDScore) leverages the probabilistic calculations included in the Mascot score [Pappin 2006] and bases localization confidence on the difference between the Mascot scores for the leading putative assignments. MDScore has been shown to achieve results comparable to ASCORE for localizing tyrosine phosphorylation [Savitski 2011]. Each of these algorithms is based on the principle that the PTM site assignment that matches the most peaks is correct; however, localization to one out of several closely spaced residues is often difficult, regardless of the algorithm. In these cases, the user can leverage prior knowledge of a site’s biological relevance, a protein’s sequence homology, and the purification procedures employed during sample preparation to assist in defining the most likely assignment of a given site (see Supplementary Figure s3A/B).
From a larger perspective, all of these automated approaches face the difficult task of limiting false positives while also limiting false negatives, thereby yielding the largest dataset with fewest incorrect assignments. The balance between false-positives and false negatives must be carefully considered, as the potential cost of false positives can be very significant: false positives may distract research efforts and mislead experimental design, potentially costing years of wasted effort [5].
Manual Validation of MS/MS Data
Despite the dilemma presented by the specter of false positives and the need to rapidly validate large numbers of peptide assignments, the tools available to more rigorously analyze a dataset have been limited. The gold standard for MS/MS peptide identification verification is manual validation, where precursor and fragment mass observations are manually evaluated against a theoretical fragment ion spectrum from the search algorithm assignment [10]. Further confirmation can be achieved with synthesis of the putative peptide and chromatography co-elution experiments, although these additional steps incur significantly more cost and effort and are therefore typically reserved for the most interesting peptide matches [11]. Through manual validation, the intensity of particular fragment ions, coupled with the presence, absence, and missed assignment of other fragment ions, can be evaluated by mass spectrometry experts to assess the strength of the assignment. While there may be some variation in the particular implementation of the manual validation process, efforts have been made to codify the process to ensure consistency. Key objectives for the validation process (which peaks must be attributable to the sequence, expected relative intensity of peaks for key fragments, PTM localization, and criteria for exclusion) have been nicely summarized in previous works [10]. Briefly, in addition to assigning each fragment ion to a specific fragmentation site in the peptide, the likelihood of identifying particular fragment ions is also considered in the manual validation of a spectrum. For instance, fragment ions assigned as neutral losses from specific fragmentation sites should be appropriate to the residues contained within that fragment. The relative intensity of the fragment ions is also considered relative to the proposed peptide sequence; favored fragmentation sites should correspond to higher abundance fragment ions, while disfavored fragmentation sites should be represented by lower abundance fragment ions. In general, correct peptide sequences typically have all fragment ions over 10% of the base peak intensity assigned to a specific fragmentation site in the peptide. As seen in Figure 2C, unassigned fragment ions in the MS/MS spectrum suggest either an incorrect sequence or a mixed spectrum; both of which result in decreased confidence in the accuracy of the assignment.
Manual validation can be tedious and time-consuming, as tens of significant peaks from each MS/MS spectrum must be individually aligned and matched to the mass of a known fragment derived from the proposed peptide. When applied to a large-scale dataset, this approach can take weeks, if not months, to individually assess each of the thousands of MS/MS spectra, with most of the time spent meticulously comparing lists of numbers and relatively little time required for the final decision as to whether one should include the assignment in the dataset. There is a clear disconnect in the speed with which millions of spectra can be acquired and the time required for spectral validation. How, then, to increase the speed of the manual validation process without sacrificing the level of rigor and confidence in each peptide identification? As it turns out, many of the tasks associated with manual validation can be assisted by computer automation, leaving the task of approval of a particular peptide assignment to a human decision while expediting much of the tedious tasks of collecting relevant MS/MS spectra from a particular analysis and calculating the predicted fragment ions of a particular peptide. Here, we describe a Computer-Aided Manual Validation (CAMV) package that mitigates the time-consuming portions of the validation task and presents the relevant information in a streamlined format, allowing the user to rapidly judge the accuracy and quality of database identifications. Application of CAMV to a given LC-MS/MS analysis leads to a high-confidence set of peptide identifications and a concise summary of any quantitative information from iTRAQ or SILAC, all of which can be accomplished in hours instead of days or weeks.
Computer Aided Manual Validation Package
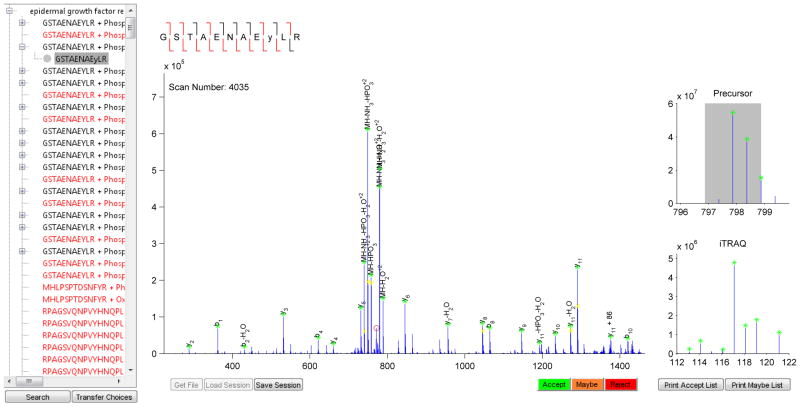
We have produced a computer-aided validation pipeline that expedites the validation process without removing human judgment, helping to address the disconnect between manual validation and high-throughput data generation while still maintaining data quality. CAMV loads the MS/MS scans along with the putative assignment from the search engine. Fragment ions are automatically labeled based on the sequence assignment and according to a scoring rubric which has been developed and tested to assign the most likely labels to each fragment. To assist the user in assessing the quality of the peptide assignment, additional information is provided in the output of CAMV, including color-coded peak labeling, magnified view of the mass-to-charge range of the MS scan around the precursor ion, and of the MS/MS scan around the iTRAQ marker ion mass range (Figure 3). Color coded peak labels allow the user to rapidly identify unlabeled or mislabeled peaks, both of which are particularly valuable when confirming peptide sequence assignment or comparing multiple PTM localizations within a given peptide sequence. Through this overall design, the various aspects of manual validation software are apportioned to the most qualified entity: CAMV performs the most tedious and time consuming tasks associated with peak labeling, and the user is presented with the most relevant information to quickly make the correct decision. Once an analysis has been user- verified, publication-ready figures and spreadsheets containing the appropriate quantitative data can be generated from accepted assignments.
Figure 3.
The Graphical User Interface (GUI) for the MATLAB implementation of CAMV. The left tree contains a searchable list of protein hits in order of decreasing MASCOT score, each peptide assignment made to that protein, and all possible combinations of PTMs for each scan. The middle panel contains the MS2 scan data with pre-labeled peaks. On the right is a survey of the precursor window of the MS1 scan and a view of any quantitation information associated with the assignment. The peptide ladder at the top summarizes the sequencing information: red for an identified fragment, black for missing. A peak color-coding scheme allows for rapid surveillance of the quality of the match: within tolerance (green), within 1.5x tolerance (magenta), unmatched peak (red), and isotopic peak (yellow). Peptides which are pre-emptively excluded by the software appear in red on the left-hand tree. For these peptides, the reason for preemptive exclusion is displayed at the top left of the MS2 panel in place of the sequence ladder, along with an option to proceed with processing.
Data Preprocessing
The typical workflow for CAMV analysis is represented schematically in Figure 4. Here we describe the current configuration, although in most cases the specific software tool embedded in the package that has been utilized for a given task could be replaced with an alternate option. Initially, the raw mass spectrometry data file is converted into Mascot Generic Format (MGF) through DTA Supercharge, which de-isotopes the MS data files, converting precursor masses to the mono-isotopic masses. The MGF file is then searched with MASCOT against the appropriate database, with the associated post-translational modification options. The results of the MASCOT search are harvested as an XML file with the input query data included, enabling one to match the MGF file query number to the raw file scan number. To access the scan information in the MS raw data file, an mzXML is produced using ‘msconvert’ from the Proteowizard package [12].
Figure 4.
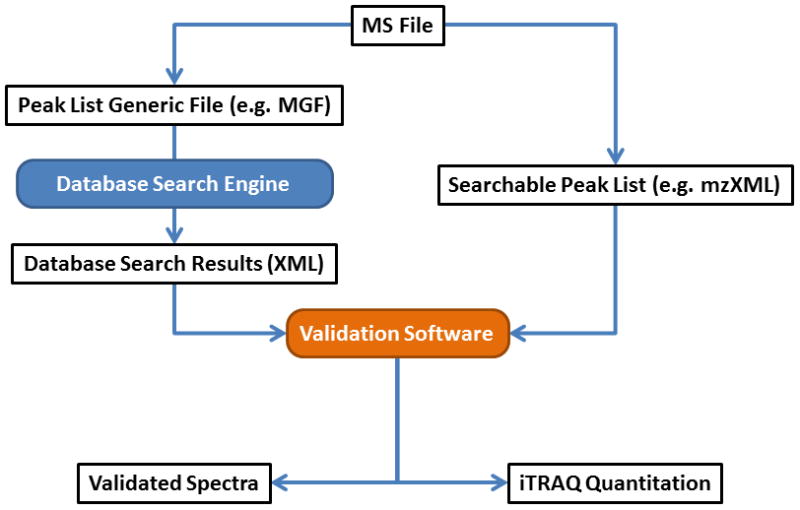
Peptide Sequence Identification and Validation Workflow. Raw data from the instrument is converted with DTA Supercharge into an MGF file that is searchable in MASCOT [2]. In parallel, the Proteowizard [12] package is used to convert the RAW file into a format where the scan information is readily accessible. These two paths converge on the Validation Software which matches the search results with the relevant scan data in preparation for user verification. Once complete, figures of validated scans are exported as PDFs and quantitation information as a spreadsheet.
PTM Identification
Search algorithm (e.g. MASCOT) results are retrieved as an XML file containing global information about fixed and variable modifications used in the search. Fixed modifications are applied to all instances of a given residue while variable modifications may or may not be present on any instance of a given residue. Scan-specific modifications to be applied to a particular MASCOT identification are included in the XML file and are taken into account when generating fragment masses; terminal fixed modifications are applied to every peptide.
Modified Sequence Generation
Most of the current searching algorithms perform well at assigning the base peptide sequence and the appropriate number of modifications, but perform poorly at determining the correct site-specific localization of each modification. This poor performance is due to the number and similarity of the various theoretical fragmentation patterns, as for each amino acid sequence and set of variable modifications, several permutations may exist, each of which may be distinguished typically by differences in 2 fragment ions. To facilitate this PTM localization task, CAMV generates all permissible combinations with a recursive search. Although the system is easily modifiable to include additional modifications, in the current configuration, CAMV handles the following modifications:
-
Fixed:
iTRAQ labeling
Cysteine Carbamidomethylation
-
Variable:
Serine, Threonine, and Tyrosine Phosphorylation
Lysine Acetylation (concurrently with iTRAQ)
Methionine Oxidation
Light, Medium, and Heavy SILAC Labeling of Arginine and Lysine (not concurrently with Lysine Acetylation or iTRAQ)
Theoretical Fragment Ion Generation
For each candidate permutation of variable modifications, the full set of theoretical fragment ion masses is generated. To calculate these masses, the N-terminal mass is determined based on the type of iTRAQ (e.g. none, 4-plex, 8-plex) applied to the sample. Each residue is added to the N-terminus in the proper order, with all resulting b-ion masses recorded. With the full sequence, the precursor ion m/z values of charge states 1–5 are calculated and stored. Next, all permissible combinations of neutral losses from each b-ion are calculated and stored. Permissible losses include: H2O, NH3, H3PO4 (from pSer or pThr), HPO3 and HPO3+H2O (from pTyr), and SOCH3 (from carbamidomethyl C), this list can be expanded as needed, but it is important not to expand to include unlikely losses which can lead to over-fitting of the data (e.g. by assigning unlikely fragment ions to the peaks, it becomes more difficult to differentiate false-positives from true positives). Each b-ion and loss is calculated for charge states up to and including the charge state of the precursor. Each b-ion and loss also produces an a-ion fragment with the loss of CO2. The process is repeated from the C-terminus of the peptide to produce y-ions and the corresponding losses. Additional frequently observed fragment ions are included: 216.04 (for pTyr) and bn+86 (for 8plex iTRAQ).
Fragment Alignment
CAMV attempts to assign a label to all peaks in the MS/MS spectra whose intensity is greater than 10% of the base peak intensity. To probe further into sparse regions of the MS/MS spectrum, label assignments are attempted on all peaks whose intensity exceeds 2.5% of the base peak intensity if they are a local maximum in a sparsely populated region (e.g. +/− 25 m/z). The accuracy of the fragment ion matching thresholds can be adjusted for high- vs. low-resolution fragment ion spectra. The current configuration is set for validation of low-resolution, linear ion trap CID spectra. With this setting, predicted fragment masses that are within 1000 ppm (0.1% of the m/z) of the observed peak are candidate matches that are denoted with a label and a green asterisk. Predicted fragment ion masses that are within 1500 ppm (0.15% of the m/z) of the observed peak may also be labeled and accompanied by a magenta asterisk to indicate the lower confidence assignment. Isotope peaks of an identified peak are labeled with a yellow asterisk. It is worth noting that it is straightforward to change the thresholds for these matches to accommodate high mass accuracy, high resolution MS/MS data from a time-of-flight or orbitrap mass analyzer. Peaks in the MS/MS spectrum may match to multiple different theoretical fragment ions. To highlight the most likely match, we have developed a scoring rubric; the optimal label for a given peak is assigned based on the highest score in the following rubric:
+12 for precursor fragments
+10 for b- or y-series ions
−1 for each neutral loss
+0.5 for closest match to the observed mass
With this rubric, we have tried to capture the most commonly occurring fragment ions associated with correct peptide identifications. Depending on the collision energy used to drive fragmentation, the most abundant ions in the MS/MS spectrum are typically those associated with fragmentation of the peptide backbone (e.g. y- and b-type ions) and neutral losses from the precursor ion. These candidates are therefore given the highest scores in the above rubric. Each neutral loss from these main fragmentation events becomes less likely, so fewer points are awarded to these candidate fragment ion labels. Effectively, if the peptide assignment is correct, then abundant ions in the MS/MS spectrum are more likely to result to be a b- or y-type ion than to be a b- or y-type ion that has undergone 4 for 5 neutral losses. In the current configuration of CAMV, the total points associated with a spectrum are not considered in the final decision as to the quality of the peptide assignment. However, it is conceivable that the number of high-scoring vs. low-scoring fragment ion assignments could be reported as another metric to assist the user in their evaluation of each spectrum. Further color-coding to separate high- and low-scoring peaks is another option that could be considered in future versions of CAMV. From an extensive amount of manual and computational analysis of true- vs. false-positives, the number of unlabeled abundant fragment ions is often critical in determining false-positives [13]. Therefore unlabeled abundant fragment ions, as defined by observed peaks that do not have any predicted fragments within 1500 ppm, are labeled with a red circle.
Label Renaming
Since the scoring rubric does not consider all factors in assigning a label to a given peak in the MS/MS spectrum, the user may change the assigned label. Clicking on an assigned label will display a list of predicted fragment ions that match within tolerance, allowing another label to be chosen. It is also possible to select a label outside of the tolerance window, or outside of the user-defined fragmentation options listed above. This user-defined label will be applied to the peak, but no mass will be calculated and it will be shown with a black asterisk.
Quantitative Accuracy and MS Scan windows
Importantly, CAMV also allows the user to assess the quantitative accuracy of isotopic labeling strategies. For instance, by providing an image of the MS spectrum in the m/z region of the precursor ion isolation window (right side, Figure 3), users can determine whether SILAC peaks might have overlapping contaminant peaks, as can occur in complex mixtures, and then select whether the quantification of this pair should be included in the final dataset. On a similar note, for iTRAQ quantification, the user can determine whether another ion above a given intensity threshold was present in the isolation window and may therefore have altered the iTRAQ marker quantification values. The size of the isolation window highlighted by the gray box in this image can be adjusted by the user according to the settings used for data collection. The image of the MS spectrum in the m/z region of the precursor ion isolation window also allows the user to evaluate whether the charge state of the precursor ion was assigned correctly, an important consideration for low-level precursor ions in complex mixtures.
Validating Spectra
The tree on the left-hand side of the GUI contains proteins rank-ordered by their respective MASCOT scores and peptides for each protein listed alphabetically (first) and numerically (second) in order of the MS/MS spectrum match (Figure 3). For each peptide matched to an MS/MS spectrum, nested under each entry is an assignment with the appropriate number of modifications, initially marked by a filled gray circle. After evaluating the peptide assignment based on all of the above criteria, the user may select from one of three options located on the bottom right of the MS2 window: “Accept”, “Maybe”, and “Reject”. The choice is recorded, so that the peptide assignments can be sorted into lists for future reference, and displayed graphically by changing the color of the filled circle in front of the assignment, allowing the user to keep track of their progress. A search feature is included to locate peptide identifications based on scan number or protein name.
Exporting Validated Spectra
Two buttons on the bottom right of the GUI export PDF figures. “Print Accept List” will print all accepted assignments to the “output\run_name\accept\” folder. Similarly, “Print Maybe List” does the same for all assignments marked “Maybe”.
Exporting Quantitation
iTRAQ or SILAC quantitation for all peptides marked “Accept” will be added to an Excel spreadsheet in the “output\run_name\” folder simultaneously when the “Print Accept List” button is pressed.
Preemptive Exclusion
To facilitate manual validation, many spectra are pre-emptively removed from peak assignment to reduce the time spent on enumerating and preprocessing large numbers of sequences that will never be accepted. The criteria for preemptive exclusion include:
Excessively long peptide sequence
Low database score
Excessive number of PTM permutations
Excessive number of peaks to identify
Incomplete SILAC labeling
Poor MS1 data
Contaminated precursor window (user defined)
The heuristics for most of these criteria are user-definable in CAMV, and can be altered depending on the experimental conditions. For instance, longer peptides are produced by proteolytic digestion with some enzymes, and therefore the ‘excessively long peptide sequence’ and ‘excessive number of peaks to identify’ settings might need to be adjusted. An important feature of the CAMV is that these pre-emptively removed spectra are still listed in the output (see Figure 3), along with the reason(s) why the spectra were not processed. For each of these spectra, the user can click the link, evaluate the reason for removal, and request processing of the spectra. The spectra and peak labels are then displayed for manual validation.
Exemplary Application to Tyrosine Phosphorylation Analysis
To evaluate the application of CAMV to facilitate manual validation of MS/MS spectral assignments, we selected an example data set that had already been manually curated, thereby providing a benchmark in terms of MS/MS spectral assignment and speed of analysis. The particular mass spectrometry dataset chosen was a quantitative analysis of tyrosine phosphorylation in glioblastoma patient tumor xenografts, where accuracy in terms of phosphorylation site identification and quantification were critical for determining the signaling pathways in these tumors [14]. Since the sample preparation involves a 2-stage enrichment for tyrosine phosphorylated peptides from a small amount of starting material, the sample complexity is fairly low, and the total number of MS/MS spectral assignments above a given threshold are less than one thousand.
As expected, CAMV radically accelerated the process while minimally impacting the quality of the final dataset. In fact, the main benefit to the user is a drastic reduction in the time necessary to validate an analysis. Previously, the manual validation process would require days to weeks depending on the complexity of the sample. With CAMV, the preprocessing step (not including database search) takes less than an hour; often, it is only a matter of minutes for phosphotyrosine-enriched iTRAQ-labeled or SILAC-encoded samples. The user-friendly interactive interface with color-coded peak labels makes decision-making on the various spectra fairly straightforward, and the total time required for the analysis was reduced from days/weeks to hours. Although there is still the need for hours of user time to validate the data, the result is a high confidence dataset with minimal false positives, and virtually all of the user interaction time is focused on decision-making rather than tedious table comparisons and arithmetic calculation.
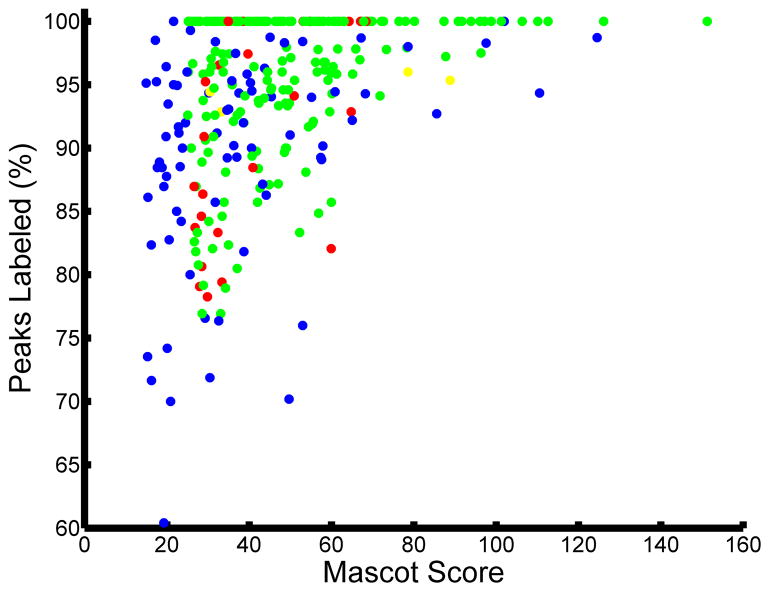
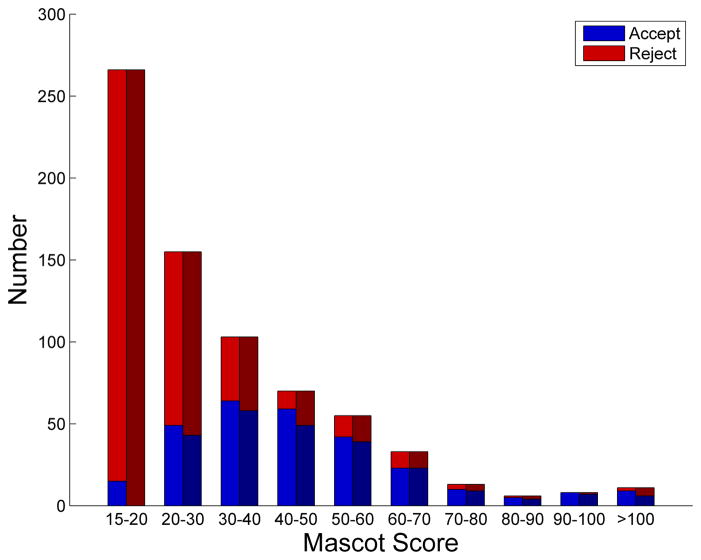
The statistics from the final data set resulting from user validation assisted by the CAMV are highlighted in Figure 5. The final set contained 284 scans, 201 of which were passed all of the internal criteria and were also selected as high confidence assignments by the user (Figure 5A green, also see Supplementary Figure s1). Of the 284 spectra in the final data set, the algorithm pre-emptively excluded 79 scans based on one or more of the criteria listed above (Figure 5A blue, also see Supplementary Figure s2). For many of these 79 spectra, the individual scan Mascot score was below 25, or there were too many peaks to be identified. The heuristics underlying the pre-emptive exclusion decision are user-definable and can be altered in the future to tailor the number of exclusions based on experimental conditions and dataset quality. Because the GUI lists both accepted and pre-emptively excluded assignments, it was fairly straightforward to rapidly check the quality of the excluded spectra and rescue those that were high-confidence matches. These false negatives were reintroduced to the dataset following user validation. Four scans (Figure 5A yellow, also see Supplementary Figure s3A/B) were assigned to an alternate PTM state by the user; although technically not false-positives, the site of modification was incorrectly assigned by our scoring metric. Additionally, there were 33 false positive identifications (Figure 5A red, also see Supplementary Figure s4) where the user did not find a sufficient match to the sequence identified by MASCOT and therefore removed the spectra from the final dataset. The breakdown of accepted and rejected MS/MS spectra versus MASCOT score is shown in Figure 5B for the manually validated and CAMV software. Note that in each bin there were some spectra that were initially rejected that were rescued by the user and some spectra that would have been accepted based on a threshold scoring that were rejected by the user during the manual validation process. All of the accepted validated spectra are available in PDF format in Supplementary Figure s5. At the end of the analysis, despite a fairly rigorous initial threshold, CAMV required less than a day and removed approximately 10% false positives, based on low confidence in the MACOT-identified spectral assignments.
Figure 5.
Results of CAMV applied to quantitative tyrosine phosphorylation dataset. (A) All peptide matches following user validation of the dataset. Color code: Agreement between algorithm and user 201/317(green), alternate identification chosen by user 4/317 (yellow), additional assignment included by user 79/317 (blue), and assignment rejected by user 33/317 (red). (B) Distribution of user and CAMV decisions versus MASCOT score. Note that in many cases the user rescued the spectra that were pre-emptively excluded by the software, while in other cases the user rejected the spectral assignment based on the poor quality of the match.
Conclusion
CAMV is a software package to aid the manual validation process of MSMS peptide identification data. This software package has drastically improved a tedious and time-consuming task that vastly exceeded the sample analysis time, creating a backlog in the workflow of many projects. By partially automating this process, we have shifted the human focus to the decision-making portion of the task, allowing user judgment to be rapidly applied. We hope that CAMV will provide researchers with a streamlined way to perform their manual validation without having to rely solely upon false discovery rates when analyzing and reporting their data.
Supplementary Material
Exemplar green identification where the user and the computer picked the same assignment.
Exemplar blue identification where the user rescued an identification initially excluded by the computer for having a Mascot score below 25.
Exemplar yellow identification where the user changed the identification made by the computer (A) to (B). The decision was made based on prior knowledge of the sample preparation conditions, which included a pY immunoprecipitation.
Exemplar red identification where the user rejected an identification initially included by the computer.
Accepted tandem mass spectra resulting from CAMV application to tyrosine phosphorylation analysis of glioblastoma patient tumor xenografts.
Appendices
Version Information
All analyses were performed with the following software versions:
Proteowizard: Release 2.0.1749 (used for included data), 3.0.4323 (update included with CAMV distribution)
Thermo XCalibur: 2.1.0 SP1.1162
DTA Supercharge: 2.0b1 (part of MSQUANT 2.0b1)
MATLAB: 7.13.0.564 (R2011b)
MATLAB MCR: 7.16
Mascot: Release 2.1.03, additional support for 2.4.1
Mascot Search Parameters
Database: Human-2009 (37743 sequences; 17175626 residues)
Enzyme: Trypsin
Fixed modifications: iTRAQ8plex (K),iTRAQ8plex (N-term),Carbamidomethyl (C)
Variable modifications: Oxidation (M),Phospho (ST),Phospho (Y)
Mass values: Monoisotopic
Protein Mass: Unrestricted
Peptide Mass Tolerance: ± 10 ppm
Fragment Mass Tolerance: ± 0.8 Da
Max Missed Cleavages: 2
Number of queries: 14406
The CAMV Software Package is freely available at http://web.mit.edu/icbp/data/
Footnotes
Publisher's Disclaimer: This is a PDF file of an unedited manuscript that has been accepted for publication. As a service to our customers we are providing this early version of the manuscript. The manuscript will undergo copyediting, typesetting, and review of the resulting proof before it is published in its final citable form. Please note that during the production process errors may be discovered which could affect the content, and all legal disclaimers that apply to the journal pertain.
References
- 1.Yates JR, 3rd, Eng JK, McCormack AL, Schieltz D. Method to correlate tandem mass spectra of modified peptides to amino acid sequences in the protein database. Anal Chem. 1995;67:1426–36. doi: 10.1021/ac00104a020. [DOI] [PubMed] [Google Scholar]
- 2.Perkins DN, Pappin DJ, Creasy DM, Cottrell JS. Probability-based protein identification by searching sequence databases using mass spectrometry data. Electrophoresis. 1999;20:3551–67. doi: 10.1002/(SICI)1522-2683(19991201)20:18<3551::AID-ELPS3551>3.0.CO;2-2. [DOI] [PubMed] [Google Scholar]
- 3.Craig R, Cortens JC, Fenyo D, Beavis RC. Using annotated peptide mass spectrum libraries for protein identification. Journal of proteome research. 2006;5:1843–9. doi: 10.1021/pr0602085. [DOI] [PubMed] [Google Scholar]
- 4.Cox J, Neuhauser N, Michalski A, Scheltema RA, Olsen JV, Mann M. Andromeda: a peptide search engine integrated into the MaxQuant environment. Journal of proteome research. 2011;10:1794–805. doi: 10.1021/pr101065j. [DOI] [PubMed] [Google Scholar]
- 5.White FM. The potential cost of high-throughput proteomics. Science signaling. 2011;4:pe8. doi: 10.1126/scisignal.2001813. [DOI] [PubMed] [Google Scholar]
- 6.Kall L, Storey JD, MacCoss MJ, Noble WS. Assigning significance to peptides identified by tandem mass spectrometry using decoy databases. Journal of proteome research. 2008;7:29–34. doi: 10.1021/pr700600n. [DOI] [PubMed] [Google Scholar]
- 7.Elias JE, Gygi SP. Target-decoy search strategy for increased confidence in large-scale protein identifications by mass spectrometry. Nat Methods. 2007;4:207–14. doi: 10.1038/nmeth1019. [DOI] [PubMed] [Google Scholar]
- 8.Klammer AA, Reynolds SM, Bilmes JA, MacCoss MJ, Noble WS. Modeling peptide fragmentation with dynamic Bayesian networks for peptide identification. Bioinformatics. 2008;24:i348–56. doi: 10.1093/bioinformatics/btn189. [DOI] [PMC free article] [PubMed] [Google Scholar]
- 9.Martin DM, Nett IR, Vandermoere F, Barber JD, Morrice NA, Ferguson MA. Prophossi: automating expert validation of phosphopeptide-spectrum matches from tandem mass spectrometry. Bioinformatics. 2010;26:2153–9. doi: 10.1093/bioinformatics/btq341. [DOI] [PMC free article] [PubMed] [Google Scholar]
- 10.Nichols AM, White FM. Manual validation of peptide sequence and sites of tyrosine phosphorylation from MS/MS spectra. Methods Mol Biol. 2009;492:143–60. doi: 10.1007/978-1-59745-493-3_8. [DOI] [PubMed] [Google Scholar]
- 11.Zhang J, Chen Y, Zhang Z, Xing G, Wysocka J, Zhao Y. MS/MS/MS reveals false positive identification of histone serine methylation. Journal of proteome research. 2010;9:585–94. doi: 10.1021/pr900864s. [DOI] [PMC free article] [PubMed] [Google Scholar]
- 12.Chambers MC, MacLean B, Burke R, Amode D, Ruderman DL, Neumann S, Gatto L, Fischer B, Pratt B, Egertson J, Hoff K, Kessner D, Tasman N, Shulman N, Frewen B, Baker TA, Brusniak MY, Paulse C, Creasy D, Flashner L, Kani K, Moulding C, Seymour SL, Nuwaysir LM, Lefebvre B, Kuhlmann F, Roark J, Rainer P, Detlev S, Hemenway T, Huhmer A, Langridge J, Connolly B, Chadick T, Holly K, Eckels J, Deutsch EW, Moritz RL, Katz JE, Agus DB, MacCoss M, Tabb DL, Mallick P. A cross-platform toolkit for mass spectrometry and proteomics. Nature Biotechnology. 2012;30:918–920. doi: 10.1038/nbt.2377. [DOI] [PMC free article] [PubMed] [Google Scholar]
- 13.Lahesmaa-Korpinen AM, Carlson SM, White FM, Hautaniemi S. Integrated data management and validation platform for phosphorylated tandem mass spectrometry data. Proteomics. 2010;10:3515–24. doi: 10.1002/pmic.200900727. [DOI] [PMC free article] [PubMed] [Google Scholar]
- 14.Johnson H, Del Rosario AM, Bryson BD, Schroeder MA, Sarkaria JN, White FM. Molecular Characterization of EGFR and EGFRvIII Signaling Networks in Human Glioblastoma Tumor Xenografts. Molecular & cellular proteomics: MCP. 2012;11:1724–40. doi: 10.1074/mcp.M112.019984. [DOI] [PMC free article] [PubMed] [Google Scholar]
Associated Data
This section collects any data citations, data availability statements, or supplementary materials included in this article.
Supplementary Materials
Exemplar green identification where the user and the computer picked the same assignment.
Exemplar blue identification where the user rescued an identification initially excluded by the computer for having a Mascot score below 25.
Exemplar yellow identification where the user changed the identification made by the computer (A) to (B). The decision was made based on prior knowledge of the sample preparation conditions, which included a pY immunoprecipitation.
Exemplar red identification where the user rejected an identification initially included by the computer.
Accepted tandem mass spectra resulting from CAMV application to tyrosine phosphorylation analysis of glioblastoma patient tumor xenografts.


