

Abstract
Objectives
Few studies have examined the relationship between physical activity and sleep among women with vasomotor symptoms. We examined the associations of habitual leisure time and household physical activity with sleep characteristics among women reporting vasomotor symptoms.
Methods
A subcohort of women (N=52; 27 White, 25 African American) in the Study of Women’s Health across the Nation were assessed over 4 nights for self-reported and actigraphic sleep measurement. Women were between the ages of 54 and 63y, currently experiencing vasomotor symptoms, and were not taking SSRI’s or hormone therapy. The associations between physical activity (leisure time, household) and sleep (diary, actigraphy, global sleep quality), as well as interactions by race and BMI, were assessed using logistic regression and general estimating equations.
Results
Greater leisure time physical activity was associated with higher odds of rating global sleep quality as good [OR (95% confidence interval)= 8.08 (1.5, 44.5), p=.02]. Greater household physical activity was associated with more favorable diary-reported sleep characteristics, including fewer awakenings during the night [B(SE)=−.14(.06), p=.01]. Exploratory analyses suggest that household physical activity was associated with more favorable sleep characteristics primarily among White and non-obese women.
Conclusions
Greater levels of habitual physical activity, particularly non-leisure time physical activity, were associated with more favorable sleep characteristics. Considering the potential impact of physical activity on sleep, even at the relatively modest levels characteristic of household physical activity, may be important for women with vasomotor symptoms, a subgroup at high risk for sleep problems.
Keywords: physical activity, sleep, women, vasomotor symptoms
INTRODUCTION
Sleep disturbance and reports of poor sleep are common in women and become increasingly prevalent as women transition through menopause1, 2. Women with vasomotor symptoms (VMS, i.e. hot flashes and night sweats) appear to be particularly vulnerable, with reported VMS being one of the most consistent predictors of sleep disturbance among midlife women1, 3–5. However, less is known about factors that may buffer against sleep disturbance. Moreover, poor sleep is associated with obesity6, cardiovascular disease7, and all-cause mortality8. Thus, identifying lifestyle factors associated with better sleep among midlife women with VMS may have important implications for women’s health.
Physical activity may be one lifestyle factor important for sleep. Indeed, greater levels of physical activity are robustly associated with better subjective sleep quantity and quality in epidemiologic studies9, 10. However, studies in women transitioning through menopause are less consistent, with greater physical activity being associated with better sleep in some11, 12, but not all13–15, studies. Few studies have examined the relationship between physical activity and sleep among midlife women specifically with VMS, a population particularly vulnerable to sleep problems. Moreover, there has been little consideration of non-leisure time physical activity, important as both leisure time (i.e. structured exercise, sports) and non-leisure time (i.e. household, occupational, transportation) physical activity contribute to daily energy expenditure and are associated with reduced health risk16–19.
Non-leisure time physical activity, including household physical activity, may be particularly important for midlife women. In general, women participate in less leisure time physical activity but similar or greater levels of household physical activity than men20, 21. Notably, several risk factors for VMS are similar to risk factors for lower leisure time physical activity22. Additionally, acute bouts of physical activity may increase core body temperature and potentially trigger VMS23–25, which may further discourage women from participating in voluntary, leisure time activities. Thus, considering of a range of physical activity types in relations to sleep may be important for midlife women. Finally, it is important to examine these relationships in minority women given that minority women (particularly African American women) participate in less physical activity26, have poorer sleep characteristics27, and higher rates of obesity28 than White women.
The purpose of this study was to examine the associations of leisure time and household physical activity with sleep characteristics (actigraphy, diary, global sleep quality) among African American and White midlife women with VMS. We hypothesized that greater levels of both leisure time and household physical activity would be related to more favorable sleep characteristics. In exploratory fashion we examined whether relationships between physical activity and sleep varied by race or body mass index (BMI), given that African American race and obesity are associated with lower physical activity and poorer sleep6, 27, 29, 30.
METHODS
Study Population
A subcohort of women (N=52) were recruited from the Pittsburgh site of the Study of Women’s Health Across the Nation (SWAN). A detailed description of the SWAN procedures has been previously reported31. Briefly, SWAN is a multicenter, multiethnic cohort study designed to assess women across the menopausal transition. A total of 3,302 women, aged 42 to 52 years, with an intact uterus, currently menstruating, and not using oral contraceptives or hormone therapy were enrolled between 1996 and 1997. Participants were assessed at enrollment and annually thereafter. By design, only non-Hispanic White and African American women were recruited at the Pittsburgh site.
At their 10th annual visit for SWAN, between the years 2008 and 2009, a subset of women were invited to participate in SWAN FLASHES, an ancillary study of SWAN recruiting midlife women with VMS. Eligibility requirements for SWAN FLASHES included having an intact uterus and both ovaries, currently (within the past two weeks) experiencing hot flashes or night sweats, and not being pregnant. Women using oral contraceptives, hormone therapy, or selective serotonin reuptake inhibitor/serotonin-noradrenaline reuptake inhibitor antidepressants were also excluded. Given the unequal distribution of BMI by race in women28, participants were recruited such that an approximately equal number of White and African American women were represented in each obesity category (lean: <25 kg/m2, overweight: 25–29 kg/m2, obese: ≥30.0 kg/m2). Fifty-two women (27 White, 25 African American) were recruited and completed the study.
Protocol
Participants were assessed for height and weight and completed questionnaires at their first SWAN FLASHES visit. Women were equipped with a wrist Actiwatch and a physiologic VMS monitor and were given instructions for completing a sleep diary. Women wore the Actiwatch and VMS monitor and kept a sleep diary for two separate 48-hour periods, conducted within approximately four weeks of each other. Participants provided written informed consent. The protocol was approved by the University of Pittsburgh Institutional Review Board.
Measurements
Physical activity
A modified Kaiser Physical Activity Survey (KPAS), adapted from the Baecke questionnaire26, was used to assess habitual physical activity. The modified KPAS assessed the participant’s usual physical activity during the past 12 months in three sub-domains: sports/exercise, household/caregiving, active living habits. Occupational physical activity was not evaluated because many of the women (25% of total sample) were not currently employed outside of the home. The sports/exercise index asked participants to indicate the frequency, duration, and intensity of their two most common sports/exercise activities. The household/caregiving index asked about the amount of time spent caregiving, preparing or cleaning up from meals, and doing routine chores requiring light, moderate, and vigorous effort. Scoring of the KPAS was based on recommendations by Sternfeld et al29. Briefly, activity indices were computed for each domain by averaging the domain-specific responses (i.e. sum of domain-specific responses divided by number of items). Average values for each domain ranged from 1 to 5, with higher values indicative of greater activity levels. A total activity score was calculated by summing the 3 individual sub-domain indices. All subjects had complete physical activity data. For the present analyses we used the sports/exercise index to represent leisure time physical activity and the household/caregiving index to represent household physical activity. The KPAS has been previously validated for use in both White and racial/ethnic minority women29, 32.
Sleep
Actigraphy
Participants wore a Minimitter Acitwatch-64 (Respironics Inc., Murrysville, PA) on their non-dominant wrist and completed a sleep diary before going to bed and upon waking each day of the study protocol. Actiwatch data from approximately four nights (separate 2-consecutive night periods) were downloaded and analyzed using Actiware Version 5.04 software program with a 60 second epoch. Bedtimes and wake times from the sleep diary were used to define rest intervals for calculation of sleep-wake variables. Periods of awakening were defined as a total activity count greater than a sensitivity threshold 40 counts/min. Sleep parameters were estimated with proprietary Respironics algorithms. Actigraphy indices considered here were total sleep time (time spent sleeping within the bed time and wake time excluding periods of awakening during the night), wakefulness after sleep onset (WASO; total minutes of wakefulness between sleep onset and final wake time) and sleep efficiency (total sleep time/time in bed × 100%). Participants wore the Actiwatch for an average of 4.13 nights, with 50 women (95% of sample) having at least four nights of valid actigraphy data. This provided a total of 215 nights of actigraphy data for analyses.
Diary
Participants completed a sleep diary on concurrent nights of actigraphy measurement. Upon waking each morning, participants recorded the time they woke up and the time they went to bed the previous night. They also reported number of awakenings, minutes of awakenings, number of VMS, and rated that night’s sleep compared with a usual night (5-point scale ranging from “much worse” to “much better”). Ninety-five percent of the sample had a minimum of four nights of complete sleep diary data (mean = 4.15 nights), providing a total of 216 nights of diary data for analyses.
Global sleep quality rating
At their initial visit, participants were asked to rate their overall (i.e. global) sleep quality in the past month on a 4-point scale (“very bad” to “very good”). Global sleep quality was categorized as 0 (very bad or fairly bad) and 1 (fairly good or very good) for analyses due to small cell sizes.
Demographics, health behaviors, and physical characteristics
Demographics, medical history, medication use, and health behaviors were assessed by questionnaire during the participant’s initial visit. Race was assessed by the participant’s answer to the question “How would you describe your primary racial or ethnic group?” Education was obtained by the participant reporting their highest grade level completed, categorized into 3 groups (graduated high school, some college/vocational training, college or higher) for analysis. Financial strain was assessed by the question “How hard is it for you to pay for the very basics like food, housing, medical care, and heating?” answered as “very hard”, “somewhat hard”, or “not hard at all.” Financial strain was categorized as yes (very or somewhat hard to pay for basics) and no (not hard to pay for basics) because of small cell sizes. Marital status was assessed by the participant indicating whether they were currently married, never married, separated, divorced, or widowed (categorized as married or unmarried due to small cell sizes). Depressive symptoms were assessed via the Center for Epidemiologic Studies Depression Survey (CESD)33, a 20-item instrument asking about common symptoms of depression over the past week. Higher scores (range 0–60) on the CESD are indicative of greater depressive symptoms. Self-rated general health compared to the previous year was assessed on a 5-point scale (“much worse” to “much better”). Physiologic VMS were determined from a Biolog skin conductance monitor (3991/2-SCL, UFI; Morro Bay, CA)34, 35. Women also self-reported VMS in a sleep diary (described above). Menopause status was determined from reporting of bleeding patterns, with postmenopausal status defined as >12 months of amenorrhea and late perimenopausal status as 3–12 months of amenorrhea (over 90% of the women were postmenopausal, with the remainder late perimenopausal). Height was measured with a fixed stadiometer (Seca, Hanover, MD). Weight was measured with a calibrated balance beam scale (Healthometer Inc, Alsip, IL). BMI was calculated as kilograms/meters squared.
Analytic Plan
Variables were examined for normality and small cell sizes. Skewed variables were transformed as follows: total sleep time, WASO, and depressive symptoms were square root transformed; diary reported number and minutes of awakening were natural log transformed; and sleep efficiency was natural log transformed on (100-efficiency). Differences in variables between African American and White women were examined via chi-squared and t-tests. Linear and logistic regressions were used to assess associations between study variables and BMI, measured continuously. Associations between physical activity, covariates, and global sleep quality were assessed with logistic regression. Associations between physical activity, covariates, and sleep characteristics (diary, actigraphy) were assessed using generalized estimating equations, with an autoregressive correlation matrix and nights nested within women. Leisure time physical activity and household physical activity were considered in separate models. Interactions between physical activity and race, as well as interactions between physical activity and BMI, were assessed with cross-product terms in logistic regression and generalized estimating equation models. Covariates (age, depressive symptoms, education, marital status, BMI, race) were chosen on an a priori basis due to prior documented associations with sleep characteristics8, 27, 36–38. We considered education and financial strain as indicators of socioeconomic status. Education was selected as the socioeconomic covariate in final analyses given that education is a preferred measure of SES among women and retired people39, 40 and to the fact that results were comparable with either socioeconomic variable in the models. The number of VMS (physiologic, self-reported) was also considered as a potential covariate, but given its limited relation to sleep in this sample (physiologic VMS)41 and no discernable impact on the models presented here (physiologic or self-reported VMS), VMS was not included in final models. Menopause status was also considered as a covariate, but was not included in the final analyses because over 90% of the sample was postmenopausal. All tests were two-sided, with an alpha set at .05.
RESULTS
Participants were on average 58 years old and overweight or obese (Table 1). African American women reported greater financial strain (p=.004), were less likely to be married (p<.001), and had more physiological VMS (p=.02) compared with White women. BMI was associated only with more financial strain (p=.02). African American women had shorter total sleep time; no other physical activity or sleep variables differed by race (Table 2). When comparing the physical activity levels of our sample to data from a larger sample of SWAN participants42, household physical activity levels were broadly consistent between studies, whereas leisure time physical activity was lower in the present study.
Table 1.
Participant characteristics (N=52)
| Age, mean (SD), y | 58.3 (2.3) |
| Race, n (%) | |
| White | 27 (51.9) |
| Black | 25 (48.1) |
| BMI, mean (SD), kg/m2 | 29.9 (5.0) |
| BMI category, n (%) | |
| Normal weight, <25 kg/m2 | 10 (19.2) |
| Overweight, 25–30 kg/m2 | 18 (34.6) |
| Obese, ≥30 kg/m2 | 24 (46.2) |
| Married, n (%)a | 35 (66.0) |
| Education, n (%) | |
| Graduated high school | 10 (19.2) |
| Some college/vocational training | 27 (51.9) |
| College or above | 15 (28.8) |
| How hard is it to pay for basics, n (%)a,b | |
| Very or somewhat hard | 17 (32.7) |
| Not hard | 35 (67.3) |
| Smoking (current), n (%) | 6 (11.5) |
| Self-rated health (relative to last year), n (%) | |
| Better/much better | 9 (17.3) |
| Same | 36 (69.2) |
| Worse/much worse | 7 (13.5) |
| Depressive symptoms, mean (SD)c | 7.4 (6.5) |
| Post menopausal, n (%) | 47 (90.4) |
| No. of diary- reported VMS/24 h, mean (SD) | 6 (3) |
| No. of physiological VMS/24 h, mean (SD)a | 18 (10) |
BMI = body mass index
VMS = vasomotor symptoms
significant difference by race (p<.05)
significantly associated with BMI (p<.05)
Depressive symptoms were assessed via the Center for Epidemiologic Studies Depression Survey; higher scores indicate more depressive symptoms (range 0–60)
Table 2.
Mean (SD) of physical activity and sleep characteristics of the total sample and by race
| Total Sample | White | African American | |
|---|---|---|---|
| Questionnaire reported physical activity | |||
| Sports indexa | 2.2 (.5) | 2.2 (.5) | 2.1 (.5) |
| Household/care giving indexa | 2.6 (.8) | 2.6 (.7) | 2.5 (.9) |
| Actigraphy measured sleep | |||
| Total sleep time (min)b,* | 360.4 (61.1) | 377.7 (52.4) | 341.7 (65.3) |
| WASO (min)c | 53.9 (21.7) | 53.1 (18.5) | 54.7 (25.0) |
| Efficiency (%)d | 81.1 (7.1) | 82.6 (5.4) | 79.6 (8.4) |
| Diary-reported sleep | |||
| Number of awakenings | 2.7 (1.4) | 2.8 (1.7) | 2.7 (.9) |
| Total minutes of awakenings | 16.0 (13.8) | 14.9 (10.9) | 16.4 (16.2) |
| This night compared with usual nighte | 2.0 (.4) | 2.0 (.4) | 1.9 (.4) |
| Global sleep qualityf | 2.8 (.8) | 2.7 (.8) | 2.8 (.8) |
Range 1–5; higher scores indicate higher activity levels
Total sleep time: time spent sleeping within the bed time and wakeup time excluding periods of awakening during the night
WASO: wakefulness after sleep onset; total minutes of wakefulness between sleep onset and final wake time
Sleep efficiency: total sleep time/time in bed × 100%
Range: 0 (much worse) to 4 (much better)
Range: 1 (very bad) to 4 (very good)
p<.05, significant difference by race
In multivariable models (covariates: age, education, depressive symptoms, marital status, race, BMI) greater household physical activity was significantly associated with fewer diary-reported number and minutes of awakening (Table 2). Additionally, women who reported greater leisure time physical activity were more likely to report their global sleep quality as good [OR (95% confidence interval)=8.08 (1.5, 44.5), p=.02]. Neither leisure time nor household physical activity were related to actigraphy-assessed sleep.
We next examined whether relationships between physical activity and sleep varied by race or BMI. The associations between household physical activity and diary-reported sleep varied significantly by race, such that greater household physical activity was associated with better reported sleep among White women, but not among African American women (Figure 1). These interactions remained significant when adjusting for covariates (age, depressive symptoms, education, marital status, BMI). BMI also modified relations between household physical activity and actigraphy-assessed WASO (Figure 2) and sleep efficiency, such that greater household physical activity was associated with less WASO and greater sleep efficiency only among women with a lower BMI. Similarly, household physical activity was associated with fewer diary-reported number of awakenings among women with a lower BMI but not among women with a higher BMI (interaction between BMI and household activity: p=0.02; adjusting for age, depressive symptoms, education, marital status, and race; data not shown). In contrast to household activity, no interactions between leisure time physical activity and race/BMI were noted for any sleep characteristics.
Figure 1.
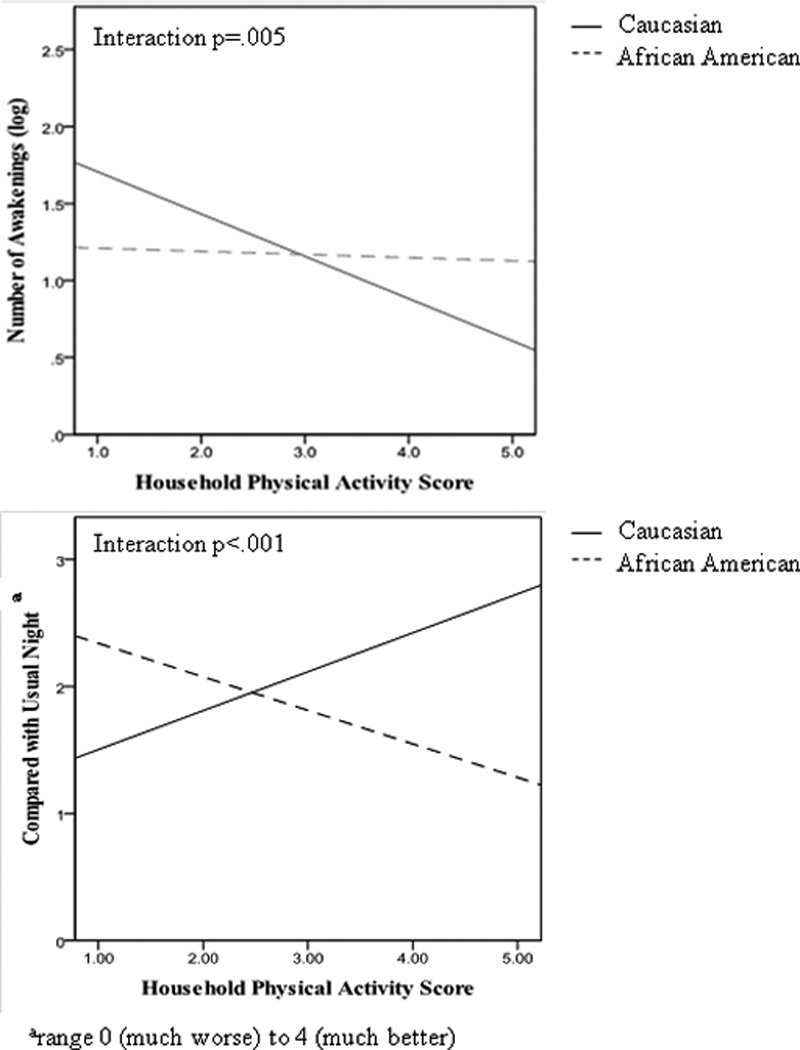
Unadjusted relationship between household physical activity and diary-reported sleep characteristics (top: number of awakenings; bottom: compared to a usual night) by race. Fitted lines for White (solid) and African American (dashed) women were derived from bivariate correlations between household physical activity and sleep variables. Significance testing (including of interaction terms) conducted with general estimating equations.
Figure 2.
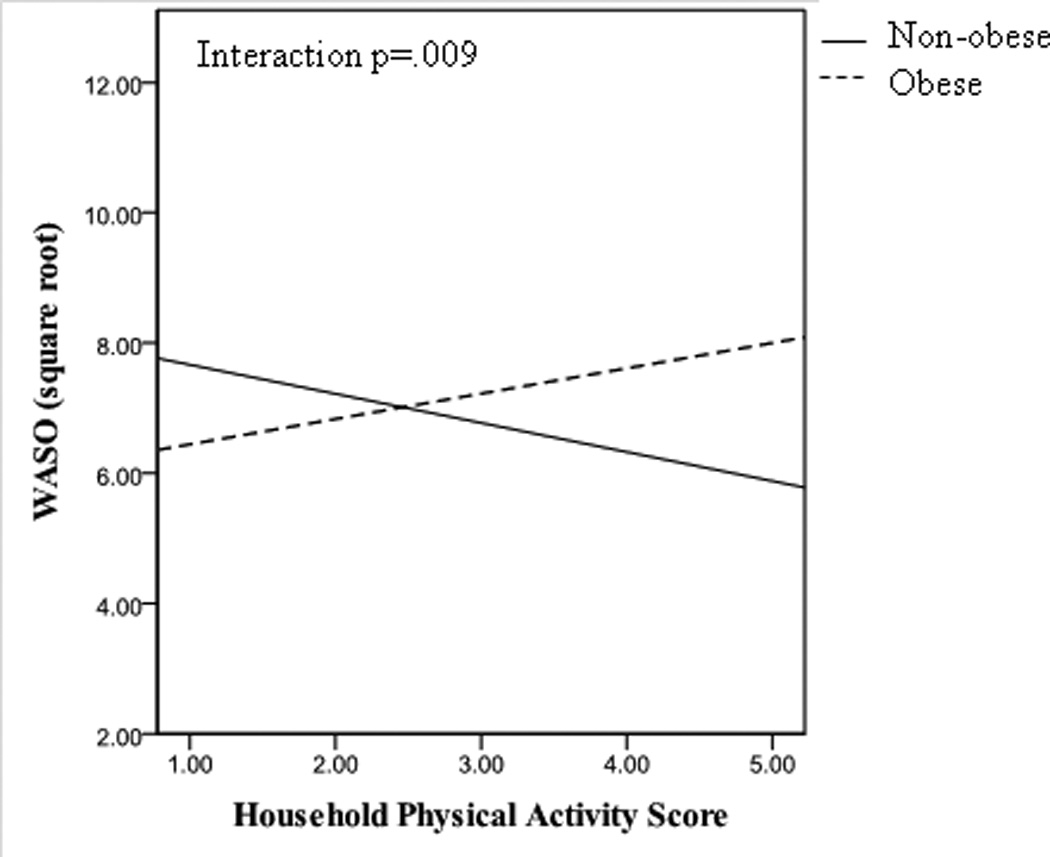
Unadjusted relationship between household physical activity and actigraphy-assessed wake after sleep onset (WASO) in non-obese and obese women. Fitted lines for non-obese (solid) and obese (dashed) women were derived from bivariate correlations between household physical activity and WASO. Significance testing (including of interaction term) conducted with general estimating equations.
We conducted several additional analyses. First, we examined total activity in relations with sleep. Total activity was not associated with any sleep variables in main effect models, but showed similar interactions with race as household physical activity (data not shown). Second, we considered both race-household and BMI-household physical activity interactions together in relation to sleep characteristics, and results were unchanged. We also considered the possibility of a 3-way interaction (race-BMI-household physical activity), which was not significant, although our sample size was limited for these 3-way interactions. We also considered financial strain as the indicator of socioeconomic position instead of education and results were unchanged (data not shown). Finally, we attempted to investigate factors that might further elucidate the observed race and BMI variations in relations between physical activity and sleep. Given the heterogeneity of the household physical activity scale, we examined whether there were significant racial or BMI differences in the subcomponents of the household physical activity scale (caregiving, preparing of cleaning up from meals, and chores requiring light, moderate, or vigorous effort), and no significant differences were observed.
DISCUSSION
Women with VMS who engaged in greater levels of physical activity reported better sleep and fewer nighttime awakenings, mainly if White and not obese. These associations were predominantly due to household/caregiving activities rather than sports/exercise. Notably, sports/exercise levels were low among these women.
Our study is notable given its focus on physical activity (leisure time and non-leisure time) and sleep among women experiencing VMS who are at high risk for sleep disturbance. While a positive association between leisure time physical activity and better self-reported sleep is a robust finding in large epidemiologic studies9, 10, results from studies specific to women transitioning through menopause are less consistent. Previous studies have focused primarily on leisure time physical activity. Indeed, other findings from a large group of younger SWAN participants (less than half of whom had VMS) show higher leisure time physical activity to be associated with better sleep [personal communication, August, 2012]. In the present study, leisure time physical activity was associated with better global sleep quality ratings. However, non-leisure time physical activity might also be relevant for women with VMS, given that these women are likely to participate in low levels of leisure time physical activity. Acute exercise increases core body temperature which can serve as a trigger for VMS23–25, which may discourage women from voluntarily participating in structured leisure time physical activity. Notably, leisure time physical activity in the present study was markedly lower than that of the larger SWAN cohort42. These low levels limited our ability to evaluate associations for leisure time physical activity. However, our findings confirm broadly that physical activity, even when carried outside of structured exercise, may be associated with some improvements in sleep among women with VMS.
Including both subjective and objective measurement of sleep in research studies is important given that subjective reports of sleep often differ from objective assessments43. Most previous work reporting positive relationships between physical activity and sleep rely on subjective assessments of sleep; results from studies that objectively measure sleep have produced more mixed results9, 44 (except perhaps in the case of higher intensity leisure time physical activity9, 45). Our results are generally consistent with others who have found limited associations between physical activity and objective measures of sleep, particularly in the case of lower intensity activity. However, our results are novel given their focus on household activity. Moreover, self-reported sleep characteristics are important to consider given that they are associated with obesity6, cardiovascular disease7, and all-cause mortality8.
We found that associations between household physical activity and sleep were most pronounced for White and non-obese women. Although racial differences in BMI are evident in population-based samples of midlife women28, this sample was unique in that it was specifically selected to match on race by BMI category, allowing for a degree of disaggregation of these two constructs. We considered several possibilities for the observed differences by race and BMI. There are marked differences in both sleep and physical activity by race and BMI in population-based studies6, 27, 30, 46, which may have obscured the more subtle effects of physical activity on sleep in the high BMI or African American women. However, few race or BMI differences in sleep characteristics and no race or BMI differences in physical activity were observed in the present study. Also deserving consideration is that the household physical activity scale incorporated diverse activities, including caregiving and vigorous housework. We postulated that these activities could differ by race and BMI and be important for the observed effects observed here. However, we found no clear differences by race or BMI in the types of household activities performed. Thus, the reasons for these differences are not immediately apparent and future work should seek to further examine potential reasons for racial and BMI differences in relations between household physical activity and sleep.
This study has several limitations. The sample consisted entirely of women with VMS, and although VMS is quite prevalent among midlife women, our results cannot be generalized to women without VMS. Physical activity was self-reported which may be affected by memory, cognition, and recall bias47. Physical activity assessed in the KPAS reflects average activity levels over an entire year. Thus, we cannot discriminate between the acute and chronic effects of physical activity on sleep. Additionally, many women in our study were not employed outside of the home so we could not assess the relationship between occupational physical activity and sleep. We did not assess sleep stage. Previous work has shown that exercise can affect sleep stages, including slow wave sleep and rapid eye movement sleep9, 10. Furthermore, we could not account for other factors related to sleep in women, including sleep apnea or periodic leg movements. The small sample size may have limited our ability to identify differences, particularly when assessing interactions. Finally, the cross sectional design limits our ability to determine the directionality of the relationship between physical activity and sleep. Although we hypothesized that physical activity may be beneficial for sleep, it is also plausible that better sleep makes women more likely to be physically active.
The study also had several strengths. We recruited an approximately equal number of White and African American women, which is notable given the limited representation of minority women in studies examining the relationship between physical activity and sleep. Additionally, given the high rates of obesity in African American women, we recruited women to reduced differences in BMI between African American and White women to examine the associations of race somewhat independent from the effects of obesity. Finally, we examined the relationship between physical activity and sleep among women with VMS who are at high risk for sleep disturbance.
CONCLUSIONS
In summary, this study provides supporting evidence that greater habitual physical activity may be associated with more favorable sleep characteristics among midlife women with VMS, particularly for White and non-obese women. Further work is needed to both replicate these findings in larger samples and to identify the mechanisms that may link physical activity, including household physical activity, to sleep. Additionally, more work is needed to determine how other types of non-leisure time physical activity (e.g. occupational activities) are related to sleep. This study suggests that considering a range of physical activity types (leisure time, non-leisure time) may be important among midlife women and points to the importance of evaluating protective factors for sleep among ethnic minority and obese women. The results also suggest the potential promise for considering physical activity as one buffer against the sleep disturbance commonly experienced by women with VMS.
Table 3.
Associations between physical activity and actigraphy-assessed sleep (top) and diary-reported sleep (bottom) characteristics
| Sleep Timea | Efficiencyb | WASOa | |
| Sports/Exercise | −.13 (.35) | .07 (.10) | −.18 (.34) |
| Household | −.30 (.24) | .01 (.07) | .03 (.24) |
| # of Awakeningsc | Minutes of Awakeningc | Compared with Usual | |
| Sports/Exercise | −.06 (.09) | −.18 (.17) | .04 (.12) |
| Household | −.14 (.06)* | −.32 (.11)** | −.08 (.08) |
Data are regression coefficient (SE) from generalized estimating equations
Covariates: age, education, depressive symptoms, marital status, race, BMI
WASO = wake after sleep onset
Square root transformed
Natural log transformed on (100-efficiency)
Natural log transformed
p<.05
p<.01
ACKNOWLEDGEMENTS
The Study of Women’s Health Across the Nation (SWAN) has grant support from the National Institutes of Health (NIH), Department of Health and Human Services, through the National Institute on Aging (NIA), the National Institute of Nursing Research (NINR) and the NIH Office of Research on Women’s Health (ORWH; Grants NR004061, AG012505, AG012535, AG012531, AG012539, AG012546, AG012553, AG012554, and AG012495). This work was additionally supported by the NIH through the NIA (Grant AG029216 to R.C.T.) and NHLBI T32 HL07560.
The content of this article is solely the responsibility of the authors and does not necessarily represent the official views of the NIA, NINR, ORWH, or the NIH.
Footnotes
No authors have any conflicts of interest.
REFERENCES
- 1.Kravitz HM, Zhao X, Bromberger JT, et al. Sleep disturbance during the menopausal transition in a multi-ethnic community sample of women. Sleep. 2008;31:979–990. [PMC free article] [PubMed] [Google Scholar]
- 2.National Institutes of Health State-of-the-Science Conference statement: management of menopause-related symptoms. Ann Intern Med. 2005;142:1003–1013. [PubMed] [Google Scholar]
- 3.Thurston RC, Blumenthal JA, Babyak MA, Sherwood A. Association between hot flashes, sleep complaints, and psychological functioning among healthy menopausal women. Int J Behav Med. 2006;13:163–172. doi: 10.1207/s15327558ijbm1302_8. [DOI] [PubMed] [Google Scholar]
- 4.Xu H, Thurston RC, Matthews KA, et al. Are hot flashes associated with sleep disturbance during midlife? Results from the STRIDE cohort study. Maturitas. 2012;71:34–38. doi: 10.1016/j.maturitas.2011.10.003. [DOI] [PMC free article] [PubMed] [Google Scholar]
- 5.Kravitz HM, Joffe H. Sleep during the perimenopause: a SWAN story. Obstet Gynecol Clin North Am. 2011;38:567–586. doi: 10.1016/j.ogc.2011.06.002. [DOI] [PMC free article] [PubMed] [Google Scholar]
- 6.Beccuti G, Pannain S. Sleep and obesity. Curr Opin Clin Nutr Metab Care. 2011;14:402–412. doi: 10.1097/MCO.0b013e3283479109. [DOI] [PMC free article] [PubMed] [Google Scholar]
- 7.Cappuccio FP, Cooper D, D'Elia L, Strazzullo P, Miller MA. Sleep duration predicts cardiovascular outcomes: a systematic review and meta-analysis of prospective studies. Eur Heart J. 2011;32:1484–1492. doi: 10.1093/eurheartj/ehr007. [DOI] [PubMed] [Google Scholar]
- 8.Cappuccio FP, D'Elia L, Strazzullo P, Miller MA. Sleep duration and all-cause mortality: a systematic review and meta-analysis of prospective studies. Sleep. 2010;33:585–592. doi: 10.1093/sleep/33.5.585. [DOI] [PMC free article] [PubMed] [Google Scholar]
- 9.Youngstedt SD. Effects of exercise on sleep. Clin Sports Med. 2005;24:355–365. doi: 10.1016/j.csm.2004.12.003. xi. [DOI] [PubMed] [Google Scholar]
- 10.Driver HS, Taylor SR. Exercise and sleep. Sleep Med Rev. 2000;4:387–402. doi: 10.1053/smrv.2000.0110. [DOI] [PubMed] [Google Scholar]
- 11.Li C, Borgfeldt C, Samsioe G, Lidfeldt J, Nerbrand C. Background factors influencing somatic and psychological symptoms in middle-age women with different hormonal status. A population-based study of Swedish women. Maturitas. 2005;52:306–318. doi: 10.1016/j.maturitas.2005.05.005. [DOI] [PubMed] [Google Scholar]
- 12.Kline CE, Sui X, Hall MH, et al. Dose-response effects of exercise training on the subjective sleep quality of postmenopausal women: exploratory analyses of a randomised controlled trial. BMJ Open. 2012;2 doi: 10.1136/bmjopen-2012-001044. [DOI] [PMC free article] [PubMed] [Google Scholar]
- 13.Elavsky S, McAuley E. Lack of perceived sleep improvement after 4-month structured exercise programs. Menopause. 2007;14:535–540. doi: 10.1097/01.gme.0000243568.70946.d4. [DOI] [PubMed] [Google Scholar]
- 14.Tworoger SS, Yasui Y, Vitiello MV, et al. Effects of a yearlong moderate-intensity exercise and a stretching intervention on sleep quality in postmenopausal women. Sleep. 2003;26:830–836. doi: 10.1093/sleep/26.7.830. [DOI] [PubMed] [Google Scholar]
- 15.Casas RS, Pettee Gabriel KK, Kriska AM, Kuller LH, Conroy MB. Association of leisure physical activity and sleep with cardiovascular risk factors in postmenopausal women. Menopause. 2011 doi: 10.1097/gme.0b013e318230f531. [DOI] [PMC free article] [PubMed] [Google Scholar]
- 16.Greendale GA, Bodin-Dunn L, Ingles S, Haile R, Barrett-Connor E. Leisure, home, and occupational physical activity and cardiovascular risk factors in postmenopausal women. The Postmenopausal Estrogens/Progestins Intervention (PEPI) Study. Arch Intern Med. 1996;156:418–424. [PubMed] [Google Scholar]
- 17.Weller I, Corey P. The impact of excluding non-leisure energy expenditure on the relation between physical activity and mortality in women. Epidemiology. 1998;9:632–635. [PubMed] [Google Scholar]
- 18.Besson H, Ekelund U, Brage S, et al. Relationship between subdomains of total physical activity and mortality. Med Sci Sports Exerc. 2008;40:1909–1915. doi: 10.1249/MSS.0b013e318180bcad. [DOI] [PubMed] [Google Scholar]
- 19.Autenrieth CS, Baumert J, Baumeister SE, et al. Association between domains of physical activity and all-cause, cardiovascular and cancer mortality. Eur J Epidemiol. 2011;26:91–99. doi: 10.1007/s10654-010-9517-6. [DOI] [PubMed] [Google Scholar]
- 20.Ainsworth BE, Richardson MT, Jacobs DR, Jr, Leon AS. Gender differences in physical activity. Women Sport Phy Act J. 1993;23:1–16. [Google Scholar]
- 21.Hallal PC, Victora CG, Wells JC, Lima RC. Physical inactivity: prevalence and associated variables in Brazilian adults. Med Sci Sports Exerc. 2003;35:1894–1900. doi: 10.1249/01.MSS.0000093615.33774.0E. [DOI] [PubMed] [Google Scholar]
- 22.Eyler AE, Wilcox S, Matson-Koffman D, et al. Correlates of physical activity among women from diverse racial/ethnic groups. J Womens Health Gend Based Med. 2002;11:239–253. doi: 10.1089/152460902753668448. [DOI] [PubMed] [Google Scholar]
- 23.Freedman RR, Krell W. Reduced thermoregulatory null zone in postmenopausal women with hot flashes. Am J Obstet Gynecol. 1999;181:66–70. doi: 10.1016/s0002-9378(99)70437-0. [DOI] [PubMed] [Google Scholar]
- 24.Freedman RR. Hot flashes: behavioral treatments, mechanisms, and relation to sleep. Am J Med. 2005;118(Suppl 12B):124–130. doi: 10.1016/j.amjmed.2005.09.046. [DOI] [PubMed] [Google Scholar]
- 25.Freedman RR. Physiology of hot flashes. Am J Hum Biol. 2001;13:453–464. doi: 10.1002/ajhb.1077. [DOI] [PubMed] [Google Scholar]
- 26.Baecke JA, Burema J, Frijters JE. A short questionnaire for the measurement of habitual physical activity in epidemiological studies. Am J Clin Nutr. 1982;36:936–942. doi: 10.1093/ajcn/36.5.936. [DOI] [PubMed] [Google Scholar]
- 27.Durrence HH, Lichstein KL. The sleep of African Americans: a comparative review. Behav Sleep Med. 2006;4:29–44. doi: 10.1207/s15402010bsm0401_3. [DOI] [PubMed] [Google Scholar]
- 28.Flegal KM, Carroll MD, Ogden CL, Johnson CL. Prevalence and trends in obesity among US adults, 1999–2000. JAMA. 2002;288:1723–1727. doi: 10.1001/jama.288.14.1723. [DOI] [PubMed] [Google Scholar]
- 29.Sternfeld B, Ainsworth BE, Quesenberry CP. Physical activity patterns in a diverse population of women. Prev Med. 1999;28:313–323. doi: 10.1006/pmed.1998.0470. [DOI] [PubMed] [Google Scholar]
- 30.Bassett DR, Jr, Wyatt HR, Thompson H, Peters JC, Hill JO. Pedometer-measured physical activity and health behaviors in U.S. adults. Med Sci Sports Exerc. 2010;42:1819–1825. doi: 10.1249/MSS.0b013e3181dc2e54. [DOI] [PMC free article] [PubMed] [Google Scholar]
- 31.Sowers M, Crawford S, Sternfeld B, et al. SWAN: a multicenter, multiethnic, community-based cohort study of women and the menopausal transition. In: Lobo RA, Kelsey J, Marcus R, Lobo AR, editors. Menopause: biology and pathology. New York: Academic Press; 2000. pp. 175–188. [Google Scholar]
- 32.Ainsworth BE, Sternfeld B, Richardson MT, Jackson K. Evaluation of the kaiser physical activity survey in women. Med Sci Sports Exerc. 2000;32:1327–1338. doi: 10.1097/00005768-200007000-00022. [DOI] [PubMed] [Google Scholar]
- 33.Radloff LS. The CES-D scale: a self-report depression scale for research in the general population. Appl Psychol Meas. 1977;1:385–401. [Google Scholar]
- 34.Dormire SL, Carpenter JS. An alternative to Unibase/glycol as an effective nonhydrating electrolyte medium for the measurement of electrodermal activity. Psychophysiology. 2002;39:423–426. doi: 10.1017.S0048577201393149. [DOI] [PubMed] [Google Scholar]
- 35.Freedman RR. Laboratory and ambulatory monitoring of menopausal hot flashes. Psychophysiology. 1989;26:573–579. doi: 10.1111/j.1469-8986.1989.tb00712.x. [DOI] [PubMed] [Google Scholar]
- 36.Mezick EJ, Matthews KA, Hall M, et al. Influence of race and socioeconomic status on sleep: Pittsburgh SleepSCORE project. Psychosom Med. 2008;70:410–416. doi: 10.1097/PSY.0b013e31816fdf21. [DOI] [PMC free article] [PubMed] [Google Scholar]
- 37.Unruh ML, Redline S, An MW, et al. Subjective and objective sleep quality and aging in the sleep heart health study. J Am Geriatr Soc. 2008;56:1218–1227. doi: 10.1111/j.1532-5415.2008.01755.x. [DOI] [PubMed] [Google Scholar]
- 38.Brunello N, Armitage R, Feinberg I, et al. Depression and sleep disorders: clinical relevance, economic burden and pharmacological treatment. Neuropsychobiology. 2000;42:107–119. doi: 10.1159/000026680. [DOI] [PubMed] [Google Scholar]
- 39.Braveman PA, Cubbin C, Egerter S, et al. Socioeconomic status in health research: one size does not fit all. Jama. 2005;294:2879–2888. doi: 10.1001/jama.294.22.2879. [DOI] [PubMed] [Google Scholar]
- 40.Berkman LF, Macintyre S. The measurement of social class in health studies: Old measures and new formulation. In: Kogevinas M, Pearce N, Susser M, Boffetta P, editors. Social inequalities and cancer. Lyon: International Agency for Research on Cancer; 1997. [Google Scholar]
- 41.Thurston RC, Santoro N, Matthews KA. Are vasomotor symptoms associated with sleep characteristics among symptomatic midlife women? Comparisons of self-report and objective measures. Menopause. 2012;19:742–748. doi: 10.1097/gme.0b013e3182422973. [DOI] [PMC free article] [PubMed] [Google Scholar]
- 42.Sternfeld B, Wang H, Quesenberry CP, Jr, et al. Physical activity and changes in weight and waist circumference in midlife women: findings from the Study of Women's Health Across the Nation. Am J Epidemiol. 2004;160:912–922. doi: 10.1093/aje/kwh299. [DOI] [PubMed] [Google Scholar]
- 43.Young T, Rabago D, Zgierska A, Austin D, Laurel F. Objective and subjective sleep quality in premenopausal, perimenopausal, and postmenopausal women in the Wisconsin Sleep Cohort Study. Sleep. 2003;26:667–672. doi: 10.1093/sleep/26.6.667. [DOI] [PubMed] [Google Scholar]
- 44.Youngstedt SD, Perlis ML, O'Brien PM, et al. No association of sleep with total daily physical activity in normal sleepers. Physiol Behav. 2003;78:395–401. doi: 10.1016/s0031-9384(03)00004-0. [DOI] [PubMed] [Google Scholar]
- 45.Dworak M, Wiater A, Alfer D, Stephan E, Hollmann W, Struder HK. Increased slow wave sleep and reduced stage 2 sleep in children depending on exercise intensity. Sleep Med. 2008;9:266–272. doi: 10.1016/j.sleep.2007.04.017. [DOI] [PubMed] [Google Scholar]
- 46.Marshall SJ, Jones DA, Ainsworth BE, Reis JP, Levy SS, Macera CA. Race/ethnicity, social class, and leisure-time physical inactivity. Med Sci Sports Exerc. 2007;39:44–51. doi: 10.1249/01.mss.0000239401.16381.37. [DOI] [PubMed] [Google Scholar]
- 47.Schmidt MD, Freedson PS, Chasan-Taber L. Estimating physical activity using the CSA accelerometer and a physical activity log. Med Sci Sports Exerc. 2003;35:1605–1311. doi: 10.1249/01.MSS.0000084421.97661.17. [DOI] [PubMed] [Google Scholar]