Abstract
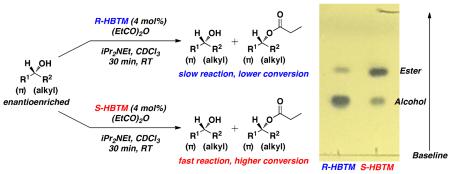
A new implementation of the Competing Enantioselective Conversion (CEC) method was developed to qualitatively determine the absolute configuration of enantioenriched secondary alcohols using thin-layer chromatography. The entire process for the method requires approximately 60 min and utilizes micromole quantities of the secondary alcohol being tested. A number of synthetically relevant secondary alcohols are presented. Additionally, 1H NMR spectroscopy was conducted on all samples to provide evidence of reaction conversion that supports the qualitative method presented herein.
The determination of absolute configuration of enantioenriched chiral centers is an important step in the process of characterizing isolated natural products and novel synthetic compounds.1–3 There are a number of methods used to determine absolute configuration including the advanced Mosher method,4–6 chiral derivatization reagents,7 vibration circular dichroism,8 exciton chirality,9–11 NMR spectroscopic chiral shift reagents,12–15 lipase-catalyzed resolutions,16 and x-ray crystallographic analysis.17
We recently reported the Competing Enantioselective Conversion (CEC) method for determining absolute configuration which utilizes each enantiomer of a kinetic resolution reagent (catalytic or stoichiometric) in parallel reactions where the determination is guided by a difference in the rate between the parallel reactions.18–20 A mnemonic then confirms the absolute configuration based on the fast reacting enantiomer of the kinetic resolution reagent. The method is a modern implementation of the Horeau method.21–25 Our method has been reported for secondary alcohols as well as oxazolidinones, lactams, and thiolactams where the parallel reactions were analyzed by 1H NMR spectroscopy to determine reaction conversion at a specified time. A similar strategy was developed for primary amines where the parallel reactions of proto and deutero chiral acylating reagents were analyzed by mass spectrometry.20
To showcase the versatility of this general method, we decided to investigate the use of thin-layer chromatography (TLC) as an additional characterization technique that could be incorporated in assisting the analysis of the fast and slow parallel reactions to determine absolute configuration. Secondary alcohols are one of the most common functional groups incorporated in polyketide, terpene, and saccharide natural products and thus were chosen as test substrates. Our previous report for determining the absolute configuration of secondary alcohols used Birman's homobenzotetramisole (HBTM) kinetic resolution catalyst (Figure 1),26 which was also used in this study. The HBTM catalyst and subsequent analogs have been shown to be quite versatile, with kinetic resolutions reported for a variety of different substrates.27–38 The HBTM catalyst can be stored under air at room temperature in a desiccator without decomposition, and it was prepared in a two step procedure from commercially available starting materials.26,34 The mnemonic (Figure 2) previously reported for secondary alcohols in our group was used to determine absolute configuration.
Figure 1.
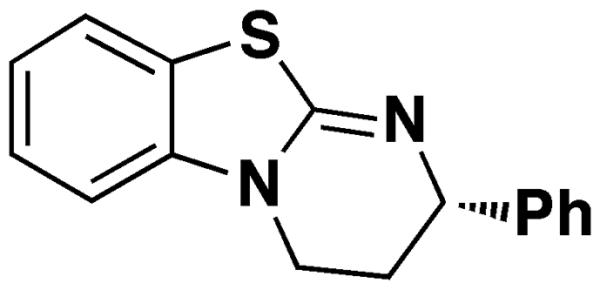
Birman's HBTM catalyst.26 The S enantiomer is shown.
Figure 2.
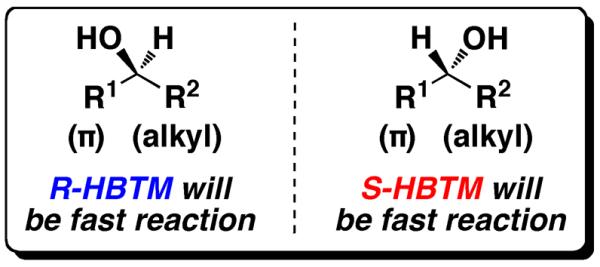
The predictive mnemonic used in determining the absolute configuration of secondary alcohols using each enantiomer of the HBTM catalyst.
In order to test the use of thin-layer chromatography as a characterization method, parallel reactions were set up for all of the secondary alcohols studied (Table 1). The checkmark denotes the reaction that was qualitatively determined to be the fast reaction with TLC analysis. The circled conversion number in the adjacent column denotes the fast reaction determined by a higher conversion using 1H NMR spectroscopy. The parallel reactions used micromole quantities of substrate and an average of 0.17 mg of HBTM catalyst per reaction. Deuterated chloroform was used as the solvent in order to allow a comparative quantitative analysis of reaction conversion via 1H NMR spectroscopy after the qualitative TLC analysis was completed. The reactions were quenched with 50 μL of methanol-d4 after 20 or 30 min, followed by the addition of CDCl3 to give a total additive volume of 500 μL. Then an aliquot of 2 μL from each reaction was removed and spotted on a TLC plate. The amount applied to each TLC spot ranged from 29 to 130 nanomoles of the combined alcohol and ester reaction mixture. The TLC plate was run, dried, and stained with an ethanolic solution of phosphomolybdic acid (PMA).39,40
Table 1.
Qualitative Determination of Absolute Configuration of Secondary Alcohol Substrates by TLC and Quantitative Confirmation of Reaction Conversion by 1H NMR Spectroscopy
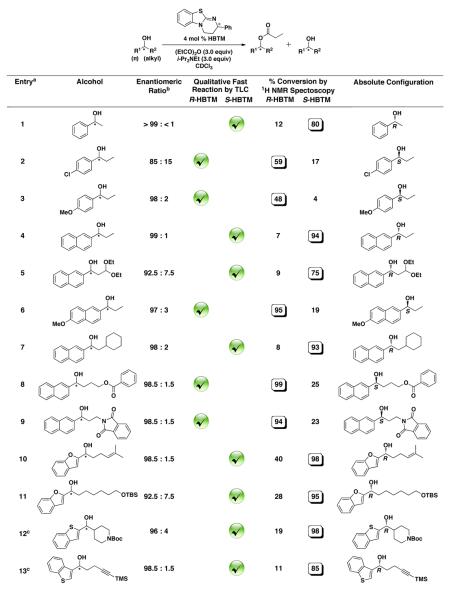
|
Reactions were quenched at 30 min unless otherwise noted
enantiomeric ratios measured by chiral SFC or chiral HPLC
reactions quenched after 20 min
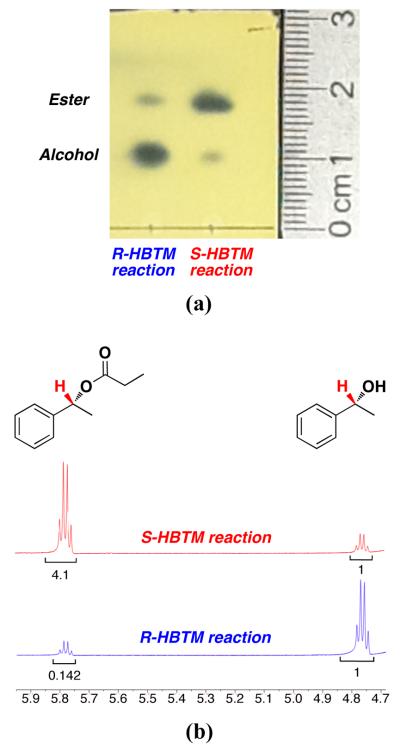
An example from entry 1 is provided (Figure 3a). Analysis of the PMA-stained TLC plate showed a noticeable difference between the fast and slow reactions. The fast reaction (S-HBTM) has a larger spot density of the higher Rf spot corresponding to the ester product formed from the reaction. The slow reaction (R-HBTM) has a larger spot density of the lower Rf spot corresponding to the alcohol starting material. This qualitative analysis correlates with the subsequent 1H NMR spectra (Figure 3b), which reveal the S-HBTM reaction has reached 80% conversion and the R-HBTM reaction has reached 12% conversion during the 30 min period. According to the mnemonic, the fast reaction with S-HBTM results in the alcohol behind the plane of the molecule as drawn (R1 = Ph, R2 = Me), resulting in an assignment of absolute configuration for entry 1 as the R enantiomer.
Figure 3.
(a) An image of the stained TLC plate from entry 1 of Table 1 after 30 min (b) 1H NMR spectra of each reaction after the TLC analysis
In entries 2 and 3, the fast reaction is determined for both electron-donating and electron-withdrawing benzyl alcohols. Note that in entry 2, with an enantiomeric ratio of 85:15, the qualitative analysis still determines the appropriate fast reaction. In entries 4 and 6, the fast reaction is determined with naphthyl and electron-donating naphthyl systems. The method is also compatible with a number of functional groups including acetals (entry 5), esters (entry 8), phthalimide (entry 8), alkenes (entry 10), silyl ethers (entry 11), protected amines (entry 12), and silyl-protected alkynes (entry 13). Entries 10–13 additionally feature heterocyclic benzofuran and benzothiophene derivatives. The entries in this table provide a complementary set of secondary alcohols to those previously reported, and further expand the substrate scope. The limits of this method depend upon the selectivity of the catalyst with each substrate and the optical purity of the sample. In any case where the fast-reacting substrate is not clearly identified by TLC analysis, the conversions should be evaluated by NMR analysis.
We investigated the feasibility of determining the absolute configuration of secondary alcohols using competitive kinetic resolution reaction coupled with a qualitative TLC analysis. The method was found to be successful for a variety of alcohols as presented in Table 1. The assay is simple to run, can be completed in 30 to 60 min, and requires no sophisticated equipment. The TLC analysis shows nanomolar sensitivity, and the method provides practical a micromolar-scale determination of absolute configuration for secondary alcohols.
Experimental Section
General Experimental
All reactions were carried out capped under air with CDCl3 as the reaction solvent. CDCl3 was treated with Na2SO4 prior to use. Propionic anhydride was distilled over P2O5 prior to use. N,N-diisopropylethylamine was distilled over CaH2 prior to use. Entries 1–3 were synthesized according to literature procedures.41–43 Entries 6 was synthesized by the Jarvo group.44 Entries 4–5 and 7–13 were synthesized by the Jarvo group.45 Chiral analytical traces of entries 1–3, and 6–7 are included in the supporting information. Chiral analytical traces of entries 4–5 and 8–13, as well as relevant characterization data, are included in the cited publication.45 All microliter quantities used in the reactions were added using micropipettes. The temperature was measured via thermometer in a separate 1 dram vial filled with deionized water. The temperatures were recorded between 21.0 and 24.1°C over the course of all parallel reactions reported herein. Thin-layer chromatography was performed using TLC glass plates (Silica gel 60 F254). All TLC plates were eluted with 30 % ethyl acetate in hexanes and were stained with phosphomolybdic acid (PMA) TLC stain, 20 wt. % in ethanol. Images of the TLC plates were recorded with an iPad 2 from approximately 12 inches above the surface of the place. The zoom feature on the iPad 2 camera was used to acquire the close-up pictures that are included. 1H NMR spectra were obtained using standard acquisition parameters and were referenced to chloroform (∂ = 7.26).
Preparation of Reagent Stock Solutions
All stock solutions were prepared fresh on the day that they were used in the reactions.
R-HBTM (10.4 mg, 0.0390 mmol) was added to a 1 mL volumetric flask. CDCl3 was added to give a total volume of 1.00 mL. The solution was transferred to a 1 dram vial. 500.0 μL was removed via micropipette and transferred to a 2 mL volumetric flask. CDCl3 was added to give a total volume of 2.00 mL and a resultant solution molarity of 0.00975 M. The solution was transferred to a 1 dram vial and capped under air.
S-HBTM (10.4 mg, 0.0390 mmol) was added to a 1 mL volumetric flask. CDCl3 was added to give a total volume of 1.00 mL. The solution was transferred to a 1 dram vial. 500.0 μL was removed via micropipette and transferred to a 2 mL volumetric flask. CDCl3 was added to give a total volume of 2.00 mL and a resultant solution molarity of 0.00975 M. The solution was transferred to a 1 dram vial and capped under air.
Propionic anhydride (369.3 μL, 2.880 mmol) was added to a 2 mL volumetric flask. CDCl3 was added to give a total volume of 2.00 mL and a resultant solution molarity of 1.44 M. The solution was transferred to a 1 dram vial and capped under air.
N,N-Diisopropylethylamine (463.3 μL, 2.660 mmol) was added to a 2 mL volumetric flask. CDCl3 was added to give a total volume of 2.00 mL and a resultant solution molarity of 1.33 M. The solution was transferred to a 1 dram vial and capped under air.
Procedure for Determining Absolute Configuration
(1) Parallel Reactions
This procedure will be illustrated with a specific example of Entry 9 from Table 1. Separate reactions were run with both the R-HBTM and S-HBTM stock solutions respectively, but the procedure for both reactions is otherwise identical. The R-HBTM reaction is shown below with Entry 9. All reactions were run in CDCl3 in order to also record 1H NMR spectra of the crude mixtures, however if only the TLC analysis is intended, the reactions can also be carried out in toluene. Conditions for all entries can be found in the supporting information.
Entry 9. 2-(3-hydroxy-3-(naphthalen-2-yl)propyl)isoindoline-1,3-dione (5.6 mg, 17 μmol) was tared in a ½ dram vial. CDCl3 (150.0 μL) was added to the vial.
R-HBTM reaction
65.0 μL of the alcohol solution (7.4 μmol) was transferred to a labeled 500 μL amber tapered-bottom vial, which was placed in a 1 dram vial. The stock solution of R-HBTM (30.2 μL, 0.294 μmol) was added. The stock solution of N,N-diisopropylethylamine (16.8 μL, 22.3 μmol) was then added. At t = 0, the stock solution of propionic anhydride was added (15.4 μL, 22.2 μmol). After 30 min, methanol-d4 (50 μL) was added to stop the reaction progress. Then, CDCl3 (322.7 μL) was added to bring the total additive volume to 500 μL. An aliquot (2.0 μL) was removed from the reaction and spotted on the baseline of a TLC plate. The remainder of the solution was used for 1H NMR spectroscopy.
(2) TLC Plate and Analysis
After both aliquots from the R-HBTM and S-HBTM reaction were spotted for a given entry, the plate was run (30% ethyl acetate in hexanes). The solvent front was marked by pencil and the plate was allowed to dry (2–3 min). Then, the plate was treated with phosphomolybdic acid (PMA) stain. The plate was heated in an oven at 160°C for 1–1.5 min. The plate was then removed, allowed to cool to room temperature, and photographed. The fast reaction was qualitatively determined according to the spot densities for each reaction. A larger spot density between the two reactions for the ester spot (higher Rf) corresponds to the fast reaction. A larger spot density between the two reactions for the alcohol spot (lower Rf) corresponds to the slow reaction.
Supplementary Material
Acknowledgements
The authors wish to thank Prof. Elizabeth R. Jarvo, Hanna M. Wisniewska, Iva M. Yonova, and Steven Nguyen for generously providing alcohols used in this report. Support was provided by the National Science Foundation (CHE 1152449), as well as by the Department of Defense (DoD) through the National Defense Science & Engineering Graduate Fellowship (NDSEG) Program (A.J.W.) and the National Science Foundation Graduate Fellowship Program (A.J.W.).
Footnotes
Supporting Information 1H NMR Spectra of all parallel reactions, pictures of all TLC plates, and a table with specific conditions for all reactions carried out are included. This material is available free of charge via the Internet at http://pubs.acs.org.
The authors declare no competing financial interest.
References
- (1).Eliel EL, Wilen SH. Stereochemistry of Organic Compounds. Wiley-Interscience; Hoboken, NJ: 1994. pp. 101–147.pp. 991–1105. [Google Scholar]
- (2).Seco JM, Quiñoá E, Riguera R. Chem. Rev. 2004;104:17–118. doi: 10.1021/cr2003344. [DOI] [PubMed] [Google Scholar]
- (3).Wenzel TJ, Chisholm CD. Chirality. 2011;23:190–214. doi: 10.1002/chir.20889. [DOI] [PubMed] [Google Scholar]
- (4).Dale JA, Dull DL, Mosher HS. J. Org. Chem. 1969;34:2543–2549. [Google Scholar]
- (5).Ohtani I, Kusumi T, Kashman Y, Kakisawa H. J. Am. Chem. Soc. 1991;113:4092–4096. [Google Scholar]
- (6).Hoye TR, Jeffrey CS, Shao F. Nat. Protoc. 2007;2:2451–2458. doi: 10.1038/nprot.2007.354. [DOI] [PubMed] [Google Scholar]
- (7).Louzao I, Seco JM, Quiñoá E, Riguera R. Chem. Commun. 2010;46:7903–7905. doi: 10.1039/c0cc02774j. [DOI] [PubMed] [Google Scholar]
- (8).Freedman TB, Cao X, Dukor RK, Nafie LA. Chirality. 2003;15:743–758. doi: 10.1002/chir.10287. [DOI] [PubMed] [Google Scholar]
- (9).Harada N, Nakanishi K, Berova N. In: Comprehensive Chiroptical Spectroscopy, Volume 2: Applications in Stereochemical Analysis of Synthetic Compounds, Natural Products, and Biomolecules. 1st ed Berova N, Polavarapu PL, Nakanishi K, Woody RW, editors. John Wiley & Sons, Inc.; Hoboken, NJ: 2012. pp. 115–166. [Google Scholar]
- (10).Li X, Tanasova M, Vasileiou C, Borhan B. J. Am. Chem. Soc. 2008;130:1885–1893. doi: 10.1021/ja0752639. [DOI] [PubMed] [Google Scholar]
- (11).Li X, Borhan B. J. Am. Chem. Soc. 2008;130:16126–16127. doi: 10.1021/ja805058t. [DOI] [PubMed] [Google Scholar]
- (12).Kobayashi Y, Hayashi N, Kishi Y. Org. Lett. 2002;4:411–414. doi: 10.1021/ol0171160. [DOI] [PubMed] [Google Scholar]
- (13).Kobayashi Y, Hayashi N, Kishi Y. Tetrahedron Lett. 2003;44:7489–7491. [Google Scholar]
- (14).Ghosh I, Zeng H, Kishi Y. Org. Lett. 2004;6:4715–4718. doi: 10.1021/ol048061f. [DOI] [PubMed] [Google Scholar]
- (15).Ghosh I, Kishi Y, Tomoda H, Omura S. 2004;6:4719–4722. doi: 10.1021/ol048060n. [DOI] [PubMed] [Google Scholar]
- (16).Jing Q, Kazlauskas RJ. Chirality. 2008;20:724–735. doi: 10.1002/chir.20543. [DOI] [PubMed] [Google Scholar]
- (17).Flack HD, Bernardinelli G. Chirality. 2008;20:681–690. doi: 10.1002/chir.20473. [DOI] [PubMed] [Google Scholar]
- (18).Wagner AJ, David JG, Rychnovsky SD. Org. Lett. 2011;13:4470–4473. doi: 10.1021/ol201902y. [DOI] [PMC free article] [PubMed] [Google Scholar]
- (19).Perry MA, Trinidad JV, Rychnovsky SD. Org. Lett. 2013;15:472–475. doi: 10.1021/ol303239t. [DOI] [PubMed] [Google Scholar]
- (20).Miller SM, Samame RA, Rychnovsky SD. J. Am. Chem. Soc. 2012;134:20318–20321. doi: 10.1021/ja310620c. [DOI] [PubMed] [Google Scholar]
- (21).Horeau A. In: Stereochemistry, Fundamentals and Methods. Fiaud J, Horeau A, Kagan HB, editors. Vol. 3. Georg Thieme; Stuttgart: 1977. pp. 51–94. [Google Scholar]
- (22).Horeau A. Tetrahedron Lett. 1961;2:506–512. [Google Scholar]
- (23).Schoofs A, Horeau A. Tetrahedron Lett. 1977;18:3259–3262. [Google Scholar]
- (24).Horeau A, Nouaille A. Tetrahedron Lett. 1990;31:2707–2710. [Google Scholar]
- (25).Koenig WA, Gehrcke B, Weseloh G. Chirality. 1994;6:141–147. [Google Scholar]
- (26).Birman VB, Li X. Org. Lett. 2008;10:1115–1118. doi: 10.1021/ol703119n. [DOI] [PubMed] [Google Scholar]
- (27).Zhang Y, Birman VB. Adv. Synth. Catal. 2009;351:2525–2529. doi: 10.1002/adsc.200900383. [DOI] [PMC free article] [PubMed] [Google Scholar]
- (28).Yang X, Birman VB. Adv. Synth. Catal. 2009;351:2301–2304. doi: 10.1002/adsc.200900451. [DOI] [PMC free article] [PubMed] [Google Scholar]
- (29).Yang X, Birman VB. Chem.-Eur. J. 2011;17:11296–11304. doi: 10.1002/chem.201101028. [DOI] [PubMed] [Google Scholar]
- (30).Li X, Jiang H, Uffman EW, Guo L, Zhang Y, Yang X, Birman VB. J. Org. Chem. 2012;77:1722–1737. doi: 10.1021/jo202220x. [DOI] [PMC free article] [PubMed] [Google Scholar]
- (31).Kobayashi M, Okamoto S. Tetrahedron Lett. 2006;47:4347–4350. [Google Scholar]
- (32).Joannesse C, Simal C, Concellon C, Thomson JE, Campbell CD, Slawin AMZ, Smith AD. Org. Biomol. Chem. 2008;6:2900–2907. doi: 10.1039/b805850d. [DOI] [PubMed] [Google Scholar]
- (33).Leverett CA, Purohit VC, Romo D. Angew. Chem., Int. Ed. 2010;49:9479–9483. doi: 10.1002/anie.201004671. [DOI] [PubMed] [Google Scholar]
- (34).Joannesse C, Johnston CP, Concellon C, Simal C, Philp D, Smith AD. Angew. Chem., Int. Ed. 2009;48:8914–8918. doi: 10.1002/anie.200904333. [DOI] [PubMed] [Google Scholar]
- (35).Belmessieri D, Joannesse C, Woods PA, MacGregor C, Jones C, Campbell CD, Johnston CP, Duguet N, Concellon C, Bragg RA, Smith AD. Org. Biomol. Chem. 2011;9:559–570. doi: 10.1039/c0ob00515k. [DOI] [PubMed] [Google Scholar]
- (36).Belmessieri D, Morrill LC, Simal C, Slawin AMZ, Smith AD. J. Am. Chem. Soc. 2011;133:2714–2720. doi: 10.1021/ja109975c. [DOI] [PubMed] [Google Scholar]
- (37).Morrill LC, Slawin AMZ, Smith AD. Chem. Sci. 2012;3:2088–2093. [Google Scholar]
- (38).Taylor JE, Bull SD, Williams JMJ. Chem. Soc. Rev. 2012;41:2109–2121. doi: 10.1039/c2cs15288f. [DOI] [PubMed] [Google Scholar]
- (39).PMA Stain: The PMA stain was chosen from a number of tested TLC stains because it displayed comparable sensitivity for secondary alcohols and their corresponding propionate esters with a set of calibrated equimolar serial dilutions.
- (40).Images of the TLC plates are included in the Supporting Information for the entries in Table 1. The Rf of the starting alcohols was tested in 30% ethyl acetate in hexanes prior to running the reactions.
- (41).Ohtani T, Nakatsukasa H, Kamezawa M, Tachibana H, Naoshima Y. J. Mol. Catal. B: Enzym. 1998;4:53–60. [Google Scholar]
- (42).Kitamura M, Suga S, Kawai K, Noyori R. J. Am. Chem. Soc. 1986;108:6071–6072. doi: 10.1021/ja00279a083. [DOI] [PubMed] [Google Scholar]
- (43).Kitamura M, Oka H, Suga S, Noyori R. Org. Synth. 2002;79:139–145. [Google Scholar]
- (44).Taylor BLH, Swift EC, Waetzig JD, Jarvo ER. J. Am. Chem. Soc. 2011;133:389–391. doi: 10.1021/ja108547u. [DOI] [PubMed] [Google Scholar]
- (45).Wisniewska HM, Swift EC, Jarvo ER. Manuscript in preparation [Google Scholar]
Associated Data
This section collects any data citations, data availability statements, or supplementary materials included in this article.


