

Abstract
Planar polarization of the forming hair bundle, the mechanosensory antenna of auditory hair cells, depends on the poorly characterized center-to-edge displacement of a primary cilium, the kinocilium, at their apical surface. Taking advantage of the gradient of hair cell differentiation along the cochlea, we reconstituted a map of the kinocilia displacements in the mouse embryonic cochlea. We then developed a cochlear organotypic culture and video-microscopy approach to monitor the movements of the kinocilium basal body (mother centriole) and its daughter centriole, which we analyzed using particle tracking and modeling. We found that both hair cell centrioles undergo confined Brownian movements around their equilibrium positions, under the apparent constraint of a radial restoring force of ∼0.1 pN. This magnitude depended little on centriole position, suggesting nonlinear interactions with constraining, presumably cytoskeletal elements. The only dynamic change observed during the period of kinocilium migration was a doubling of the centrioles’ confinement area taking place early in the process. It emerges from these static and dynamic observations that kinocilia migrate gradually in parallel with the organization of hair cells into rows during cochlear neuroepithelium extension. Analysis of the confined motion of hair cell centrioles under normal and pathological conditions should help determine which structures contribute to the restoring force exerting on them.
Introduction
Hair cells of the cochlea, the mammalian auditory organ, are sensory cells dedicated to the detection of nanometric sound-evoked vibrations. They achieve this detection with their hair bundle, a unique mechanosensitive structure formed of large and stiff microvilli, known as stereocilia, that project from their apical surface. During development, the hair bundle emerges from a subset of microvilli that grow to form interconnected rows of stereocilia organized in a polarized V-,W,- or U-shaped staircase pattern (1). This process occurs during the differentiation of the snail-shaped cochlea, which proceeds from its base to its apex. In the mouse, the first hair bundles form near the cochlear base around embryonic day 14 (E14), and the last ones at the cochlear apex around E18 (2,3). Between these two stages, the cochlear neuroepithelium elongates by a cell patterning mechanism consistent with convergent extension (4–8), in which sensory cells get organized in one row of inner hair cells (IHCs) and three rows of outer hair cells (OHCs) intercalated between supporting cells in a regular mosaic. This developmental process results in the precise alignment of hair cells and their hair bundles along the cochlear longitudinal axis. Proper orientation of the hair bundles is essential for their synchronous radial deflection induced later by sound (9).
Prior studies have established that hair bundle shaping and polarization depend on oriented displacements of the kinocilium, a specialized primary cilium located at the hair cell apical surface. The kinocilium is composed of an axonemal shaft nucleated from a basal body, the mother centriole, located beneath the cell surface (10–12). A daughter centriole is connected to the basal body by intercentriolar linkers (13). Electron microscopy data in the chick and small rodents have shown that the first step of hair bundle formation involves a translation of the kinocilium from the center to the periphery of the apical cell surface, toward its final position at the hair bundle vertex (14,15). By E17 in the mouse cochlea, most hair cell kinocilia have migrated to positions <1 μm from the circumference of the apical cell surface. The hair bundle orientation at that time is distributed within an angular sector spanning ±15–30° relative to the planar polarity axis of the epithelium, which coincides with the bilateral symmetry axis of the mature hair bundle (8). From this stage on, the kinocilium is attached to the vertex of the forming hair bundle by fibrous links that connect it to the tallest row of stereocilia (2,3,16–18). The kinocilium position is then refined during the early postnatal stage to precisely match the planar polarity axis, the mother and daughter centrioles being finally aligned along this axis (19,20).
Analysis of mouse mutants defective for ciliary proteins has established that the kinocilium, which disappears in cochlear hair cells before the full maturation of the hair bundle, is required for the normal shaping and orientation of this organelle (19–21). However, little is known regarding the kinetics of kinocilium migration, and a fortiori, about the forces involved in this process. Clarifying these issues calls for a detailed characterization of kinocilium displacements, and if possible their direct monitoring in living cochleas. With these goals in mind, we first carried out a quantitative static immunoanalysis of hair cell centriole positions. We took advantage of the basal-to-apical progression of cochlear differentiation to obtain a spatial readout of the basal body displacements over the entire kinocilium migration period in individual cochleas. To get some insight into the dynamic behavior of the kinocilium, we developed an ex vivo approach to monitor the movements of the hair cell kinocilium basal body and its daughter centriole in mouse cochlear organotypic cultures. This allowed us to characterize the centriole movements in embryonic hair cells by time-lapse microscopy with submicron accuracy over up to ∼3 h, and at nanometer-scale resolution over short periods of time (∼10 min) using particle tracking methods.
Methods
Generation of double-labeled mutant mice
All animal procedures were performed in accordance with Inserm and Pasteur Institute animal welfare guidelines. Two strains of transgenic mice were used in this study. The Centrin-1/GFP strain (22) expresses an in situ marker of centrioles (GFP fused to the centrosomal protein centrin-1 (23)). The Math1/mCherry strain expresses the monomeric red fluorescence protein mCherry under the control of the mouse atonal 1 (Math1) promoter, which leads to specific cytoplasmic labeling of hair cells (24) from E14 onward. We generated this recombinant mouse strain by using Math1/nGFP plasmids (25,26) kindly provided by Dr. Jane E. Johnson (Dept. of Neuroscience, University of Texas Southwestern Medical Center, Dallas, TX). To obtain double-labeled mouse embryos, heterozygous Centrin-1/GFP males were crossed with heterozygous Math1/mCherry females. Cochleas of the double-labeled embryos were dissected out and placed in culture. In Centrin-1/GFP-Math1/mCherry mice, the first hair cells (mCherry-positive cells) could be distinguished as early as E14.5, when they begin to differentiate and kinocilium migration has not yet started. The cytoplasmic mCherry label in hair cells did not permit a precise localization of centrioles within the apical circumferences of these cells. The position of the kinocilium at the hair cell surface could, however, be inferred from immunostaining data to be central in IHCs from cochleas harvested around E14 (migration not yet started), and peripheral in nearly all IHCs at E17.5 or later (migration completed).
Preparation and immunolabeling of whole-mount cochleas
Mouse inner ears at various embryonic stages were rapidly dissected, prepared, and immunostained as previously described (17). The following primary antibodies were used: custom-made rabbit polyclonal anti-myosin VIIa (1:1000) (16), mouse monoclonal anti-ZO1 (1:100, Invitrogen, Carlsbad, NM), mouse monoclonal anti-β-catenin (1:200, BD Biosciences, Le Pon de Claix, France), and rabbit polyclonal anti-γ-tubulin (1:1000, Sigma-Aldrich, St. Louis, MO). Secondary antibodies were obtained from Invitrogen and GE Healthcare (Piscataway, NJ). Tetramethyl rhodamine isothiocyanate (TRITC)-conjugated phalloidin (1:1000; Sigma-Aldrich) was used to stain actin filaments. Fluorescence images were acquired with a Zeiss LSM510 META confocal microscope (Carl Zeiss, Jena, Germany) equipped with a Plan Apochromat 63 × NA 1.4 oil immersion objective.
Cochlear cell contour extraction
Apical circumferences of hair cells and supporting cells were detected in confocal images of immunostained cochleas by subjecting the images to a prefiltering step to remove noise and background (27), and by then applying the watershed segmentation algorithm as implemented in the MATLAB image processing toolbox (The MathWorks, Natick, MA). A custom MATLAB interface was used to select cells of different types manually, and to subsequently extract their contours, either by applying the watershed algorithm to the whole image or on a cell-by-cell basis. This allowed flexible and robust detection of the contours of each selected cell.
In vitro preparation and time-lapse imaging of cochlear centrosomes
To track the movements of centrioles in live hair cells, we developed a custom glass culture podium allowing a cochlear explant to be positioned upside down in a glass bottom culture dish (MatTek, Ashland, MA) on the stage of an inverted microscope (see Fig. S2 A in the Supporting Material). This feature was essential to avoid the severe loss of contrast due to scattering of light in the thickness of the epithelium, which occurs when imaging the surface of an upright cochlea from below. Cochleas were dissected in cold modified Hank’s balanced salt solution with calcium and magnesium (HBSS, calcium, magnesium, no phenol red, from Gibco, Life Technologies, Carlsbad, CA), buffered with HEPES to a pH of 7.2, with 0.6% glucose added. Once isolated, the explant was allowed to adhere to the custom glass podium coated with a layer of Matrigel (BD biosciences), and placed in culture at 37°C, with 5% CO2 in Dulbecco’s modified Eagle medium (25 mM glucose, 25 mM HEPES, no pyruvate; Gibco) and 10% fetal bovine serum.
The organotypic preparation was examined at 37°C with a Leica DM IRE2 microscope (Leica Microsystems, Wetzlar, Germany) equipped with a Cube & Box temperature control system (Life Imaging Service, Basel, Switzerland) and a CoolSnap HQ2 CCD camera (Roper Scientific, Ottobrunn, Germany) controlled by Metamorph (Molecular Devices, Sunnyvale, CA). Images were acquired using a 63 × NA 1.4 oil immersion objective at wavelengths around 480 and 565 nm for excitation of GFP and mCherry, respectively. At the beginning of each experiment, the explant was placed on the microscope stage and the focus plane was set to the surface of the sensory epithelium. A time-lapse series was then acquired either for 10—15 min (short time series), by keeping the focus level fixed and taking one image every 2 s, or for 3–4 h (long time series), by acquiring a z-stack (15 images separated by 1 μm) across the surface of the epithelium every 15, 20, or 30 min. Fixed exposure times per frame of 700 and 50–200 ms were used for the GFP channel and the mCherry channel, respectively. Under these conditions, minimal photobleaching occurred in the preparation, and no degradation of the tissue was observed during the experiments.
Significant postdissection movements of the cochlear tissue occurred immediately after isolation of the organ. These movements stopped after several hours of culture, suggesting slow release of tissue tensions following the positioning of the cochlear explant and its adhesion on the surface of the culture support. Therefore, all imaging experiments were performed after the preparation had been left to relax for 5–12 h in vitro. After this relaxation period, a very slow movement of the tissue was observed. This tissue drift, which became smaller in cochleas examined at or after E17.5, could be attributed to the ongoing developmental extension of the cochlear epithelium (see Results). On the timescale of the short experiments, it appeared nearly uniform across the imaged region, and could be easily subtracted from the tracking data to obtain the centriole movements relative to the hair cells, as described below.
Centriole motion tracking and analysis
A custom particle tracking procedure was developed in MATLAB (The MathWorks) to follow the movement of centriole pairs in short time-lapse sequences. This procedure comprises three steps (see the Supporting Material, section S1 for details): i), prefiltering step to improve the images’ signal/noise ratio and contrast, as described (27); ii), selection step, to define a set of centriole pairs to be tracked in the image sequence; iii), tracking step, in which the trajectories of selected centriole pairs are tracked by a least-squares Gaussian fitting procedure. This algorithm allowed us to track the position of a diffraction-limited spot of a signal/noise ratio similar to that of the experimental centriole images, at a resolution of 15% of the pixel size or better, as was estimated from experiments performed on phantom images. This corresponded to an experimental localization of hair cell centriole pairs with a precision of ∼10 nm (for a pixel size of 79 nm).
Due to optical limits of the microscope, it was possible to distinguish both the mother and daughter centrioles in only 30–40% of the hair cells, and in ∼50% of the supporting cells. The centriole pairs in the other hair cells and supporting cells appeared as single oblong diffraction-limited spots. This could have happened because the two centrioles were too close to be resolved, or due to out-of-plane orientation of the pair, reported in cochlear hair cells (19). We therefore performed two complementary types of tracking: one in which a single Gaussian spot was fitted to each centriole pair at each time point (one-center tracking); and the other one in which the image of the two individual centrioles was fitted by a bimodal Gaussian mixture (two-center tracking), allowing their respective positions to be obtained.
To estimate the oriented tissue drift associated with cochlear epithelium extension, a standard correlation procedure was applied to the images of the Math1/mCherry-stained hair cells. In brief, the correlation image of each frame with the first frame in the series was computed. The shift in the maximum of this correlation from frame to frame was obtained, giving an estimate of the drift as a function of time, which was smoothed by a Gaussian filter (standard deviation, two time steps) to reduce noise artifacts. Corrected centriole trajectories could then be obtained by subtraction of the resulting drift estimate xdrift(t) from all trajectories tracked in the given series.
A number of quantitative measurements were extracted from each of the reconstructed centriole trajectories, including their mean-squared displacement (MSD) as a function of time, and the effective confinement forces acting on the centrioles. The MSD after n steps of a trajectory sampled at N positions xn = x(nδt), n = 0,…, N–1, was estimated from its empirical average for an n-step interval:
| (1) |
Confinement forces were estimated based on a best fit of Boltzmann’s distribution to the distribution of distances from the hair cell centriole trajectories to their equilibrium positions. The rationale of this estimation is explained in the text. Details on the procedure used and on the other trajectory quantities analyzed are given in the Supporting Material, section S2. All the statistical comparisons described below (including those involved in the static analysis part) were performed using Welch’s t-test.
Results and Discussion
Gradual pattern of kinocilium migration in the mouse cochlea
We studied the pattern of hair cell kinocilium migration in relation to the intercalation of hair cells between supporting cells and their alignment in rows in whole-mount immunostained mouse cochleas (Figs. 1 and 2). The IHCs start to differentiate around E14 near the cochlear base, whereas the OHCs differentiate later (4). IHCs could be identified from E14.5 by anti-myosin VIIa antibody staining. They formed a row that extended from the cochlear base to the limit of the myosin VIIa-positive region, and progressed according to the basoapical differentiation gradient of the cochlea (Fig. S1 A). At E15.5, this row extended to x ≈ 0.5, and at E17.5, to x ≈ 0.7, x denoting the longitudinal distance from the cochlear base divided by the total length of the cochlear duct (Fig. 1 A). The apical contours of IHCs and of their supporting cells could be clearly delineated by immunostaining of cell-cell junction proteins (β-catenin or ZO-1). Immunolabeling of the centrosomal protein γ-tubulin allowed the mother and daughter centrioles to be visualized (Fig. 1, B and C). We analyzed the changes in the positions of the centrioles within the IHC apical circumferences from series of confocal images acquired at various locations along the cochlear axis (Fig. 1 and Fig. S1 A). At E15.5, the centriole pairs were no longer central at the IHC apical surface in 89% of the myosin VIIa-immunoreactive IHCs (n = 933 cells in 8 cochleas), implying that their abneural migration had engaged. The fraction of abneurally positioned IHC centrioles declined from the cochlear base toward the apex, comprising 94% of the IHCs in the 0 ≤ x < 0.3 region (n = 622), 80% of those in the 0.3 ≤ x < 0.4 region (n = 220), and only 73% of those in the x > 0.4 region (n = 91). At E17.5, this fraction had increased at all cochlear locations, reaching 100% of IHCs in the x ≤ 0.5 region (n = 122) and 80% of those in the x > 0.5 region (n = 45).
Figure 1.
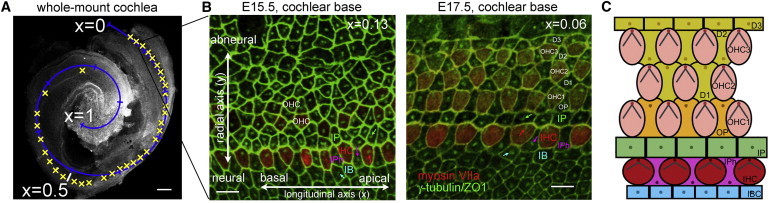
(A) Overview of an E15.5 whole-mount cochlea, showing the successive positions of a series of confocal images acquired along the cochlea (photobleach prints marked by yellow crosses). The normalized longitudinal cochlear x axis was reconstructed by fitting a spiral (in blue) onto the image. The x-coordinate is defined as the length of this spiral from the cochlear base (x = 0), divided by the cochlear length, which covers ∼1.5 turn at E15.5 and slightly more at E17.5. Scale bar: 100 μm. (B) Surface views of the organ of Corti at E15.5 and E17.5 in the basal cochlear region. The basal bodies of cochlear cells (arrows) and their apical boundaries are immunostained for the proteins γ-tubulin and ZO-1, respectively (in green). The cytoplasmic myosin VIIa-staining of IHCs, which form a distinct row at E15.5, is in red. Note the increased regularity of this row at E17.5, and the appearance of three OHC rows at this stage. Scale bars: 5 μm. (C) Schematic organization of the surface of the organ of Corti in the newborn mouse. One IHC row and three OHC rows are present at this stage. The kinocilia (dots) are located on the abneural side of the hair cells, and their V-shaped hair bundles have formed. Three types of supporting cells make contacts with IHCs: the inner pillar cells that separate the IHC and the OHC regions (IP, green), the inner phalangeal cells that intercalate with IHCs (IPh, magenta), and the inner border cells located on the neural IHC side. All supporting cells carry a primary cilium at their apical surface.
Figure 2.
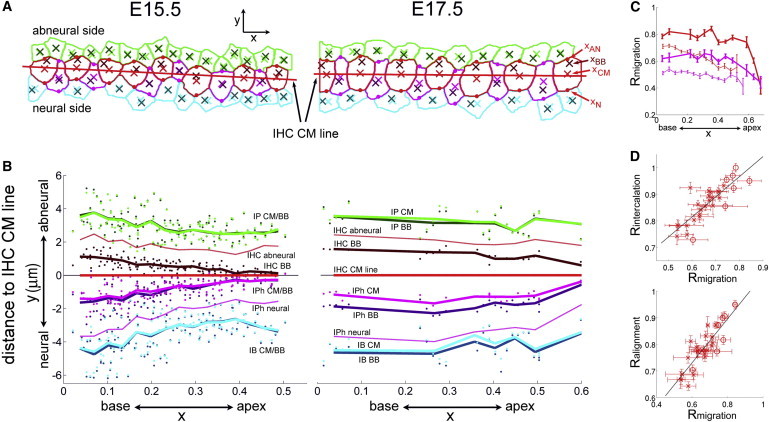
(A) Typical organization of the apical circumferences of IHCs and their contacting supporting cells at E15.5 and E17.5. CM positions (xCM) and basal body positions (xBB) of IHCs and their supporting cells are marked within each contour by crosses, darkened for the basal body. Dots mark the neural and abneural points on each IHC and IPh contour (xAN and xN, respectively, defined as the intersections of the contour with the radial line passing through xCM). (B) The signed distances from the CM and basal body positions to the IHC CM line (best-fit line through IHC CM points, in red), plotted as a function of x for the various cell types. Data pooled over eight E15.5 cochleas and one E17.5 cochlea. Dots and curves represent single-frame averages and coarse-grained averages over 15 equal segments of the cochlear axis, respectively. (C) Longitudinal running averages of the kinocilium migration ratio Rmigration. Thin dashed curves and thick continuous ones correspond to E15.5 and E17.5, respectively. Red, IHCs; magenta, IPh cells. Error bars show standard errors. (D) Plots of Rintercalation (upper panel) and Ralignment (lower panel) as functions of Rmigration. Mean values of the plotted ratios in 30 equal cochlear segments at E15.5 and in 15 equal segments at E17.5 were computed and matched according to cochlear location. Data at E15.5 and E17.5 are plotted with crosses and circles, respectively. Error bars show standard errors. Dashed lines show regression lines.
To refine these observations, we recorded in each IHC the position of the centriole pair, xBB (defined as the mean position of the mother and daughter centrioles), and the position of the center of mass (CM) of the IHC apical circumference, xCM, determined by contour segmentation (Fig. 2 A). We then analyzed the distance dIHC of xBB to the best-fit line through the IHC CM points, used as a reference cochlear longitudinal axis (dIHC being counted with a positive or negative sign for centrioles positioned on the abneural or neural side of the IHC CM line, respectively). The averages of this distance over each confocal frame analyzed in every cochlea are plotted as a function of x in Fig. 2 B. At E15.5, dIHC was positively biased within the entire myosin VIIa-stained region (dark red dots and darkened curve above the IHC CM line in Fig. 2 B). Strikingly, its mean value was fivefold larger in the 0 ≤ x < 0.1 region (dIHC = 1.08 ± 0.09 μm, mean ± standard error) than in the 0.4 ≤ x < 0.5 region (dIHC = 0.20 ± 0.05 μm, p < 10−8, Welch’s t-test). Between these two regions, dIHC varied gradually as a function of x (Fig. 2 B). At E17.5, the mean value of dIHC had increased in the whole x < 0.5 region. It was larger than at E15.5 by ∼45% in the 0 ≤ x < 0.1 region (reaching dIHC = 1.56 ± 0.01 μm, p < 10−4), and by fivefold in the 0.4 ≤ x < 0.5 region (dIHC = 1.02 ± 0.03 μm, p < 10−10). Thus, dIHC displayed much more uniform values along the cochlea (even though it still decreased significantly, p < 10−8) at E17.5 than at E15.5. These changes indicate a continued migration of the IHC centrioles between E15.5 and E17.5, all along the cochlea. We then analyzed the distribution of the radial coordinate of each IHC centriole pair relative to the corresponding IHC CM, yBB – yCM (Fig. S1 B). At E15.5, this distribution displayed a single mode at all cochlear locations, and shifted gradually from an abneural position at the cochlear base to a central one in the mid-cochlear region (Fig. S1 B). At E17.5 the distribution of yBB – yCM had about the same variance and a similar shape than at E15.5, but was further displaced toward the abneural side. This similarity and the limited scattering of these distributions all along the cochlea argue against a rapid central-to-peripheral migration of IHC centrioles.
To eliminate the possibility that the measured IHC centriole displacements could be due to the enlargement of the IHC apical surface during that period (Fig. S1 D), we analyzed the changes in the ratio Rmigration = 1 – |xBB – xAN| / |xAN – xN| (where xAN and xN denote the positions of the abneural and the neural points of the IHC apical cicumference, respectively, cf. Fig. 2 A). This ratio (varying between 0.5 and 1 for central and abneural positions of the IHC centrioles, respectively) is insensitive to a pure scaling of the apical cell surface (in which |xBB – xAN| and |xAN – xN| are both multiplied by the same factor), and is largely unaffected by shape changes of the IHC apical circumference between E15.5 and E17.5. At E15.5, Rmigration decreased from the value ∼0.8 at the cochlear base to ∼0.55 in the mid-cochlear region. At E17.5, Rmigration had increased to ∼0.8 at all cochlear locations within the x ≤ 0.5 region (Fig. 2 C). Thus, neither the gradual variation of dIHC along the cochlea at E15.5, nor its increased value at E17.5 could be explained by changes in the size or shape of the IHC apical surface.
On the basis of the previous mean values of dIHC, we could estimate the time course of IHC kinocilium migration. In the 0 ≤ x < 0.1 region, it starts around E14.5, and is near complete at E17.5. It progresses with a mean speed of ∼45 nm/h between E14.5 and E15.5 (assuming that dIHC ≈ 0 at E14.5), and slows down to a mean speed of ∼10 nm/h between E15.5 and E17.5. In the 0.4 ≤ x < 0.5 region, IHC kinocilium migration progresses with a delay of ∼1 day relative to the cochlear base, and with a mean speed of ∼17 nm/h between E15.5 and E17.5.
The centrioles of the primary cilia of supporting cells that intercalate between IHCs, the inner phalangeal cells (IPh, magenta contours and curves in Fig. 2, A and B), also exhibited significant displacements toward the cell periphery between E15.5 and E17.5 (p < 0.005), yet in the opposite direction to those of the hair cells’ kinocilia. These displacements are consistent with the reported migration of the primary cilia of IPh cells from a central to a peripheral position at the neural side of these cells (19,20,28). The distances from the position of the IPh centriole pair and from the IPh CM position to the IHC CM line were not significantly different at E15.5 (p > 0.5; Fig. 2 B and Fig. S1 C), indicating a centrally positioned cilium in IPh cells at that stage. At E17.5, the difference δIPh between these distances was significant at all cochlear locations, and it was more significant in the 0 ≤ x < 0.1 region (δIPh = 0.70 ± 0.06 μm; p = 0.0008) than in the 0.4 ≤ x < 0.5 region (δIPh = 0.44 ± 0.06 μm; p = 0.004). These data characterize the center-to-periphery migration of the primary cilia in IPh cells as progressing over a period of at least 2 days from the cochlear base to the cochlear apex, with a delay of ∼1 day relative to the migration of IHC kinocilia. Of note, no primary cilium migration occurred in supporting cells contacting IHCs but not intercalating between them (inner pillar and inner border cells, Fig. 2 A). The centrioles’ mean position xBB in these cells was not significantly different from that of the apical circumference’s CM at both E15.5 and E17.5 (p > 0.5; Fig. 2 B).
We also wanted to assess a possible relationship between the kinocilium migration in IHCs and the cell intercalation process leading to the formation of IHC rows. To this end, in all confocal frames (comprising 8–12 imaged IHCs each) we quantified the degree of intercalation between IHCs and IPh cells and the degree of alignment of IHCs by two ratios Rintercalation and Ralignment, which were compared to the kinocilium migration ratio Rmigration (Fig. 2 D). Rintercalation was defined as the number of IHCs or IPh cells whose closest neighbor on the side of the cochlear apex is a cell of the other type, divided by the total number of IHCs and IPh cells in the image frame (Rintercalation ≈ 1 for perfect intercalation, and Rintercalation ≈ 0.5 for a random succession of the two cell types). We defined Ralignment = 1 – S/D, where S is the standard deviation of the distances of the IHC CM points to their regression line, and D is the mean diameter of the IHC apical surface (Ralignment = 1 corresponds to perfect IHC alignment, and Ralignment < 0.5 to a rather poor one, in which some IHC apical contours might not be intersected by the IHC CM line). Strikingly, at both E15.5 and E17.5, the mean cell patterning ratios (Ralignment, Rintercalation) measured at various cochlear locations displayed strongly positive linear correlations with the corresponding mean kinocilium migration ratios (Rmigration) (correlation coefficients between Rmigration and Rintercalation of 0.82 and 0.87 at E15.5 and E17.5, respectively, and between Rmigration and Ralignment of 0.80 and 0.88 at E15.5 and E17.5, respectively, Fig. 2 D). This approximate proportionality between Rmigration, Rintercalation, and Ralignment establishes that kinocilium migration progresses throughout the cochlear epithelium extension period, and on average in synchrony at all cochlear locations with the process of intercalation and alignment of IHCs between IPh cells.
Upside down organotypic culture conditions recapitulate the development of the cochlear epithelium
We next developed an in vitro cochlear culture preparation suitable to analyze the movements of hair cell centrioles. We used video microscopy to track these movements in IHCs from recombinant mice harboring a GFP-fused centrosomal protein centrin-1 (22) and whose hair cells expressed a cytoplasmic mCherry protein in the cytoplasm (see Methods). An optical setup adapted to organotypic culture conditions was also developed, using a custom glass culture podium allowing cochlear explants to be positioned upside down on an inverted microscope (see Methods, and Fig. S2 A). This setup permitted the surface of the preparation to be imaged with resolution, contrast, and speed similar to those achieved in cultivated vertebrate cells (23). It allowed us to track the movements of hair cell centrioles on a timescale of a few seconds with a resolution of a few tens of nanometers.
To test the validity of this ex vivo cochlear preparation, we investigated the occurrence of cochlear epithelium elongation, the formation of hair cell rows, and the formation of polarized stereocilia bundles in these organotypic culture conditions. In cochleas isolated at E14.5 and immunostained for F-actin, the apical surfaces of the cochlear cells displayed a typical hexagonal pattern without morphologically differentiated hair cells (Fig. S2 B). After 5 days of culture, we observed a lengthening of the epithelium (data not shown) consistent with that reported in upright culture conditions at equivalent embryonic stages (4,5), and distinct rows of hair cells had developed (Fig. S2, C and D). In the basal and mid-cochlear regions, the organization of these rows, the kinocilium axonema position, and the hair bundle orientation and shape were similar to those observed in the cochlea at an equivalent stage, i.e., in newborn mice (Fig. S2, C and D). We performed all subsequent analysis in these cochlear regions (see below).
The mother and daughter centrioles undergo confined random movements on short timescales at the IHC apical surface
According to the previous static analysis, IHC kinocilium migration reaches the first third of its course around E15.5 at the cochlear position x = 0.3–0.35 (Fig. 2 B). It follows from the mean speed of basal body migration estimated at this location between E15.5 and E17.5 (∼17 nm/h), that detecting an oriented center-to-edge displacement of the IHC basal body by only 0.1 μm would require monitoring its position continuously for a minimum of 5 h. If the migration of IHC kinocilia actually progresses at such a small speed, one would expect IHC centrioles to appear nearly still over duration of a few hours. However, the possible occurrence of rapid erratic movements of IHC centrioles over distances comparable to the diameter of the IHC apical surface cannot be ruled out by the static analysis. To address this issue, we monitored the movements of IHC centrioles at the same cochlear position in long time-lapse series acquired in cochleas dissected at E14.5 and cultured in vitro for 1 day before imaging (stage equivalent to E15.5). Each experiment consisted in acquiring a z-stack through the surface of the epithelium every 15, 20, or 30 min for a period of up to 4 h (see Methods). The ongoing cochlear extension at this stage prevented us from maintaining the focus at the hair cell apices for longer periods. In 32 cochleas examined, we could monitor the same IHCs in focus for 100–200 min (6–11 time points) in 4 cochleas, for 60–80 min (4–5 time points) in 9 additional cochleas, and for 30–45 min (2–3 time points) in the remaining 19 cochleas. A total of 165 IHCs were analyzed in this way, representing ∼180 imaging hours. No translation of the centrioles relative to the apical cell surface could be detected in any of these cells. In the image series that we could acquire in focus for the longest time (i.e., 11 time points, Fig. 3 A), the mean positions of the mother and daughter centrioles did not change appreciably within the IHC apical surfaces over the duration of the experiment, any such change being much smaller than the overall translation of the epithelium due to its extension. The dynamic imaging of IHC centrioles thus confirmed the absence of a rapid center-to-edge transition of the kinocilium at the IHC apical surface, and it allowed us to rule out the possibility of erratic centriole movements covering distances larger than a few percent of the cell surface diameter. Over a period of a few hours, the movements of IHC centrioles appeared confined within each IHC.
Figure 3.
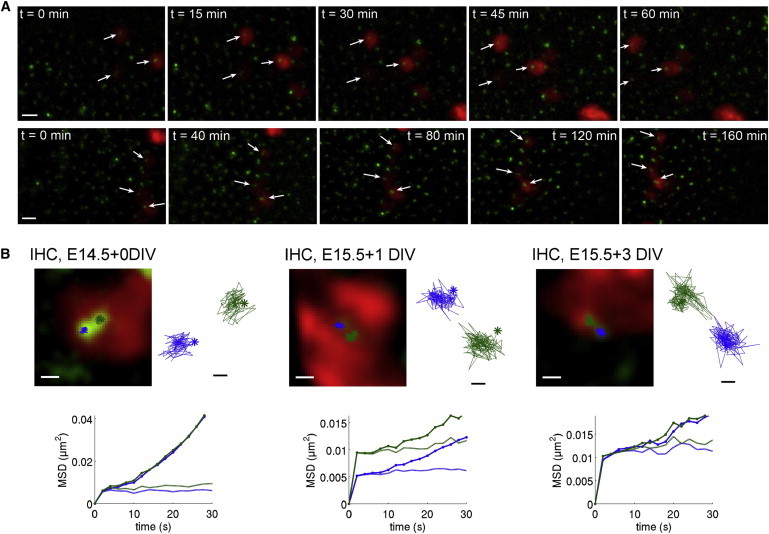
Confinement of hair cell centriole movements on long and short timescales. (A) Images of the preparation from two long time-lapse sequences (3–4 h, 15–20 min per frame) at E14.5 + 1 day in vitro. IHC centriole pairs (arrows) do not change in position or orientation relative to the IHC surfaces. Note the ongoing drift of the cochlear tissue, as seen by an overall translation of IHCs to the left with time in both series. Scale bars: 2 μm. (B) Examples of IHC centriole trajectories tracked from short image sequences (10–15 min, 2 s between frames) at different developmental stages. Images of the basal body and daughter centrioles are shown, together with their drift-corrected trajectories superimposed on scale on the images and in closeups on the sides. MSD curves computed for each centriole before (thick continuous curves) and after (thin dashed curves) drift correction are plotted in the lower graphs. Scale bars: 0.5 μm in the images, 100 nm in the trajectory closeups.
To analyze this confinement in more detail, we acquired short time-lapse series in which a single image of the epithelium’s surface was taken every 2 s for a period of 10–15 min (Fig. 3 B). On this shorter timescale the trajectories of IHC centrioles could be accurately tracked. Both mother and daughter centrioles underwent incessant random movements characterized by position steps of a mean size between 50 and 80 nm (Table S1), without a preferential direction from one step to the next (Fig. 3 B). These movements were confined within a small region surrounding the equilibrium position of each centriole, which remained itself constant within the IHC apical surface (Fig. 3 B). Quantitative demonstration of this confinement was obtained by analyzing the MSD of IHC centrioles as a function of time. The MSD is defined as the mean-squared distance between two trajectory points sampled at t seconds interval (see Methods). Nonconfined movements are characterized by unbounded growth of the MSD over time; the growth is linear (MSD(t) ∝ t) in the case of a free diffusion, and quadratic (MSD(t) ∝ t2) in the case of a motion of constant velocity (29). By contrast, the MSD of a particle confined in a finite region of space saturates to a value proportional to the area of this region (30). The MSD curves of both IHC centrioles displayed a break at t = 2 s followed by a near-zero slope, implying the occurrence of a saturation during the first sampling period, i.e., between t = 0 and 2 s (Fig. 3 B). Beyond this initial saturation, the MSD curves displayed a slow quadratic growth, which could be attributed to the oriented cell movement related to the extension of the cochlear epithelium. The small velocity of this movement (cf. Table S1) contributed to the MSD value at t = 2 s by <1% on average. Although its subtraction from the IHC centriole trajectories (see Methods) did not change the shape of the MSD curve in its first few seconds, it made the MSD values become nearly constant past the break at t = 2 s (Fig. 3 B). Such MSD saturation was observed in a total of ∼200 IHCs examined at the various developmental stages in 54 cochleas. This is consistent with a confined diffusion of both IHC centrioles within a region of a diameter that we estimated between 0.2 and 0.35 μm (root mean-square value derived from the MSD at t = 2 s, cf. Table S1), comparable to the size of hair cell centrioles (150–200 nm) (31). The MSD of the relative position vector between the mother and daughter centrioles also displayed saturation around t = 2 s, and its value also remained nearly constant past this time point (Fig. 4 B). Thus, not only were the IHC centriole movements confined, but in every IHC the distance between centrioles and the orientation of the centriole pair remained constant on average and displayed only small fluctuations around their equilibrium values. The mean orientation of the centriole pair, however, varied from cell to cell (Figs. 3 A and data not shown).
Figure 4.
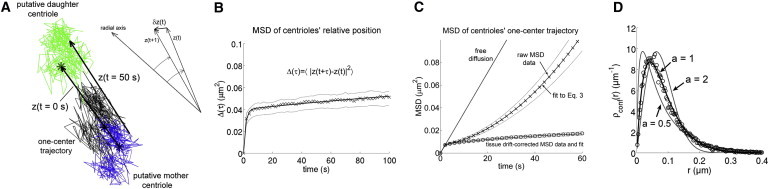
(A) Example of IHC centriole trajectories tracked from a short time-lapse sequence. Trajectories of the putative mother and daughter centrioles are in blue and green, respectively, and the one-center trajectory of the pair is in black. Stars indicate the starting points of the trajectories. Scale bar: 100 nm. (B and C) MSD as a function of time of the relative position vector z(t) (B) and of the one-center position x(t) (C) of IHC mother and daughter centrioles. Data averaged over IHCs imaged during the kinocilium migration period (stage 2, E15.5–E16.6 comprising 0.5–1 days in vitro; cf. Table S1). Crosses, MSD of raw IHC centriole trajectories. Circles, MSD of IHC centriole trajectories corrected for cochlear tissue drift. Thick continuous curves show averaged fits to Eq. 3. Thin dashed curves show standard errors. (D) Estimation of confinement forces. Data (crosses) show the distribution of distances of the drift-corrected one-center positions of the IHC centrioles to their equilibrium position, computed for the same group of IHCs as in B and C. Superimposed are fits of Boltzmann’s distribution ρconf(r) = Cr exp(–Vconf(r)/kBT) to the data, where T denotes temperature (set to 310 K), kB is Boltzmann’s constant, and Vconf(r)= V0ra, with a = 1/2 (soft potential), a = 1 (radial linear potential, giving the best fits), and a = 2 (quadratic potential).
Hair cell centriole movements are consistent with Brownian motion constrained by a radial restoring force
To analyze closer the movements of IHC centrioles, we hypothesized that they are due to Brownian motion, a plausible assumption in view of the submicrometer size of these structures (32,33). We thus assumed that each IHC centriole keeps moving under the influence of thermal fluctuations, while being maintained close to an equilibrium position by some restoring force. For a particle the size of a centriole, such movements can be described by the overdamped Langevin equation:
| (2) |
which expresses the balance between the various forces acting on the particle, specifically the viscous drag force −ηdx/dt, the restoring force Fconf(x), and the thermal force f(t). On experimental timescales, f(t) behave like a Gaussian white noise (a stochastic process with Gaussian centered distribution at each time and no temporal correlation). As a simple model for the restoring force, we take the gradient of a radial power-law potential Vconf(r) = V0ra (r = |x| being the distance separating the particle from its equilibrium position), so that Fconf(x) = – ∇Vconf(x) = – aV0ra-2x is radial and points toward the center. The case of a quadratic (or harmonic) potential, i.e., a = 2 corresponds to Hooke’s law Fconf(x) = – kx and is analytically tractable (34), the particle’s MSD being then given by (see the Supporting Material, section S4):
| (3) |
The first term in this expression represents an exponential saturation of the MSD with characteristic relaxation time τ0 and effective confinement area πA (assuming pure confinement without drift, A = 〈 x(t)2 〉 for t ≫ τ0). This saturation function is exact only in the case of a quadratic potential, but it remains a fairly accurate empirical model for other confined movements (35). The additional terms in Eq. 3 represent the contributions to the MSD of two possible types of drift affecting the confinement potential well (see the Supporting Material, section S4b): the linear term corresponds to a random (Brownian) drift of the center of the potential characterized by a small diffusion coefficient D0 (contributing little to the MSD over the relaxation time, i.e., D0 ≪ A/4τ0), and the quadratic term corresponds to the slow oriented drift of the tissue with velocity u0 (u02 ≪ A/τ02).
We analyzed the movements of the IHC mother and daughter centrioles by extracting their relative motion and their motion as a single object. The relative position trajectory was obtained from a bimodal Gaussian fit (two-center tracking), when the two centrioles could be optically resolved (which was the case in ∼35% of IHCs, cf. Methods). As for the motion of the centriole pair as a whole, it was obtained by fitting a single Gaussian spot to the image of the pair (one-center tracking), which was possible in all IHCs. The one-center trajectory closely approximated the trajectory of the centriole pair’s CM (the differences being typically within 10%, cf. Supporting Material, section S3). Eq. 3 fitted well to the experimental MSD for both the relative motion (Fig. 4 B) and the one-center motion (Fig. 4 C) of the IHC centrioles. Notably, the coefficient u0 estimated from Eq. 3 for the one-center motion was consistent with the cochlear epithelium extension velocity uCE estimated by a correlation computation. Both u0 and uCE were in the range of 2–5 nm/s (Table S1), consistent with the velocity of cochlear epithelium elongation previously reported (4). Of note, the introduction of a Brownian drift term (4D0 t) in Eq. 3 significantly improved the quality and robustness of the MSD fits (the fitted values of D0 were in the range of 0.3–0.5 × 10⁻⁴ μm2/s, corresponding to very small random steps of a few nm every 2 s, which we attributed to noise). Thus, the two analyzed components of the drift (random and oriented) had negligible (<1%) contributions to the MSD value at t = 2 s, and were much smaller than the mean size of the IHC centriole steps every 2 s (40–80 nm, Table S1). Taking both components into account, however, permitted accurate fits of the MSD curves to be obtained over periods of up to 100 s (Fig. 4, B and C). Together, these results are consistent with the notion that IHC centrioles undergo confined Brownian motion. Of note, the similar analysis that we performed on the centrioles of supporting cells showed that their movements during the same period could also be characterized as a confined Brownian motion (Table S2, and data not shown). Our study thus demonstrates the Brownian behavior of centrioles in cochlear epithelial cells.
The amplitude of the Brownian movements of hair cell centrioles is inversely related to the amplitude of the restoring force acting on them, allowing for an indirect estimate of this force to be obtained (36). We performed a confinement force analysis based on the distribution of the distances of one-center IHC centriole trajectories from their equilibrium positions (Fig. 4 D). This distribution was fitted by the Boltzmann distribution for a Brownian particle subject to a power-law confinement potential Vconf(x) = V0ra (cf. Supporting Material, section S2). The fits obtained for three different values of the exponent a are shown: a = 1/2, a soft potential for which the confinement force Fconf(x) decreases with distance; a = 1, a linear radial potential for which Fconf(x) has constant magnitude; a = 2, a quadratic potential, for which Hooke’s law Fconf(x) = – kx holds. The magnitude of the mean radial force acting on the centrioles could be estimated from the fitted values of the potential amplitude V0, and ranged between 0.05 and 0.15 pN. The best-fit distribution was obtained for a = 1 (Fig. 4 D), corresponding to a non-Hookian radial force of constant magnitude (actual fits of the exponent a produced values between 0.9 and 1.1, with resulting distributions undistinguishable from that obtained for a = 1).
These results suggest nonlinear mechanical interactions between the IHC centrioles and the structures responsible for their confinement. In hair cells, the basal body and daughter centriole are housed in a region of the cuticular plate apparently devoid of actin filaments, referred to as a cytoplasmic channel (37). Within this channel, the basal body is connected to the apical cell membrane by transition fibers (38,39). In addition, the basal body lies at the center of a radial array of microtubules extending below the cuticular plate and projecting to the periphery of the cell apical cortex (20,37). The centriole movements are likely constrained by these structures (40), by the surrounding pericentriolar material, and by links coupling the two centrioles (23). Similar Boltzmann fit analysis for the supporting cells also produced best-fit values of the confinement potential exponent a close to 1 (data not shown). Our results therefore suggest that Langevin’s dynamics involving a constant effective radial force (41) is relevant to model the interactions of centrioles with their surrounding structures in the hair cells and in supporting cells of the developing cochlea.
Hair cell centriole movements remain confined throughout the period of kinocilium migration
We finally addressed the possible changes in the IHC centriole movements accompanying the kinocilium migration period, by comparison of the characteristics of these movements at three different stages, namely before (stage 1, E14.5–E15 comprising ∼0.5 day in vitro), during (stage 2, E15.5–E16.5 comprising 0.5–2 days in vitro), and after (stage 3, E17.5–E18.5 comprising 0.5–3 days in vitro) kinocilium migration. We observed a decrease in the mean oriented velocity of the cochlear epithelium at stage 3 (p < 10−4, Fig. 5, A and B and Table S1), whereas no change of this velocity was detected between stages 1 and 2 (p = 0.8; Table S1). This change is consistent with the slowing down of cochlear epithelium elongation between E17 and birth (4). By contrast, no qualitative differences in the confined Brownian motion of the IHC centrioles were observed between the various stages. In particular, the estimated confinement force had similar amplitudes, and the best-fitted value of the confinement potential exponent (a ≈ 1) displayed no significant change. These observations argue for confined Brownian motion as being the only mode of IHC centriole movements throughout the kinocilium migration period. The only dynamic change that we observed was a twofold increase in the effective confinement area of the IHC centrioles between stage 1 and stage 2 (the mean value of their one-center MSD at t = 2 s switching from 3.43 ± 0.56 × 10⁻³ μm2 to 7.12 ± 0.59 × 10⁻³ μm2, p < 10−3, Welch’s t-test, Fig. 5, A and B, and Table S1). This enlargement suggests a partial relaxation of the constraints acting on the IHC centrioles during the initial phase of kinocilium migration. Such a relaxation could reflect a remodeling of the structures coupled to the IHC basal body, which could be internally driven, or be influenced by the varying mechanical stress across the cochlear epithelium during its extension. Of note, the confinement area of the centrioles also increased between stages 1 and 2 in the supporting cells neighboring the IHCs (Table S2), arguing for a contribution of cochlear epithelium extension in this enlargement.
Figure 5.
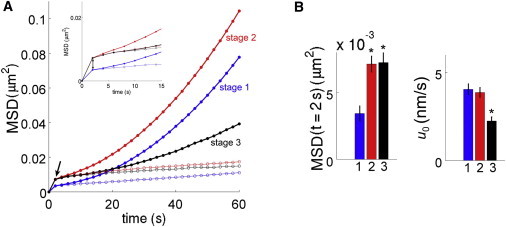
Comparative analysis of cochlear centriole trajectory characteristics at three stages of examination before (blue, E14.5), during (red, E15.5–E16.5 including 0.5–1 in vitro day), and after (black, E17.5–E18.5 including 0.5–3 in vitro days) the kinocilium migration period. (A) Plots of the averaged MSD curves obtained from the raw IHC centriole trajectory data (solid circle) and from the drift-corrected ones (thin open circles) for the three stages. (B) Quantification and statistical comparison of MSD (t = 2 s) and of the tissue drift velocity u0. Stars indicate statistical significance according to Welch’s t-test (p < 0.001).
Concluding Remarks
The previous static and dynamic analyses establish that kinocilium migration in cochlear hair cells does not result from a rapid positional switch, but instead is a slow process involving gradual displacements of the basal body and its daughter centriole, both undergoing a continuously confined Brownian motion. Our study also reveals that these displacements occur in parallel with the cochlear convergent extension process. That these two apparently synchronized processes might be physically coupled emerges as an attractive possibility. Combined with the use of mouse mutants and chemical agents, analyzing the confined Brownian motion of hair cell centrioles should provide a valuable quantitative approach to identify which structural constraints contribute to their confinement, and investigate which cytoskeletal mechanisms underlie kinocilium migration.
Acknowledgments
We thank Dr. J. Levilliers for help in the preparation of the manuscript, Dr. J.-P. Hardelin for useful comments, the Plate-Forme d’Imagerie Dynamique of the Pasteur Institute Imagopole, Dr. J. Herring, for help in the design of the cochlear culture podium, and G. Inizan from the Pasteur mechanical workshop, for technical assistance. L.L. received fellowships from the Fondation pour la Recherche Médicale.
This work was supported by grants from Fondation Raymonde et Guy Strittmatter, FAUN Stiftung (Suchert Foundation), Réunica-Prévoyance group, Conny Maeva Charitable Foundation, Fondation Orange, Louis-Jeantet Foundation, ERC grant « Hair bundle » (ERC-2011-AdG 294570), and ANR (EA - 11 BSV5 01102 EARMEC).
Supporting Material
References
- 1.Nayak G.D., Ratnayaka H.S.K., Richardson G.P. Development of the hair bundle and mechanotransduction. Int. J. Dev. Biol. 2007;51:597–608. doi: 10.1387/ijdb.072392gn. [DOI] [PubMed] [Google Scholar]
- 2.Lefèvre G., Michel V., Petit C. A core cochlear phenotype in USH1 mouse mutants implicates fibrous links of the hair bundle in its cohesion, orientation and differential growth. Development. 2008;135:1427–1437. doi: 10.1242/dev.012922. [DOI] [PubMed] [Google Scholar]
- 3.Goodyear R.J., Marcotti W., Richardson G.P. Development and properties of stereociliary link types in hair cells of the mouse cochlea. J. Comp. Neurol. 2005;485:75–85. doi: 10.1002/cne.20513. [DOI] [PubMed] [Google Scholar]
- 4.McKenzie E., Krupin A., Kelley M.W. Cellular growth and rearrangement during the development of the mammalian organ of Corti. Dev. Dyn. 2004;229:802–812. doi: 10.1002/dvdy.10500. [DOI] [PubMed] [Google Scholar]
- 5.Wang J., Mark S., Chen P. Regulation of polarized extension and planar cell polarity in the cochlea by the vertebrate PCP pathway. Nat. Genet. 2005;37:980–985. doi: 10.1038/ng1622. [DOI] [PMC free article] [PubMed] [Google Scholar]
- 6.Yamamoto N., Okano T., Kelley M.W. Myosin II regulates extension, growth and patterning in the mammalian cochlear duct. Development. 2009;136:1977–1986. doi: 10.1242/dev.030718. [DOI] [PMC free article] [PubMed] [Google Scholar]
- 7.Montcouquiol M., Rachel R.A., Kelley M.W. Identification of Vangl2 and Scrb1 as planar polarity genes in mammals. Nature. 2003;423:173–177. doi: 10.1038/nature01618. [DOI] [PubMed] [Google Scholar]
- 8.Dabdoub A., Donohue M.J., Kelley M.W. Wnt signaling mediates reorientation of outer hair cell stereociliary bundles in the mammalian cochlea. Development. 2003;130:2375–2384. doi: 10.1242/dev.00448. [DOI] [PubMed] [Google Scholar]
- 9.Rida P.C.G., Chen P. Line up and listen: planar cell polarity regulation in the mammalian inner ear. Semin. Cell Dev. Biol. 2009;20:978–985. doi: 10.1016/j.semcdb.2009.02.007. [DOI] [PMC free article] [PubMed] [Google Scholar]
- 10.Jones C., Chen P. Primary cilia in planar cell polarity regulation of the inner ear. Curr. Top. Dev. Biol. 2008;85:197–224. doi: 10.1016/S0070-2153(08)00808-9. [DOI] [PMC free article] [PubMed] [Google Scholar]
- 11.Sobkowicz H.M., Slapnick S.M., August B.K. The kinocilium of auditory hair cells and evidence for its morphogenetic role during the regeneration of stereocilia and cuticular plates. J. Neurocytol. 1995;24:633–653. doi: 10.1007/BF01179815. [DOI] [PubMed] [Google Scholar]
- 12.Satir P., Pedersen L.B., Christensen S.T. The primary cilium at a glance. J. Cell Sci. 2010;123:499–503. doi: 10.1242/jcs.050377. [DOI] [PMC free article] [PubMed] [Google Scholar]
- 13.Bornens M. The centrosome in cells and organisms. Science. 2012;335:422–426. doi: 10.1126/science.1209037. [DOI] [PubMed] [Google Scholar]
- 14.Cotanche D.A., Corwin J.T. Stereociliary bundles reorient during hair cell development and regeneration in the chick cochlea. Hear. Res. 1991;52:379–402. doi: 10.1016/0378-5955(91)90027-7. [DOI] [PubMed] [Google Scholar]
- 15.Denman-Johnson K., Forge A. Establishment of hair bundle polarity and orientation in the developing vestibular system of the mouse. J. Neurocytol. 1999;28:821–835. doi: 10.1023/a:1007061819934. [DOI] [PubMed] [Google Scholar]
- 16.Boëda B., El-Amraoui A., Petit C. Myosin VIIa, harmonin and cadherin 23, three Usher I gene products that cooperate to shape the sensory hair cell bundle. EMBO J. 2002;21:6689–6699. doi: 10.1093/emboj/cdf689. [DOI] [PMC free article] [PubMed] [Google Scholar]
- 17.Michel V., Goodyear R.J., Petit C. Cadherin 23 is a component of the transient lateral links in the developing hair bundles of cochlear sensory cells. Dev. Biol. 2005;280:281–294. doi: 10.1016/j.ydbio.2005.01.014. [DOI] [PubMed] [Google Scholar]
- 18.Webb S.W., Grillet N., Müller U. Regulation of PCDH15 function in mechanosensory hair cells by alternative splicing of the cytoplasmic domain. Development. 2011;138:1607–1617. doi: 10.1242/dev.060061. [DOI] [PMC free article] [PubMed] [Google Scholar]
- 19.Sipe C.W., Lu X. Kif3a regulates planar polarization of auditory hair cells through both ciliary and non-ciliary mechanisms. Development. 2011;138:3441–3449. doi: 10.1242/dev.065961. [DOI] [PMC free article] [PubMed] [Google Scholar]
- 20.Jones C., Roper V.C., Chen P. Ciliary proteins link basal body polarization to planar cell polarity regulation. Nat. Genet. 2008;40:69–77. doi: 10.1038/ng.2007.54. [DOI] [PubMed] [Google Scholar]
- 21.Ross A.J., May-Simera H., Beales P.L. Disruption of Bardet-Biedl syndrome ciliary proteins perturbs planar cell polarity in vertebrates. Nat. Genet. 2005;37:1135–1140. doi: 10.1038/ng1644. [DOI] [PubMed] [Google Scholar]
- 22.Pulecio J., Petrovic J., Benvenuti F. Cdc42-mediated MTOC polarization in dendritic cells controls targeted delivery of cytokines at the immune synapse. J. Exp. Med. 2010;207:2719–2732. doi: 10.1084/jem.20100007. [DOI] [PMC free article] [PubMed] [Google Scholar]
- 23.Piel M., Meyer P., Bornens M. The respective contributions of the mother and daughter centrioles to centrosome activity and behavior in vertebrate cells. J. Cell Biol. 2000;149:317–330. doi: 10.1083/jcb.149.2.317. [DOI] [PMC free article] [PubMed] [Google Scholar]
- 24.Chen P., Johnson J.E., Segil N. The role of Math1 in inner ear development: uncoupling the establishment of the sensory primordium from hair cell fate determination. Development. 2002;129:2495–2505. doi: 10.1242/dev.129.10.2495. [DOI] [PubMed] [Google Scholar]
- 25.Helms A.W., Abney A.L., Johnson J.E. Autoregulation and multiple enhancers control Math1 expression in the developing nervous system. Development. 2000;127:1185–1196. doi: 10.1242/dev.127.6.1185. [DOI] [PubMed] [Google Scholar]
- 26.Lumpkin E.A., Collisson T., Johnson J.E. Math1-driven GFP expression in the developing nervous system of transgenic mice. Gene Expr. Patterns. 2003;3:389–395. doi: 10.1016/s1567-133x(03)00089-9. [DOI] [PubMed] [Google Scholar]
- 27.Boutet de Monvel J., Le Calvez S., Ulfendahl M. Image restoration for confocal microscopy: improving the limits of deconvolution, with application to the visualization of the mammalian hearing organ. Biophys. J. 2001;80:2455–2470. doi: 10.1016/S0006-3495(01)76214-5. [DOI] [PMC free article] [PubMed] [Google Scholar]
- 28.Lepelletier, L. 2009. Le développement de l’épithélium sensoriel auditif mouvements cellulaires et détermination de la forme de la région apicale des cellules ciliées. PhD Thesis. University Paris 7, France.
- 29.Qian H., Sheetz M.P., Elson E.L. Single particle tracking. Analysis of diffusion and flow in two-dimensional systems. Biophys. J. 1991;60:910–921. doi: 10.1016/S0006-3495(91)82125-7. [DOI] [PMC free article] [PubMed] [Google Scholar]
- 30.Jin S., Haggie P.M., Verkman A.S. Single-particle tracking of membrane protein diffusion in a potential: simulation, detection, and application to confined diffusion of CFTR Cl- channels. Biophys. J. 2007;93:1079–1088. doi: 10.1529/biophysj.106.102244. [DOI] [PMC free article] [PubMed] [Google Scholar]
- 31.Flock A., Duvall A.J., 3rd The ultrastructure of the kinocilium of the sensory cells in the inner ear and lateral line organs. J. Cell Biol. 1965;25:1–8. doi: 10.1083/jcb.25.1.1. [DOI] [PMC free article] [PubMed] [Google Scholar]
- 32.Rafelski S.M., Keller L.C., Marshall W.F. Apparent diffusive motion of centrin foci in living cells: implications for diffusion-based motion in centriole duplication. Phys. Biol. 2011;8:026010. doi: 10.1088/1478-3975/8/2/026010. [DOI] [PMC free article] [PubMed] [Google Scholar]
- 33.Marshall W.F. Basal bodies platforms for building cilia. Curr. Top. Dev. Biol. 2008;85:1–22. doi: 10.1016/S0070-2153(08)00801-6. [DOI] [PubMed] [Google Scholar]
- 34.Risken H. Springer; New York: 1996. The Fokker-Planck Equation: Methods of Solutions and Applications. [Google Scholar]
- 35.Destainville N., Saulière A., Salomé L. Comment to the article by Michael J. Saxton: a biological interpretation of transient anomalous subdiffusion. I. qualitative model. Biophys. J. 2008;95:3117–3119. doi: 10.1529/biophysj.108.136739. author reply 3120–3122. [DOI] [PMC free article] [PubMed] [Google Scholar]
- 36.Duplantier B. Brownian motion, “diverse and undulating.”. In: Damour T., Darrigol O., Rivaseau V., editors. Eintein, 1905-2005, Poincaré Seminar, Progress in Mathematical Physics Volume 47. Birkhäuser Basel; 2005. pp. 201–293. [Google Scholar]
- 37.Furness D.N., Hackney C.M., Steyger P.S. Organization of microtubules in cochlear hair cells. J. Electron Microsc. Tech. 1990;15:261–279. doi: 10.1002/jemt.1060150306. [DOI] [PubMed] [Google Scholar]
- 38.Anderson R.G. The three-dimensional structure of the basal body from the rhesus monkey oviduct. J. Cell Biol. 1972;54:246–265. doi: 10.1083/jcb.54.2.246. [DOI] [PMC free article] [PubMed] [Google Scholar]
- 39.O’Toole E.T., Giddings T.H., Dutcher S.K. Three-dimensional organization of basal bodies from wild-type and delta-tubulin deletion strains of Chlamydomonas reinhardtii. Mol. Biol. Cell. 2003;14:2999–3012. doi: 10.1091/mbc.E02-11-0755. [DOI] [PMC free article] [PubMed] [Google Scholar]
- 40.Bornens M. Organelle positioning and cell polarity. Nat. Rev. Mol. Cell Biol. 2008;9:874–886. doi: 10.1038/nrm2524. [DOI] [PubMed] [Google Scholar]
- 41.Lagache T., Dauty E., Holcman D. Physical principles and models describing intracellular virus particle dynamics. Curr. Opin. Microbiol. 2009;12:439–445. doi: 10.1016/j.mib.2009.06.015. [DOI] [PubMed] [Google Scholar]
Associated Data
This section collects any data citations, data availability statements, or supplementary materials included in this article.