

Abstract
Background:
Epidemiologic studies link short sleep duration to obesity and weight gain. Insufficient sleep appears to alter circulating levels of the hormones leptin and ghrelin, which may promote appetite, although the effects of sleep restriction on caloric intake and energy expenditure are unclear. We sought to determine the effect of 8 days/8 nights of sleep restriction on caloric intake, activity energy expenditure, and circulating levels of leptin and ghrelin.
Methods:
We conducted a randomized study of usual sleep vs a sleep restriction of two-thirds of normal sleep time for 8 days/8 nights in a hospital-based clinical research unit. The main outcomes were caloric intake, activity energy expenditure, and circulating levels of leptin and ghrelin.
Results:
Caloric intake in the sleep-restricted group increased by +559 kcal/d (SD, 706 kcal/d, P = .006) and decreased in the control group by −118 kcal/d (SD, 386 kcal/d, P = .51) for a net change of +677 kcal/d (95% CI, 148-1,206 kcal/d; P = .014). Sleep restriction was not associated with changes in activity energy expenditure (P = .62). No change was seen in levels of leptin (P = .27) or ghrelin (P = .21).
Conclusions:
Sleep restriction was associated with an increase in caloric consumption with no change in activity energy expenditure or leptin and ghrelin concentrations. Increased caloric intake without any accompanying increase in energy expenditure may contribute to obesity in people who are exposed to long-term sleep restriction.
Trial Registration:
ClinicalTrials.gov; No.: NCT01334788; URL: www.clinicaltrials.gov
Obesity affects more than one-third of the American population1 and if left unchecked is projected to become the leading cause of preventable death in the United States.2 Interventions to prevent and treat obesity are a major public health priority.3 Short sleep duration may be an important but unrecognized factor promoting obesity.4 Population-based studies have reported a dose-response relationship between short sleep duration and high BMI,5‐12 and there may be an association with weight gain.6,7,13,14 Voluntary sleep restriction is common: 28% of the adult population in the United States reports getting ≤ 6 h of sleep per night.15 Although the secular trends have not been well defined,16 the number of young adults reporting < 7 h of sleep per night has doubled since 1960,17 and insufficient sleep has been described as a public health epidemic.18
Sleep duration may affect circulating levels of the hormones that regulate appetite and caloric intake, with an increase in the orexigenic hormone ghrelin and a reduction in the anorexic hormone leptin,19‐22 and experimental studies suggest that sleep restriction may increase hunger and caloric consumption.23,24 On the other hand, sleep appears to conserve energy,25‐27 and a night of sleep restriction resulted in increased energy expenditure estimated from actigraphy23; however, others have reported no change in total energy expenditure during sleep restriction.28 Thus, although epidemiologic studies suggest a correlation between short sleep duration and obesity, and experimental studies suggest a potential mechanistic link among sleep restriction, hormonal changes, and increased caloric intake, the overall effect on energy balance remains unclear. Given that sleep restriction is often voluntary and potentially avoidable, understanding whether and how insufficient sleep leads to any positive energy balance and, hence, development of obesity is crucial to clinical interventions, public health policy, and informing future studies.29‐31 We, therefore, tested the hypothesis that sleep restriction would increase caloric intake while reducing activity energy expenditure, and that circulating levels of leptin would decrease and ghrelin would increase.
Materials and Methods
This was a parallel-group study, randomized 1:1 to sleep deprivation vs control sleep, stratified by sex, conducted at the Clinical Research Unit at Saint Marys Hospital, part of the Center for Translational Science Activities of Mayo Clinic. Individuals gave written informed consent. This study was approved by the Mayo Clinic institutional review board (IRB No. 08-006780).
Subjects
Eligible individuals were between the ages of 18 and 40 years, of normal weight (BMI, 18.5-24.9 kg/m2), and sedentary (defined as less than four 20-min episodes of moderate- or vigorous-intensity physical activity in the prior 4 weeks), had no medical conditions requiring ongoing treatment, and were taking no medications other than oral contraceptive pills for birth control. Exclusion criteria were pregnancy or plans to become pregnant in the next year, tobacco use, anemia, any sleep disorder, and inability to follow the study protocol.
Screening Evaluation
Subjects underwent a screening evaluation consisting of a physical examination, dietary surveys, an assessment of hemoglobin concentration, a urine pregnancy test, and an overnight polysomnogram (PSG). Subjects left our facility the morning after the PSG wearing a digital actigraph (Actiwatch 2; Philips Respironics) and wore it continuously for at least 1 week while engaging in their usual activities.
Inpatient Phase
One week to 1 month after the screening examination, subjects were admitted to the Clinical Research Unit and began the 15-day and 14-night inpatient phase of the study (Fig 1). Temperature and lighting were controllable and left to the discretion of the subjects, who were allowed access to clocks and were aware that awakening would consistently occur at 6:00 am during the study. The first 3 days and 3 nights consisted of an acclimation phase during which subjects were allowed to go to sleep ad lib. The experimental phase consisted of the subsequent 8 days and 8 nights. A computer-generated list of random numbers was used to create simple randomization to the sleep-deprivation or control group 1:1 stratified by sex. Allocation concealment and blinding of participants, study staff, and researchers, except for the lead physician (A. D. C.) and lead sleep technologist (C. W.), until the experimental phase was achieved as much as possible through the use of a single protocol with identical procedures except for the provision that bedtime would be according to randomization status during the experimental phase. On the morning of the fourth day, participants and staff were informed of the randomization status. During the experimental phase, those randomized to sleep deprivation were asked to stay awake between 6:00 am and their bedtime, which was calculated to give an in-bed time equal to two-thirds of their usual sleep time using data from the actigraph. Those randomized to the control group were allowed to go to sleep ad lib. During the experimental phase of the study protocol, nurses checked on each subject every 30 min and recorded their activities between 7:00 am and bedtime. After the experimental phase, subjects entered the recovery phase for 4 days/3 nights during which all subjects continued to be awakened at 6:00 am and all were allowed to go to bed ad lib.
Figure 1.
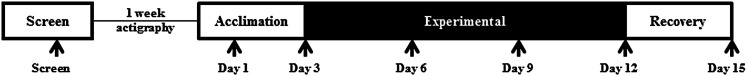
Study diagram.
Sleep Monitoring
PSGs were performed at the screening examination and each night during the inpatient phase of the study. PSGs were digitally recorded (Siesta; Compumedics Limited) and scored using Profusion3 PSG (Compumedics Limited) software. Recorded parameters included three-channel EEG, two-channel electrooculography, oronasal airflow by pressure transducer and thermocouple sensors, submental and limb electromyograms, ECG, transcutaneous pulse oximetry, thoracic and abdominal respiratory effort by inductance plethysmography, snoring by tracheal microphone or piezocrystal sensor, and body position by calibrated body position sensor and video monitoring. During the daytime, wakefulness was assessed by continuous three-channel EEG, two-channel electrooculography, submental and electromyograms, and ECG using the Siesta device. Scoring of sleep stages, disordered breathing events, oxygen desaturation, and periodic limb movement was performed by an experienced polysomnographer, and results were reviewed by a qualified physician in accordance with current American Academy of Sleep Medicine guidelines.32
Dietary Access and Monitoring
During the study, subjects were allowed ad lib food and drink without restrictions. Subjects were allowed to order from both the general hospital menu and from the Metabolic Kitchen and were allowed to bring in food from outside the hospital as long as the staff were allowed to inspect the food. Snack foods, tailored to the preferences of the individual, were kept in cabinets in the subjects’ rooms and were refilled on a daily basis. Dieticians assessed dietary intake daily from receipts from the hospital menu, logs from the Metabolic Kitchen, food logs, and inspections of the subjects’ snack foods. Those assessing caloric intake were not aware of condition assignment until the experimental phase began, at which time blinding would not have been possible for practical reasons. The duration of this study was too short to reliably see changes in fat mass and weight, although to provide exploratory data, subjects were weighed on a digital scale at the end of the acclimation, experimental, and recovery periods.
Physical Activity Monitoring
Energy expenditure was assessed using the physical activity monitoring system (PAMS). The PAMS is composed of four inclinometers and two triaxial accelerometers worn as part of specially designed undergarments, and the data are stored every one-half second. Prior studies have shown an excellent correlation between the PAMS and energy expenditure (r2 = 0.99), measured using doubly labeled water.33‐37 All subjects wore the PAMS during the acclimation period during inpatient days 2 to 4, during the experimental phase (days 6-8 and 9-11), and during the recovery phase (days 13-15).
Biochemical Measurements
Venous blood was collected by standard venipuncture on the last day of each study period between 6:10 am and 6:30 am prior to arising from recumbency. Leptin and total ghrelin were measured by radioimmunoassay (Millipore).
Statistical Analysis
The primary outcome measure was change in total caloric consumption for the last 2 days in each study period (days 10 and 11 for the experimental period and days 13 and 14 for the recovery period) relative to baseline (days 2 and 3). A full factorial repeated-measures analysis of variance model (main effect of randomized treatment, study period, and their interaction) was fit while accounting for the repeated measures within participant (ie, a mixed model with a random subject effect). Contrasts of estimated means were used to test for differences in caloric consumption between groups. Changes in physical activity level and other biochemical outcomes were tested using similar methodology. Analyses were performed with SAS, version 9.3 (SAS Institute, Inc). For all comparisons P < .05 was considered significant.
Results
Subject Characteristics
We were contacted by 27 individuals asking about potential study participation, of whom 17 felt that they could participate and were formally assessed for this study (Fig 2). Of these, all 17 subjects entered the study, none was excluded, and all were randomized to either sleep deprivation or control. All randomized participants completed the study and our analysis set consisted of 11 men and six women, of whom five men and three women were randomized to sleep deprivation. No differences in baseline anthropomorphic or sleep characteristics were seen (Table 1).
Figure 2.

Enrollment, allocation, follow-up, and analysis of study participants.
Table 1.
—Baseline Subject Characteristics
| Characteristic | Sleep-Deprived Group | Control Group | P Value |
| No. | 8 | 9 | … |
| Age, y | 24.1 ± 4.5 | 25.4 ± 4.7 | .60 |
| Male (female) | 5 (3) | 6 (3) | .86 |
| BMI, kg/m2 | 22.9 ± 1.8 | 22.4 ± 2.5 | .66 |
| Time in bed,a h | 8.1 ± 0.7 | 7.9 ± 1.2 | .69 |
| Total sleep time,a h | 7.5 ± 0.7 | 7.0 ± 1.4 | .20 |
| Sleep efficiency,a % | 92.7 ± 3.6 | 87.6 ± 8.8 | .18 |
Data are presented as mean ± SD.
Values are estimated from home actigraphy recordings.
Adherence to Study Protocol
Total sleep time in the control and sleep-deprived groups during the acclimation, experimental, and recovery periods averaged 405 and 372 min, 417 and 312 min, and 408 and 465 min, respectively (Fig 3).
Figure 3.

Total sleep duration per day in the control and sleep-deprived groups during the acclimation, experimental, and recovery periods. Subjects randomized to the sleep-restriction group were allowed only two-thirds their normal time in bed. Total sleep duration per day in the control and sleep-deprived groups during the acclimation, experimental, and recovery periods averaged 405 and 372 min, 417 and 312 min, and 408 and 465 min, respectively. Error bars represent SDs.
Caloric Intake
The incremental change in total calories at the end of the experimental and recovery periods relative to the acclimation period is presented in Table 2. Mean (SD) change in caloric consumption for the sleep deprived and control groups were +559 (706) (P = .006) and −118 (386) (P = .51) kcal/d, respectively. The net increase in caloric intake in the sleep-deprived group was, thus, 677 kcal/d (95% CI, 148-1,206 kcal/d; P = .014) higher than that of the control group. Caloric intake remained nonsignificantly elevated during the recovery phase in those randomized to sleep deprivation (+147 [494], P = .44) while caloric intake in those randomized to the control group remained stable (−3 [585], P = .99). There were, however, potentially clinically relevant differences in baseline caloric consumption between the two randomized groups at the end of the acclimation period with the control subjects, on average, consuming 3,060 (835) kcal/d compared to 2,382 (578) in the experimental group (P = .09). Weight among those randomized to sleep restriction increased over the experimental period (median, +0.9 kg; interquartile range, 0.4-1.9 kg; P = .039 signed rank test) but not among those randomized to ad lib sleep (median, +0.6 kg; interquartile range, 0.2-1.0; P = .129). The change in weight over the experimental period did not differ by study group (P = .53).
Table 2.
—Outcomes
| Acclimation Phase | Experimental Phase | Recovery Phase | Difference, Acclimation to Experimental, (95% CI)a | P Value | ||||
| Outcome | Sleep-Deprived | control | Sleep-Deprived | control | Sleep-Deprived | control | ||
| Caloric intake, kcal/d | 2,382 (578) | 3,060 (835) | 2,942 (978) | 2,942 (794) | 2,530 (575) | 3,056 (914) | 677 (148, 1,206) | .014 |
| Physical activity, total accelerations | 3,116 (1,252) | 2,885 (613) | 3,154 (533) | 3,128 (1,268) | 2,850 (824) | 2,961 (546) | −205 (−1,039, 628) | .62 |
| Biochemical measurements | ||||||||
| Ghrelin,b pg/mL | 799 (241) | 708 (166) | 759 (284) | 740 (266) | 739 (255) | 666 (184) | −72 (−188, 44) | .21 |
| Leptin, ng/mL | 10.7 (10.7) | 9.3 (11.6) | 11.6 (11.5) | 8.4 (8.6) | 12.1 (12.1) | 8.2 (8.2) | 1.8 (−1.5, 5.1) | .27 |
Data are presented as mean ± SD.
Estimated change from the acclimation to experimental time period between the experimental and control groups.
Ghrelin was measured as total ghrelin.
Physical Activity
Total accelerations did not differ statistically by group or time (P = .70). There was no difference in the change in total accelerations from the acclimation to experimental time points between groups (P = .62) or from the acclimation to recovery phase between groups (P = .41). Similarly, no change in total accelerations between the acclimation and experimental time points was seen in either the sleep-deprived group (P = .90) or the control group (P = .39) (Table 2), and no change was seen between the acclimation and recovery time points in either the sleep-deprived group (P = .38) or the control group (P = .79).
Leptin and Ghrelin Concentrations
There were no significant differences in leptin or ghrelin levels by group or time (P = .29, P = .43, respectively). Ghrelin levels remained similar between the acclimation and experimental periods in the sleep-deprived group (799 [241] and 759 [284] pg/mL; P = .35) and in the control group (708 [166] to 740 [226] pg/mL; P = .41). The between-group difference for these changes was not statistically significant (P = .21). Leptin similarly did not change in the sleep-deprived group (P = .45) or in the control group (P = .41) (Table 2). The between-group difference on the change scores was not significant (P = .27).
Discussion
We found that modest sleep restriction over an 8-day period is associated with a significant increase in caloric intake without any change in activity energy expenditure. The magnitude of the increase in caloric intake was striking, with those randomized to sleep restriction consuming an additional 559 kcal/d. Contrary to our hypothesis, we found no change in circulating leptin and ghrelin levels.
Our findings suggest that sleep restriction alters the drive to eat because we found that caloric intake increased in the absence of changes in energy expenditure. Although it has been suggested that sleep restriction acutely reduces concentrations of leptin and increases concentrations of ghrelin, differences in leptin concentration have not been seen in all cross-sectional studies38 nor have changes in leptin concentration been found in all acute sleep-restriction studies.39 We found no changes in leptin nor ghrelin concentration after 8 days of sleep restriction. Whether this was due to the longer study duration than was used previously19‐21 is unclear, although one prior study that allowed ad lib access to food during 14 days of sleep restriction also found no changes in leptin and ghrelin.28 Meanwhile, Buxton and colleagues22 found that sleep restriction with circadian misalignment did decrease leptin and increase ghrelin when food intake was held constant. Thus, it seems most plausible that although sleep restriction and/or circadian misalignment may decrease leptin concentrations and increase ghrelin concentrations, at least acutely, over time, a net positive energy balance with consequent increase in body fat may mask these changes. Leptin and ghrelin signaling was not directly assessed in this study, but it seems likely that changes in the hedonic response to food in the CNS occur in response to sleep restriction.24,40 Finally, there is some evidence that the risk of weight gain seems most closely related to disinhibited eating,41 implying that the normal regulatory signaling mechanisms may not function appropriately in response to sleep restriction.
We found no change in activity energy expenditure. Others have found that sleep restriction likely does not change the resting metabolic rate, thermic effect of food, or total energy expenditure.28 These results imply that the increased caloric intake associated with sleep restriction may provide a powerful impetus for the development of obesity. This is supported by our data suggesting that those undergoing sleep restriction had a tendency toward weight gain.
The strengths of our study include the ecologically relevant sleep conditions together with ad lib access to food coupled with comprehensive monitoring in a group of healthy normal individuals without underlying sleep pathology. Importantly, sleep and wakefulness were monitored objectively by EEG on a continuous basis, the only exception being when patients were showering, when they were assumed to be awake. The magnitude of sleep restriction was likely relevant. Data from the National Health and Nutrition Examination Survey show that 26.8% of individuals reported a usual sleep duration of ≤ 6 h/d,15 although it is unclear how this self-reported usual sleep time compares with our sleep-restricted group, who went from a PSG-confirmed total sleep duration of 6.2 to 5.2 h/d. Similarly, caloric intake and activity energy expenditure were measured comprehensively and on a virtually continuous basis. To the best of our knowledge, no prior randomized controlled study of sleep restriction has conducted simultaneous monitoring of caloric intake, activity, and sleep-wakefulness in as robust a manner.
Our study has several limitations. First, participants were relatively young and healthy. It is the young population that is most commonly sleep deprived,42 because of the widespread recent use of electronic entertainment and communication technology,43 and who may conceivably face a lifetime of sleep restriction and potential negative health implications. However, it is unclear if our results would have been different had we included older individuals and those with medical conditions. Second, our laboratory-based protocol was of intermediate duration, and it is unclear to what extent our model mimics the experience of free-living individuals. Furthermore, it is unclear from our data if caloric intake remains elevated after the period of sleep restriction ends and ad lib sleep is allowed. Third, our study protocol had unique aspects that require consideration. Sleep was proportionally reduced within each subject and although this may help attenuate the natural variation in sleep duration among individuals, it may not fully reflect the different patterns by which individuals may limit their sleep times. Furthermore, sleep onset was delayed, whereas awakening time was held constant. This may have induced some degree of circadian misalignment. The extent to which our findings were due to sleep restriction vs circadian misalignment is unclear, although this may reflect the common experience of free-living individuals, especially those involved with shift work.44 Furthermore, sleep restriction together with circadian disruption appear to contribute to the metabolic derangements seen with restricted sleep,45 which may promote obesity,22 something that has not been explored in epidemiologic studies, which have generally examined total sleep time and not sleep patterns.46 Finally, our study sample size was relatively modest. There were small differences in baseline sleep parameters and caloric intake. It is possible, but seems unlikely, that these baseline differences affected our results, given the significant within-group changes in caloric intake.
Conclusions
In conclusion, modest sleep restriction in relatively young healthy individuals is accompanied by increases in caloric intake without any significant changes in energy expenditure. Similar magnitudes of sleep restriction are relatively common in the general population and may contribute to the high and rising prevalence of obesity.
Acknowledgments
Author contributions: Dr Somers had full access to the data and vouches for the integrity of the data analysis.
Dr Calvin: contributed to the study design, study supervision, data generation and interpretation, and drafting and writing of the report.
Dr Carter: contributed to the data interpretation, statistical analyses, and drafting and writing of the report.
Dr Adachi: contributed to the study design, data generation, and drafting and writing of the report.
Dr Macedo: contributed to the study design, data generation, and drafting and writing of the report.
Dr Albuquerque: contributed to the study design, data generation, and drafting and writing of the report.
Ms van der Walt: contributed to the study design, study supervision, data generation, and drafting and writing of the report.
Mr Bukartyk: contributed to the study design, data generation, and drafting and writing of the report.
Ms Davison: contributed to the study design, study supervision, and drafting and writing of the report.
Dr Levine: contributed to the study design, data interpretation, and drafting and writing of the report.
Dr Somers: contributed to the study design, study supervision, data generation and interpretation, and drafting and writing of the report.
Financial/nonfinancial disclosures: The authors have reported to CHEST the following conflicts of interest: Dr Somers is supported by NIH [Grant HL65176, UL1 RR024150, HL96071, HL114024, and HL114676] and the Mayo Foundation. Dr Somers has served as a consultant for ResMed; Respicardia; NeuPro; Apnex Medical, Inc; Medtronic; Deshum Medical; and Sova Pharmaceuticals. He has served as a PI or coinvestigator on grants from Philips Respironics Foundation and the NIH and works with Mayo Health Solutions on intellectual property related to sleep and to obesity. Drs Calvin, Carter, Adachi, Macedo, Albuquerque, and Levine, Mss van der Walt and Davison, and Mr Bukartyk have reported that no potential conflicts of interest exist with any companies/organizations whose products or services may be discussed in this article.
Role of sponsors: The sponsors had no role in the design of the study, the collection and analysis of the data, or the preparation of the manuscript. Its contents are solely the responsibility of the authors and do not necessarily represent the official view of the NCRR or NIH.
Other contributions: This work was performed at Mayo Clinic, Rochester, Minnesota.
Abbreviations
- PAMS
physical activity monitoring system
- PSG
polysomnogram
Footnotes
Funding/Support: This work was supported by the Mayo Foundation and the Mayo Clinic Clinician-Investigator Training Program (to Dr Calvin); the National Heart Lung and Blood Institute [Grant 096071]; the National Institutes of Health (NIH) [Grant R201 HL096071 and R01 HL114024]; and the National Center for Research Resources (NCRR) [Grant 1ULI RR024150], a component of the NIH and the NIH Roadmap for Medical Research. These studies were also supported by grants from the Czech Ministry of Health [NS 10098-4/2008] and by European Regional Development Fund - Project FNUSA-ICRC [CZ.1.05/1.1.00/02.0123].
Reproduction of this article is prohibited without written permission from the American College of Chest Physicians. See online for more details.
References
- 1.Flegal KM, Carroll MD, Ogden CL, Curtin LR. Prevalence and trends in obesity among US adults, 1999-2008. JAMA. 2010;303(3):235-241 [DOI] [PubMed] [Google Scholar]
- 2.Mokdad AH, Marks JS, Stroup DF, Gerberding JL. Actual causes of death in the United States, 2000. JAMA. 2004;291(10):1238-1245 [DOI] [PubMed] [Google Scholar]
- 3.Koh HK. A 2020 vision for healthy people. N Engl J Med. 2010;362(18):1653-1656 [DOI] [PubMed] [Google Scholar]
- 4.Glickman D, Parker L, Sim L, Del Valle Cook H, Miller EA, eds. Accelerating Progress in Obesity Prevention: Solving the Weight of the Nation. Washington, DC: The National Academies Press; 2012 [PubMed] [Google Scholar]
- 5.Cappuccio FP, Taggart FM, Kandala NB, et al. Meta-analysis of short sleep duration and obesity in children and adults. Sleep. 2008;31(5):619-626 [DOI] [PMC free article] [PubMed] [Google Scholar]
- 6.Hasler G, Buysse DJ, Klaghofer R, et al. The association between short sleep duration and obesity in young adults: a 13-year prospective study. Sleep. 2004;27(4):661-666 [DOI] [PubMed] [Google Scholar]
- 7.Heslop P, Smith GD, Metcalfe C, Macleod J, Hart C. Sleep duration and mortality: The effect of short or long sleep duration on cardiovascular and all-cause mortality in working men and women. Sleep Med. 2002;3(4):305-314 [DOI] [PubMed] [Google Scholar]
- 8.Kripke DF, Garfinkel L, Wingard DL, Klauber MR, Marler MR. Mortality associated with sleep duration and insomnia. Arch Gen Psychiatry. 2002;59(2):131-136 [DOI] [PubMed] [Google Scholar]
- 9.Locard E, Mamelle N, Billette A, Miginiac M, Munoz F, Rey S. Risk factors of obesity in a five year old population. Parental versus environmental factors. Int J Obes Relat Metab Disord. 1992;16(10):721-729 [PubMed] [Google Scholar]
- 10.Vioque J, Torres A, Quiles J. Time spent watching television, sleep duration and obesity in adults living in Valencia, Spain. Int J Obes Relat Metab Disord. 2000;24(12):1683-1688 [DOI] [PubMed] [Google Scholar]
- 11.von Kries R, Toschke AM, Wurmser H, Sauerwald T, Koletzko B. Reduced risk for overweight and obesity in 5- and 6-y-old children by duration of sleep—a cross-sectional study. Int J Obes Relat Metab Disord. 2002;26(5):710-716 [DOI] [PubMed] [Google Scholar]
- 12.Hsieh SD, Muto T, Murase T, Tsuji H, Arase Y. Association of short sleep duration with obesity, diabetes, fatty liver and behavioral factors in Japanese men. Intern Med. 2011;50(21):2499-2502 [DOI] [PubMed] [Google Scholar]
- 13.Patel SR, Hu FB. Short sleep duration and weight gain: a systematic review. Obesity (Silver Spring). 2008;16(3):643-653 [DOI] [PMC free article] [PubMed] [Google Scholar]
- 14.Magee L, Hale L. Longitudinal associations between sleep duration and subsequent weight gain: a systematic review. Sleep Med Rev. 2012;16(3):231-241 [DOI] [PMC free article] [PubMed] [Google Scholar]
- 15.Gangwisch JE, Heymsfield SB, Boden-Albala B, et al. Short sleep duration as a risk factor for hypertension: analyses of the first National Health and Nutrition Examination Survey. Hypertension. 2006;47(5):833-839 [DOI] [PubMed] [Google Scholar]
- 16.Bin YS, Marshall NS, Glozier N. Secular trends in adult sleep duration: a systematic review. Sleep Med Rev. 2012;16(3):223-230 [DOI] [PubMed] [Google Scholar]
- 17.Kripke DF, Simons RN, Garfinkel L, Hammond EC. Short and long sleep and sleeping pills. Is increased mortality associated? Arch Gen Psychiatry. 1979;36(1):103-116 [DOI] [PubMed] [Google Scholar]
- 18.National Center for Chronic Disease Prevention and Health Promotion Insufficient Sleep Is a Public Health Epidemic. Atlanta, GA: National Center for Chronic Disease Prevention and Health Promotion, Division of Adult and Community Health;2011. http://www.cdc.gov/features/dssleep/. Updated March 17, 2011. Accessed March 1, 2013 [Google Scholar]
- 19.Schmid SM, Hallschmid M, Jauch-Chara K, Born J, Schultes B. A single night of sleep deprivation increases ghrelin levels and feelings of hunger in normal-weight healthy men. J Sleep Res. 2008;17(3):331-334 [DOI] [PubMed] [Google Scholar]
- 20.Spiegel K, Tasali E, Penev P, Van Cauter E. Brief communication: Sleep curtailment in healthy young men is associated with decreased leptin levels, elevated ghrelin levels, and increased hunger and appetite. Ann Intern Med. 2004;141(11):846-850 [DOI] [PubMed] [Google Scholar]
- 21.Spiegel K, Leproult R, L’hermite-Balériaux M, Copinschi G, Penev PD, Van Cauter E. Leptin levels are dependent on sleep duration: relationships with sympathovagal balance, carbohydrate regulation, cortisol, and thyrotropin. J Clin Endocrinol Metab. 2004;89(11):5762-5771 [DOI] [PubMed] [Google Scholar]
- 22.Buxton OM, Cain SW, O’Connor SP, et al. Adverse metabolic consequences in humans of prolonged sleep restriction combined with circadian disruption. Sci Transl Med. 2012;4(129):129ra143. [DOI] [PMC free article] [PubMed] [Google Scholar]
- 23.Brondel L, Romer MA, Nougues PM, Touyarou P, Davenne D. Acute partial sleep deprivation increases food intake in healthy men. Am J Clin Nutr. 2010;91(6):1550-1559 [DOI] [PubMed] [Google Scholar]
- 24.St-Onge M-P, McReynolds A, Trivedi ZB, Roberts AL, Sy M, Hirsch J. Sleep restriction leads to increased activation of brain regions sensitive to food stimuli. Am J Clin Nutr. 2012;95(4):818-824 [DOI] [PMC free article] [PubMed] [Google Scholar]
- 25.White DP, Weil JV, Zwillich CW. Metabolic rate and breathing during sleep. J Appl Physiol. 1985;59(2):384-391 [DOI] [PubMed] [Google Scholar]
- 26.Benedict C, Hallschmid M, Lassen A, et al. Acute sleep deprivation reduces energy expenditure in healthy men. Am J Clin Nutr. 2011;93(6):1229-1236 [DOI] [PubMed] [Google Scholar]
- 27.Jung CM, Melanson EL, Frydendall EJ, Perreault L, Eckel RH, Wright KP. Energy expenditure during sleep, sleep deprivation and sleep following sleep deprivation in adult humans. J Physiol. 2011;589(Pt 1):235-244 [DOI] [PMC free article] [PubMed] [Google Scholar]
- 28.Nedeltcheva AV, Kilkus JM, Imperial J, Kasza K, Schoeller DA, Penev PD. Sleep curtailment is accompanied by increased intake of calories from snacks. Am J Clin Nutr. 2009;89(1):126-133 [DOI] [PMC free article] [PubMed] [Google Scholar]
- 29.Taheri S, Mignot E. Sleep well and stay slim: dream or reality? Ann Intern Med. 2010;153(7):475-476 [DOI] [PubMed] [Google Scholar]
- 30.Ayas NT. If you weigh too much, maybe you should try sleeping more. Sleep. 2010;33(2):143-144 [DOI] [PMC free article] [PubMed] [Google Scholar]
- 31.Cizza G, Marincola P, Mattingly M, et al. Treatment of obesity with extension of sleep duration: a randomized, prospective, controlled trial. Clin Trials. 2010;7(3):274-285 [DOI] [PMC free article] [PubMed] [Google Scholar]
- 32.Caples SM, Rosen CL, Shen WK, et al. The scoring of cardiac events during sleep. J Clin Sleep Med. 2007;3(2):147-154 [PubMed] [Google Scholar]
- 33.Levine J, Melanson EL, Westerterp KR, Hill JO. Measurement of the components of nonexercise activity thermogenesis. Am J Physiol Endocrinol Metab. 2001;281(4):E670-E675 [DOI] [PubMed] [Google Scholar]
- 34.Levine J, Melanson EL, Westerterp KR, Hill JO. Tracmor system for measuring walking energy expenditure. Eur J Clin Nutr. 2003;57(9):1176-1180 [DOI] [PubMed] [Google Scholar]
- 35.Levine JA, Baukol PA, Westerterp KR. Validation of the Tracmor triaxial accelerometer system for walking. Med Sci Sports Exerc. 2001;33(9):1593-1597 [DOI] [PubMed] [Google Scholar]
- 36.Levine JA, Eberhardt NL, Jensen MD. Role of nonexercise activity thermogenesis in resistance to fat gain in humans. Science. 1999;283(5399):212-214 [DOI] [PubMed] [Google Scholar]
- 37.Levine JA, Lanningham-Foster LM, McCrady SK, et al. Interindividual variation in posture allocation: possible role in human obesity. Science. 2005;307(5709):584-586 [DOI] [PubMed] [Google Scholar]
- 38.Knutson KL, Galli G, Zhao X, Mattingly M, Cizza G; NIDDK Sleep Extension Study No association between leptin levels and sleep duration or quality in obese adults. Obesity (Silver Spring). 2011;19(12):2433-2435 [DOI] [PMC free article] [PubMed] [Google Scholar]
- 39.Omisade A, Buxton OM, Rusak B. Impact of acute sleep restriction on cortisol and leptin levels in young women. Physiol Behav. 2010;99(5):651-656 [DOI] [PubMed] [Google Scholar]
- 40.Benedict C, Brooks SJ, O’Daly OG, et al. Acute sleep deprivation enhances the brain’s response to hedonic food stimuli: an fMRI study. J Clin Endocrinol Metab. 2012;97(3):E443-E447 [DOI] [PubMed] [Google Scholar]
- 41.Chaput JP, Després JP, Bouchard C, Tremblay A. The association between short sleep duration and weight gain is dependent on disinhibited eating behavior in adults. Sleep. 2011;34(10):1291-1297 [DOI] [PMC free article] [PubMed] [Google Scholar]
- 42.Centers for Disease Control and Prevention (CDC) Unhealthy sleep-related behaviors-12 states, 2009. MMWR Morb Mortal Wkly Rep. 2011;60(8):233-238 [PubMed] [Google Scholar]
- 43. National Sleep Foundation. 2011 Sleep in America poll: communications technology and sleep. http:www.sleepfoundation.org/2011poll. Published March 7, 2011. Accessed March 1, 2013.
- 44.Drake CL, Roehrs T, Richardson G, Walsh JK, Roth T. Shift work sleep disorder: prevalence and consequences beyond that of symptomatic day workers. Sleep. 2004;27(8):1453-1462 [DOI] [PubMed] [Google Scholar]
- 45.Meier-Ewert HK, Ridker PM, Rifai N, et al. Effect of sleep loss on C-reactive protein, an inflammatory marker of cardiovascular risk. J Am Coll Cardiol. 2004;43(4):678-683 [DOI] [PubMed] [Google Scholar]
- 46.Leproult R, Van Cauter E. Role of sleep and sleep loss in hormonal release and metabolism. Endocr Dev. 2010;17:11-21 [DOI] [PMC free article] [PubMed] [Google Scholar]