Abstract
Background
Overfeeding amino acids (AAs) increases cellular exposure to advanced glycation end-products (AGEs), a mechanism for protein intake to worsen diabetic kidney disease (DKD). This study assessed receptor for AGE (RAGE)-mediated apoptosis and inflammation in glomerular cells exposed to metabolic stressors characteristic of high-protein diets and/or diabetes in vitro with proof-of-concept appraisal in vivo.
Methods
Mouse podocytes and mesangial cells were cultured under control and metabolic stressor conditions: (i) no addition; (ii) increased AAs (4–6-fold >control); (iii) high glucose (HG, 30.5 mM); (iv) AA/HG combination; (v) AGE-bovine serum albumin (AGE-BSA, 300 µg/mL); (vi) BSA (300 µg/mL). RAGE was inhibited by blocking antibody. Diabetic (streptozotocin) and nondiabetic mice (C57BL/6J) consumed diets with protein calories of 20 or 40% (high) for 20 weeks. People with DKD and controls provided 24-h urine samples.
Results
In podocytes and mesangial cells, apoptosis (caspase 3/7 activity and TUNEL) increased in all metabolic stressor conditions. Both inflammatory mediator expression (real-time reverse transcriptase–polymerase chain reaction: serum amyloid A, caspase-4, inducible nitric oxide synthase, and monocyte chemotactic protein-1) and RAGE (immunostaining) also increased. RAGE inhibition prevented apoptosis and inflammation in podocytes. Among mice fed high protein, podocyte number (WT-1 immunostaining) decreased in the diabetic group, and only these diabetic mice developed albuminuria. Protein intake (urea nitrogen) correlated with AGE excretion (carboxymethyllysine) in people with DKD and controls.
Conclusions
High-protein diet and/or diabetes-like conditions increased glomerular cell death and inflammation, responses mediated by RAGEs in podocytes. The concept that high-protein diets exacerbate early indicators of DKD is supported by data from mice and people.
Keywords: apoptosis, high-protein diet, mesangial cells, podocytes, receptor for advanced glycation end-products
INTRODUCTION
Diabetic kidney disease (DKD) is the leading cause of chronic kidney disease in the developed world [1, 2]. Lifestyle factors greatly contribute to the development of diabetes and its complications. High-protein diets provoke mechanisms of DKD progression, including glomerular hyperfiltration and hypertension, with the activation of the renin–angiotensin system [3, 4]. More recently, dietary protein has been recognized as an abundant source of advanced glycation end-products (AGEs). Nonenzymatic reactions of free amino groups with ketones or aldehydes on sugars produce reactive intermediates that subsequently rearrange to form irreversible AGE-modified proteins [5]. Direct oxidation of amino acids (AAs) can generate reactive intermediates leading to endogenously produced AGEs [6]. Eating preformed AGEs in foods, especially derived from proteins browned at high heat, are an exogenous source of AGEs. As such, the AGE pool increases either through the diet or via hyperglycemia. AGEs also accrue when excretion is reduced by impaired kidney function [7–10]. The kidney itself bears a brunt of AGE exposure. In the glomerulus, AGEs cross-link proteins and impair protein degradation leading to basement membrane thickening and mesangial expansion [11].
Notably, a proinflammatory receptor for AGE (RAGE) is present on glomerular cells [11]. RAGE activates signals culminating in cellular inflammation and death [12–14]. However, dietary effects on RAGE activation and resulting cellular responses have been previously unexplored. Candidate inflammatory mediators include novel and conventional cytokines. Among the novel, serum amyloid A (SAA) is a RAGE ligand implicated in inflammatory aspects of atherosclerosis [15–17]. Additionally, caspase-4, a member of Group 1 caspases, stimulates inflammation and apoptosis [18]. Conventional cytokines, such as inducible nitric oxide synthase (iNOS) and monocyte chemotactic protein-1 (MCP-1), have been implicated in inflammation of the diabetic kidney [12, 19]. The hypothesis for this study was that overfeeding AAs in a manner akin to high-protein diet, with or without hyperglycemia, increases AGE exposure and RAGE activation. The study aims were: (i) to assess RAGE-mediated apoptosis and inflammatory responses in vitro in glomerular cells exposed to conditions mimicking high-protein diet and/or diabetes and (ii) to evaluate cellular findings for translational proof-of-concept in vivo in mice and people.
MATERIALS AND METHODS
Cell studies
Cell culture
Mouse podocytes (Dr Stuart Shankland, University of Washington, Seattle) are conditionally immortalized [20]. Podocytes were grown on collagen I (BD Biosciences, www.bdbiosciences.com) coated Primaria plates (VWR, www.vwrsp.com) in RPMI 1640 medium (Sigma Chemical Co., www.sigmaaldrich.com) containing 10% heat-inactivated fetal bovine serum (FBS, HyClone, Thermo Fisher, www.hyclone.com) and interferon-γ (50 µg/mL) at 33°C. Cell differentiation was promoted by incubation at 37°C without interferon-γ for 10–12 days.
Mouse mesangial cells (MES-13) were obtained from American Type Culture Collection (www.atcc.org) and grown at 37°C in Dulbecco's Modified Eagle Medium (Gibco Life Technologies, www.lifetechnologies.com) supplemented with penicillin–streptomycin (100 units/mL) and 10% heat-inactivated FBS.
Experimental conditions
Metabolic stressors included: (i) C: control (no addition), glucose 5.5 mM; (ii) AA: mixed AA solution and l-arginine (Baxter, www.baxter.com) added to achieve levels 4–6-fold >control; (iii) high glucose (HG), glucose 30.5 mM; (iv) AA/HG: combination of AA and HG; (v) AGE-BSA, 300 µg/mL; (vi) BSA, 300 µg/mL. Media was changed to 0.5% FBS 1 day prior to the experimental conditions. To make AGE-BSA, fatty acid-free fraction IV BSA (Sigma) was incubated with 0.5 M glucose for 45 days at 37°C. The resulting AGE-BSA solution was dialyzed with phosphate-buffered saline (PBS, pH 7.4) and sterile filtered [21]. Endotoxin was undetectable (E-TOXATE, Sigma). For RAGE inhibition studies, an anti-RAGE antibody, or control goat serum (1:100, Millipore, www.millipore.com), was added to media before addition to the cells. A time course study assessed glucose levels in normoglycemic media. Baseline media glucose concentrations (n = 4 per group) were 5.7 ± 0.0, 5.69 ± 0.04 and 5.69 ± 0.04 mM for C, AA and AGE conditions, respectively. In conditioned media from podocytes at 48 h, glucose levels were 5.22 ± 0.08, 5.30 ± 0.06 and 4.87 ± 0.15 (P < 0.002 versus baseline). In conditioned media from mesangial cells at 48 h, glucose levels were 3.91 ± 0.10, 4.16 ± 0.14 and 3.91 ± 0.03 (P < 0.001 versus baseline).
Apoptosis measurements
In podocytes and mesangial cells, caspase 3/7 activity was measured using the SensoLyte® Homogeneous AFC Caspase-3/7 Assay Kit (Anaspec Corp., www.anaspec.com). Fluorescence was measured by plate reader (Biotek, www.biotek.com). For the TUNEL assay, cells were grown on glass coverslips and stained with the DEAD-END kit (Promega, www.promega.com). Nuclei were stained with Hoechst 33342 dye. A fluorescent microscope (Olympus America, Inc., www.olympusamerica.com) and camera (Olympus DC-70 CCD) were used for visualization. Images were analyzed by Microsuite Biological Suite Imaging Software 5.0 (Soft Imaging System Co., www.olympus-sis.com). For each condition, two coverslips were photographed to quantify >500 cells in 5 separate experiments.
mRNA measurements by real-time PCR
RAGE, SAA3, iNOS, MCP-1 and caspase-4 were assessed by mRNA expression. Total RNA was isolated from podocytes and mesangial cells using the RiboPure kit (Ambion, www.lifetechnologies.com) and quantified using the Quant-iT™ RiboGreen® RNA Reagent and Kit (Invitrogen, www.lifetechnologies.com). Equal amounts of RNA were DNAse treated using amplification grade DNase I (Invitrogen). cDNA was synthesized using Superscript III (Invitrogen). Real-time reverse transcriptase–polymerase chain reaction (RT–PCR) was performed on an Applied Biosystems 7900HT Fast RT–PCR System (www.lifetechnologies.com) using SA Biosciences Sybr-Green reagent (Qiagen, www.qiagen.com). Results were quantified with SDS v2.4 software (Applied Biosystems) and normalized to mouse TATA-box binding protein. Gene-specific primers were designed by the OligoPerfect™ Designer program (Invitrogen).
CML ELISA assay
After media was collected, protease inhibitors were added to prepare for the direct enzyme-linked immunosorbent assay (ELISA) measurement of carboxymethyllysine (CML) using affinity-purified rabbit antibodies to CML and a CML–BSA standard [22].
Immunocytochemistry
Podocytes and mesangial cells grown on glass cover slips were fixed in 100% methanol, hydrated in PBS, blocked (Tris-buffered saline, 0.3% Tween-20 [TBST] and 1% BSA) and incubated overnight with rabbit anti-CML (6.0 μg/mL) or anti-RAGE antibodies (2 µg/mL, Santa Cruz Biotechnology, www.scbt.com). After washing, they were incubated with goat anti-rabbit IgG conjugated with Oregon Green 488 (Invitrogen). Fluorescence microscopy and digital imaging were performed as described for the TUNEL assay. Antibody reactivity measurements were deemed specific based on absorption with RNase A-CML or RAGE peptide (Santa Cruz Biotechnology).
Mouse studies
Induction of diabetes, care and monitoring
The experimental protocol was approved by the Animal Care Committee at the University of Washington. Male C57BL/6J mice, 6 weeks of age, were purchased from The Jackson Laboratories (www.jax.org) and maintained in a pathogen-free facility with a 12-h light cycle and free access to diet and water. Mice were made diabetic by five daily injections of streptozotocin (STZ, 40 mg/kg) beginning at 8 weeks of age (n = 20 per group). Control mice received five daily injections of citrate buffer. During the 20-week study, blood glucose and spot urine collections were made every other week. Body weight was determined weekly. Blood glucose was maintained at 300–400 mg/dL by daily insulin administration. If mice had glucose levels of 350–500 mg/dL, they received 5–9 units of regular insulin. If glucose levels were >500 mg/dL, mice received 10 units of regular insulin. Blood pressure was measured once at 16 weeks.
Study diets
One week following STZ or citrate injections, mice were started on study diets (Harlan Teklad, www.harlan.com) with protein calories of 20% (standard) or 40% (high). Caloric intake of carbohydrates was 62 and 42%, respectively. The study diets had an equal content of fat and total calories. Mice had free access to food except when blood glucose was measured after a 4-h fast.
Biochemical and physical assessments
Blood samples were obtained by tail vein puncture for glucose measurements (One-Touch Glucometer® Lifescan, www.lifescan.com). At weeks 16, 18 and 20, urine was collected during the evening dark cycle to quantify albumin (Albuwell M Murine ELISA kit Exocell, www.exocell.com) and creatinine (Creatinine Companion kit Exocell) excretion. Blood pressure was measured by the Coda-6 VPR tail-cuff system (Kent Scientific, www.kentscientific.com) [23].
Kidney histology and podocyte counts
Kidneys were obtained at the end of the study after perfusion with PBS supplemented with 100 µM diethylenetriamine pentacetic acid and 100 µM butylated hydroxytoluene (Sigma). Kidneys were immersion-fixed in 10% neutral-buffered formalin, embedded in paraffin and sectioned for staining with silver methenamine, periodic acid-Schiff, hematoxylin and eosin.
Podocyte were counted on 3-µm sections of formalin-fixed tissue immunostained with WT-1 (Santa Cruz Biotechnology), a podocyte marker. Glomerular sections (n = 50) were photographed and imported into Microsuite Biological Suite Imaging Software 5.0 (Soft Imaging System) for morphometric analyses. The podocyte number was determined by the stereologic method of Weibel [24] based on evaluating the density of WT-1-positive podocytes and glomerular volume. The number of WT-1-positive nuclei per glomerulus was multiplied by glomerular volume to derive the podocyte number [25–27].
Human studies
Urine samples (n = 32) from a study that assessed the effect of angiotensin-receptor blockade on AGE production in people with DKD (n = 11), those with uncomplicated diabetes (n = 10), and healthy controls (n = 11) were evaluated to examine relationships between dietary protein and AGE excretion [28]. Study participants with DKD had overt nephropathy defined by total protein excretion >500 mg/day. Samples for the present analyses were from 24-h collections obtained at baseline (before administration of study medicine, candesartan). Urine was stored at −70°C until thawed in the presence of protease inhibitors. For the estimation of protein intake, urinary urea was measured on an Abbott Architecture 8200 auto analyzer. Protein intake was calculated by the Maroni equation. [29]. Urinary CML was measured by competitive ELISA. Urine (50 µL) was combined with anti-CML antibody (50 µL, diluted 1:1000) and incubated overnight at 4°C. The reaction was add to a 96-well plate (Rainin Instruments, www.mt.com) coated with CML-BSA (100 ng/100 µL). After incubation and washing, anti-rabbit biotin-conjugated antibody (Sigma) and peroxidase-conjugated streptavidin (www.rockland-inc.com) were sequentially added. The absorbance of washed plates was measured by plate reader (Sunrise plate reader, Tecan, www.tecan.com).
Statistical analysis
Data were expressed as mean ± SD. Two-way repeated-measures analysis of variance assessed differences in outcome measurements between groups and treatments. Statistical significance was set at two-tailed probabilities <5% (P < 0.05). SPSS (www.spss.com) version 17 software was used for statistics.
RESULTS
Podocyte studies
Apoptosis
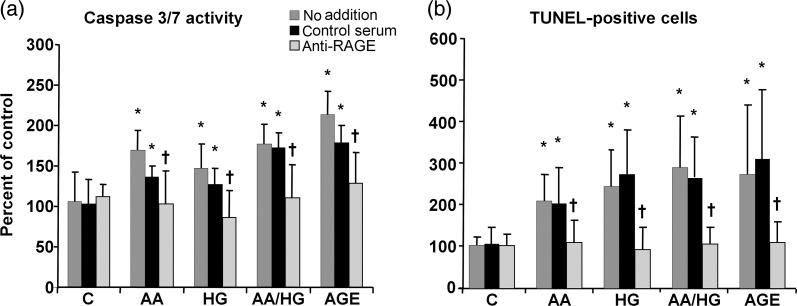
Caspase 3/7 activity, an indicator of early-phase apoptosis, was increased by all metabolic stressor conditions (AA, HG, AA/HG and AGE). Inhibition of RAGE inhibited caspase 3/7 activity in podocytes exposed to each condition (Figure 1). Similarly, TUNEL staining, the indicator of late-phase apoptosis was increased after exposure to the same conditions. Treatment of podocytes with the anti-RAGE antibody reduced the number of TUNEL-positive podocytes (Figure 1).
FIGURE 1:
Podocyte apoptosis in metabolic stressor conditions with inhibition by antibody to RAGE. Cells were exposed to conditions with and without the anti-RAGE antibody or control serum. (a) An early-phase marker, caspase 3/7 activity, was measured after 1 day. (b) A later-phase marker, TUNEL staining, was performed after 2 days. Data are expressed as the mean ± SD, *P < 0.05 versus control, †P < 0.05 versus control serum, n = 9–10. Metabolic stressor conditions included: (i) C: control (no addition), glucose 5.5 mM; (ii) AA: increased amino acids, levels 4–6-fold >control; (iii) HG: high glucose, glucose 30.5 mM; (iv) AA/HG: combination of AA and HG; (v) AGE-bovine serum albumin (AGE-BSA, 300 µg/mL).
RAGE expression and AGE production
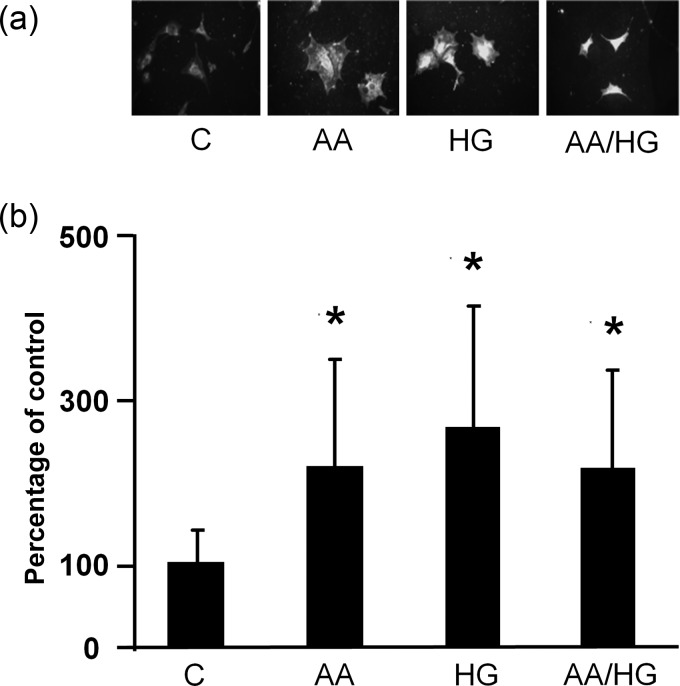
Immunostaining revealed increased RAGE in podocytes exposed to AA, HG, AA/HG and AGE for 2 days (Figure 2). On the other hand, RAGE mRNA expression did not increase after the periods of exposure to metabolic stressors from 2 to 7 days (data not shown). Immunostaining for AGE (CML) increased in podocytes exposed to AA, HG and AA/HG (Figure 3a). CML in conditioned media also increased, but this occurrence was later than the cellular appearance of CML (Figure 3b).
FIGURE 2:

RAGE expression on podocytes exposed to metabolic stressors. Cells were exposed to conditions for 2 days, and RAGE was detected by immunostaining (original magnification, ×200). Metabolic stressor conditions included: (i) C: control (no addition), glucose 5.5 mM; (ii) AA: increased amino acids, levels 4–6-fold >control; (iii) HG: high glucose, glucose 30.5 mM; (iv) AA/HG: combination of AA and HG; (v) AGE-bovine serum albumin (AGE-BSA, 300 µg/mL).
FIGURE 3:
Effect of high levels of AAs and glucose on AGE production in podocytes. CML was detected by (a) immunostaining of podocytes after 2 days (original magnification, ×400) and (b) ELISA of culture media after 7 days. Data are presented as mean ± SD, *P < 0.05 versus control, n = 11. Conditions included: (i) C: control (no addition), glucose 5.5 mM; (ii) AA: increased amino acids, levels 4–6-fold >control; (iii) HG: high glucose, glucose 30.5 mM; (iv) AA/HG: combination of AA and HG.
Inflammatory mediators
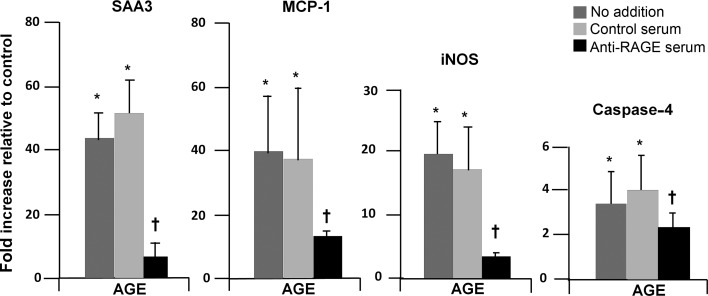
A time course study (6 h–7 days) of AGE-induced expression of mRNA for inflammatory mediators was performed (data not shown). As a result, 1 day of exposure was determined to be optimal. Anti-RAGE antibody almost fully inhibited mRNA expression of SAA and iNOS, while reduction of MCP-1 and caspase-4 was approximately half (Figure 4). The other conditions (AA, HG and AA/HG) did not consistently induce mRNA expression of SAA3, iNOS, MCP-1 or caspase-4 over a time course ranging from 1 to 7 days (data not shown). Therefore, inhibition studies with the anti-RAGE antibody were only performed for the AGE condition.
FIGURE 4:
SAA and other inflammatory mediators expressed in podocytes exposed to AGE and inhibition by antibody to RAGE. Cells were exposed to (i) control and (ii) AGE-bovine serum albumin (AGE-BSA, 300 µg/mL), with and without the anti-RAGE antibody or control serum for 1 day. Expression of mRNA was determined by real-time RT–PCR and displayed relative to control (no addition). Data are expressed as mean ± SD. *P < 0.05 versus control (no addition), †P < 0.05 versus AGE with control serum. n = 5–6.
Mesangial cell studies
Apoptosis
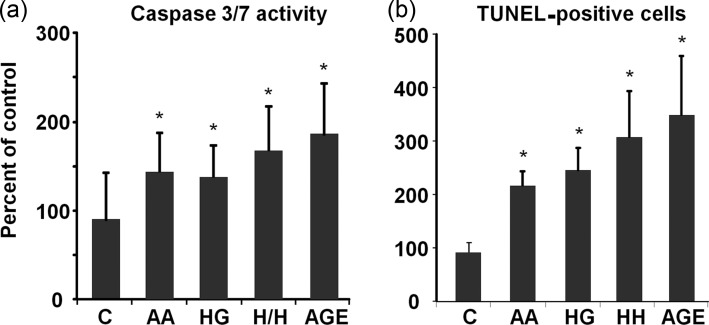
Both caspase 3/7 activity and TUNEL staining increased in mesangial cells exposed to AA, HG, AA/HG and AGE (Figure 5). However, anti-RAGE antibody did not reduce caspase 3/7 activity or TUNEL staining in response to any condition (data not shown).
FIGURE 5:
Mesangial cell apoptosis in metabolic stressor conditions. (a) Caspase 3/7 activity was measured after 1 day (n = 12) and (b) TUNEL staining after 2 days (n = 6) of exposure to metabolic stressor conditions. Data are expressed as mean ± SD, *P < 0.05 versus control. Metabolic stressor conditions included: (i) C: control (no addition), glucose 5.5 mM; (ii) AA: increased amino acids, levels 4–6-fold >control; (iii) HG: high glucose, glucose 30.5 mM; (iv) AA/HG: combination of AA and HG; (v) AGE-bovine serum albumin (AGE-BSA, 300 µg/mL).
RAGE expression
Immunostaining for RAGE increased in mesangial cells exposed to AA, HG, AA/HG and AGE (Figure 6), but corresponding mRNA expression did not increase (data not shown).
FIGURE 6:

RAGE expression in mesangial cells exposed to metabolic stressors. Cells were exposed to metabolic stressor conditions for 2 days, and RAGE was detected by immunostaining (original magnification, ×200). Metabolic stressor conditions included: (i) C: control (no addition), glucose 5.5 mM; (ii) AA: increased amino acids, levels 4–6-fold >control; (iii) HG: high glucose, glucose 30.5 mM; (iv) AA/HG: combination of AA and HG; (v) AGE-bovine serum albumin (AGE-BSA, 300 µg/mL).
Inflammatory mediators
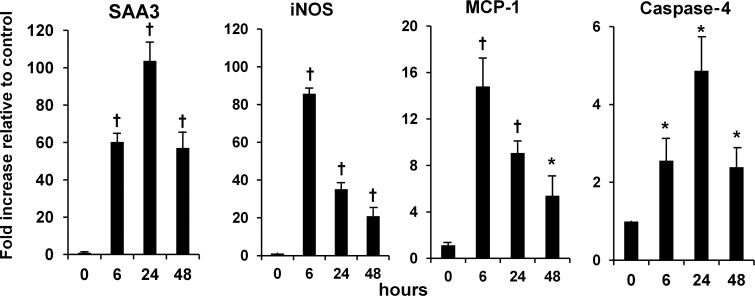
A time course of mRNA expression for AGE-induced inflammatory mediators revealed that SAA3, MCP-1, iNOS and caspase-4 peaked within the first day of exposure (Figure 7). AGE-induced mRNA expression for inflammatory mediators was not inhibited by the anti-RAGE antibody (data not shown). The other conditions (AA, HG and AA/HG) did not consistently induce mRNA expression of SAA3, iNOS, MCP-1 or caspase-4 for up to a 3-day period (data not shown). Therefore, inhibition studies with the anti-RAGE antibody were not performed.
FIGURE 7:
Time course of SAA and other inflammatory mediators in mesangial cells stimulated with AGE. Cells were exposed to (i) control (no addition) and (ii) AGE (AGE-BSA, 300 µg/mL). Expression of mRNA was determined by real-time RT–PCR and displayed relative to control (n = 3). Data are expressed as mean ± SD, *P < 0.05 versus control, †P < 0.01 versus control.
Mouse study
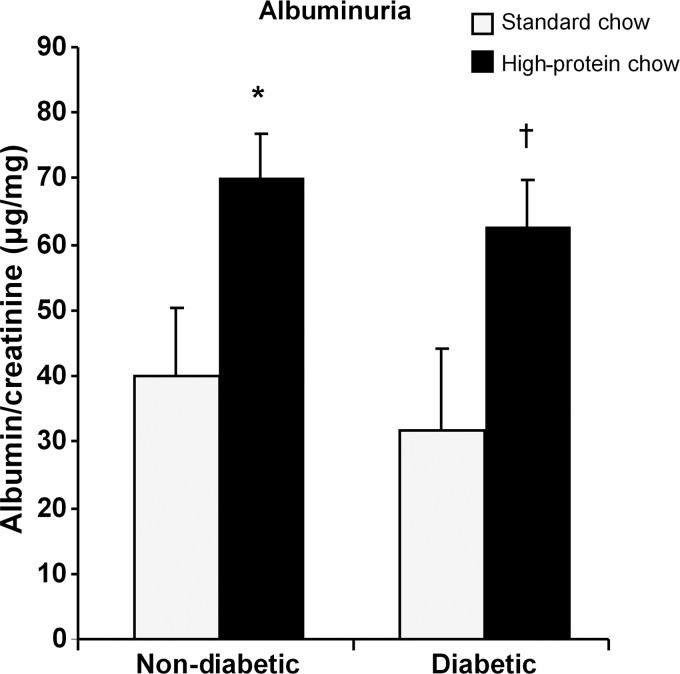
Diabetic mice in both standard and high-protein diet groups for 20 weeks had elevated blood glucose levels and lower body weight compared with their respective control groups of nondiabetic mice (Table 1). Diabetic mice fed a high-protein diet exhibited higher blood pressure compared with nondiabetic mice also on the high-protein diet. Kidney hypertrophy was significantly greater in diabetic mice fed the high-protein diet compared with those fed the standard diet (Table 1). In this model, diabetic mice fed a standard diet did not develop increased levels of albuminuria, whereas those on the high-protein diet had twice as much albumin excretion. In nondiabetic mice, only the group fed the high-protein diet developed increased levels of albuminuria (Figure 8).
Table 1.
Biochemical and physical properties
| Glucose (mg/dL) |
Body weight (g) |
Kidney/body (mg/g) | Blood pressure (mmHg) systolic/diastolic | |||
|---|---|---|---|---|---|---|
| Baseline | Week 20 | Baseline | Week 20 | Week 20 | Week 20 | |
| Controls | ||||||
| Standard chow | 180 ± 27 | 167 ± 23 | 19.3 ± 1.4 | 29.6 ± 2.6 | 6.17 ± 0.60 | 139 ± 27/107 ± 23 |
| High-protein chow | 215 ± 19 | 172 ± 23 | 19.6 ± 0.7 | 30.2 ± 1.9 | 6.26 ± 0.69 | 123 ± 14/102 ± 14 |
| Diabetic | ||||||
| Standard chow | 187 ± 31 | 435 ± 131* | 21.0 ± 1.0 | 25.6 ± 2.4* | 8.43 ± 1.84* | 146 ± 16/116 ± 16 |
| High-protein chow | 204 ± 31 | 497 ± 88.0* | 20.0 ± 0.9 | 24.3 ± 1.9* | 10.32 ± 1.36*,** | 152 ± 18***/123 ± 18*** |
*P < 0.001 compared with control in each diet group.
**P = 0.021 kidney/body weight compared with diabetic standard chow.
***P = 0.005 blood pressure compared with control on high-protein chow.
FIGURE 8:
Urine albumin was increased in both nondiabetic and diabetic mice fed the high-protein chow (n = 9, nondiabetic mice/standard chow; n = 10, nondiabetic mice/high-protein chow; n = 12 diabetic mice/standard chow and n = 19, diabetic mice/high-protein chow). Data are expressed as mean ± SD, *P = 0.009 versus nondiabetic mice fed a standard chow, †P = 0.005 versus diabetic mice fed the standard chow.
Histological examination of kidneys revealed modest abnormalities, as expected for this model which is not ‘DKD prone’ [30]. Nevertheless, the model is useful for understanding early changes that may initiate disease. As such, podocyte loss, an early structural manifestation underlying albuminuria, was assessed by immunostaining for the podocyte marker WT-1. The reduced podocyte number was only detected in diabetic mice fed the high-protein diet (Figure 9).
FIGURE 9:
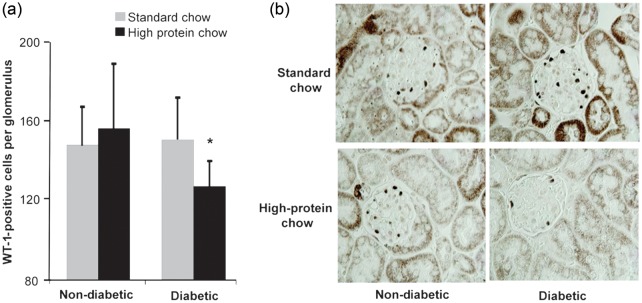
(a) Podocyte number in glomeruli of nondiabetic and diabetic mice fed normal or high-protein diet for 20 weeks (n = 10). Data are expressed as mean ± SD; *P = 0.007 compared with a diabetic standard chow. (b) Representative photomicrograph of WT-1 staining in mouse kidneys (original magnification ×1000).
Diabetic mice exhibited increased mRNA for RAGE in the kidney cortex compared with nondiabetic mice (3584 ± 879 versus 2598 ± 607 molecules/ng RNA, P < 0.001). The group fed the high-protein diet had a larger increment in RAGE expression (43%) compared with those fed standard chow (30%), but this numerical difference missed statistical significance. CML was elevated in the kidney cortex of diabetic mice (8.27 ± 1.57 versus 6.68 ± 1.14 µg/g, P = 0.020), but did not differ by diet groups.
Human study
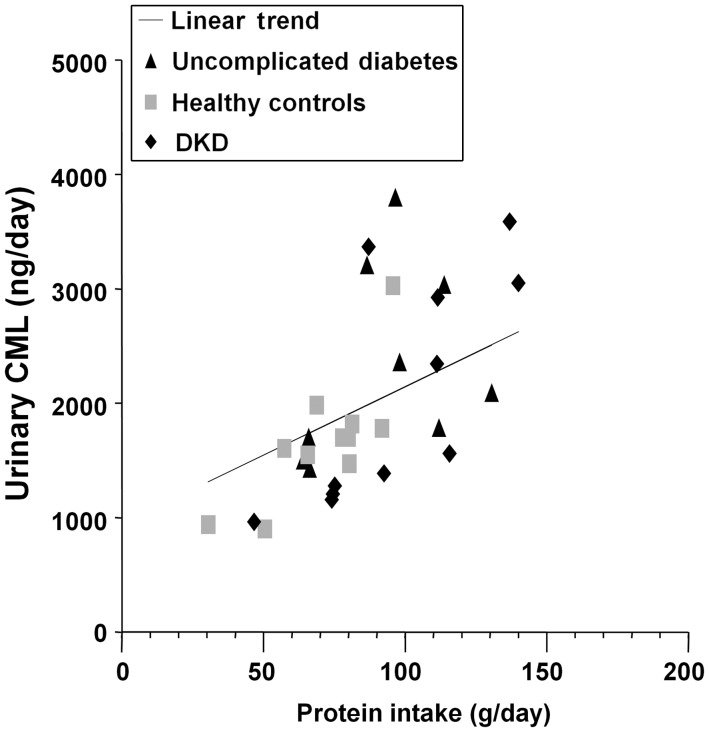
Urinary albumin excretion was 2996 ± 2702 mg/day (mean ± SD) in participants with DKD, 43 ± 33 mg/day in those with uncomplicated diabetes and 11 ± 5 mg/day in healthy controls [25]. Estimated GFR (serum creatinine based on the modification of diet in renal disease equation in mL/min/1.73 m2) levels were 61 ± 21, 74 ± 16 and 86 ± 18 in the groups, respectively. Creatinine clearance from the 24-h urine collection (mL/min) measurements were 85 ± 27, 134 ± 49 and 123 ± 29, respectively. Urinary excretion of CML increased directly with dietary protein intake as assessed by urinary urea nitrogen excretion in groups of people with DKD or uncomplicated diabetes and healthy controls (Figure 10).
FIGURE 10:
Dietary protein intake (urea nitrogen excretion) and urinary excretion of an AGE (CML and ELISA) were correlated in study participants as a whole (r = 0.66, P < 0.001) and within each group (uncomplicated diabetes r = 0.74, P = 0.009; healthy controls r = 0.62, P = 0.056; DKD r = 0.77, P = 0.006, respectively).
DISCUSSION
In glomerular cells central to DKD, a high-protein diet-like condition induced apoptosis and inflammation in both diabetic and nondiabetic states. RAGE appears to be a key mediator of these responses in podocytes. A high-protein diet also reduced the podocyte number in diabetic mice, and only these diabetic mice developed albuminuria. In humans, protein intake directly correlated with urinary AGE excretion in diabetic and nondiabetic people alike.
A novel finding was that culture of podocytes with high AA levels increased RAGE and AGE to the same extent as a HG level. Mesangial cells are known to produce AGE in response to AAs [31, 32]. Importantly, the corresponding data from podocytes and evidence for increased RAGE in both cell types after exposure to the high levels of AAs are new observations. Collectively, these data indicate that, in the states of metabolic stress, including high-protein diet, the AGE–RAGE system can be stimulated in glomerular cells. Although we did not detect an effect of high-protein diet in mice to increase RAGE mRNA expression in the whole kidney, this does not exclude the possibility of increased cell-specific expression or regulation of the receptor's protein translation or surface translocation. Additionally, people who ate larger amounts of protein had greater urinary AGE excretion, putatively reflecting increased exposure of the kidney to AGE. In sum, these data show that the high-protein diet can lead to greater amounts of RAGE and AGE in the kidney.
Podocyte loss occurs early in DKD and is associated with the onset of albuminuria [33–36]. In the present study, only the high-protein diet increased albuminuria and podocyte loss in diabetic mice. Although we did not observe increased albuminuria or podocyte loss in diabetic mice on a normal diet, such changes could occur with greater hyperglycemia, longer duration of diabetes or enhanced DKD susceptibility [35]. Of note, blood pressure increased in diabetic mice fed the high-protein diet, which may have contributed to albuminuria. This observation is clinically relevant because we recently reported that dietary protein associated with blood pressure in people [37]. Moreover, this effect was explained by AA composition with plant-like distributions favoring lower blood pressure and animal-like distributions favoring higher blood pressure. Interestingly, nondiabetic mice developed albuminuria on the high-protein diet without podocyte loss, suggesting that albuminuria reflects nonstructural mechanisms such as glomerular hypertension or decreased tubular reabsorption. Overall, the present data indicate that the high-protein diet incites podocyte loss and albuminuria in diabetic mice. If these findings translate to people, then the high-protein diet may be a lifestyle factor promoting DKD onset and hypertension.
In parallel to the structural changes in mouse kidneys, high levels of AAs and/or glucose caused apoptosis of glomerular cells in culture. The degree of apoptosis was similar to that observed with exposure to exogenous AGE, supporting the notion of an AGE pathway for cellular responses to states of metabolic stress. Moreover, RAGE appears responsible for podocyte death because apoptosis was fully inhibited by blockade with the anti-RAGE antibody. Interestingly, podocytes exposed to HG increase p27Kip expression, leading to cell cycle arrest and apoptosis [38]. Exposure to exogenous AGE also stimulates p27Kip1 expression with similar consequences [39]. If these AGE effects are RAGE-dependent, then p27Kip could be a downstream mechanism for high-protein diet and/or hyperglycemia to cause podocyte death. In contrast, RAGE inhibition did not block apoptosis of mesangial cells. Therefore, cells other than podocytes appear to have non-RAGE-related mechanisms, leading to death in response to AGE or related metabolic stressors.
High levels of AGE incited inflammatory responses from podocytes and mesangial cells represented by increased mRNA expression of novel (SAA and caspase-4) and conventional (MCP-1 and iNOS) cytokines. To our knowledge, these are the first data demonstrating increased expression of SAA and caspase-4 in glomerular cells. SAA is derived from a family of conserved genes of which isoforms 1–3 are acute phase reactants [40, 41]. These isoforms bind cell surface receptors to activate inflammation in a similar manner. Circulating SAA is mostly produced in the liver, but local production has been detected. In humans and mice, SAA is present in the kidney, particularly proximal tubules [41, 42]. Caspase-4 is unique in that it promotes apoptosis and inflammation [18]. Therefore, it is a strong candidate to link metabolic stress with glomerular injury and warrants further study. MCP-1 and iNOS have been implicated in rodent models of DKD. MCP-1 induces monocyte infiltration to glomerular and tubulo-interstitial compartments, whereas iNOS promotes tubulo-interstitial inflammation and apoptosis [43–47]. Thus, the present data illustrate that both novel and conventional cytokines induce glomerular cell inflammation and apoptosis in response to metabolic stress.
Importantly, SAA is a RAGE ligand, providing opportunity for autocrine receptor activation. RAGE inhibition ameliorated inflammatory cytokine induction in podocytes exposed to AGE. In particular, SAA expression was blocked, consistent with an autocrine pathway for RAGE binding and activation. There is precedent for proposing autocrine activation of RAGE. For example, endothelial cells cultured with the HG level increased the expression of various RAGE ligands (calgranulins, S100A8 and S100A12, and high mobility group box) [48]. Contrary to the present data in podocytes, RAGE inhibition did not block proinflammatory responses of mesangial cells, suggesting the possibility of alternate receptor pathways such as scavenger receptor-B1 or CD-36 [49, 50].
This study has noteworthy limitations. First, studies of isolated cell in culture may not faithfully reflect in vivo responses to metabolic stress. For example, the lack of detectable inflammatory responses of glomerular cells to AAs and/or glucose may be due to considerably lower levels of endogenous AGE (formed during the experiment) in these conditions compared with exogenous AGE (added to the cell culture media). Indeed, the CML level in conditioned media from podocytes in the AA/HG group was markedly lower than in the group exposed to AGE preformed in the media (0.0004 versus 300 μg/mL) after 2 days. A downward drift was detected in the glucose levels of conditioned media for normoglycemic groups (AA, HG and AGE), presumably reflecting cellular utilization. However, levels were not in an overtly hypoglycemic range, and cells cultured in control conditions did not display evidence of stress marked by death or inflammatory responses. Regardless, cellular studies provide insights into specific mechanisms and variations by cell type. For example, apoptotic and inflammatory responses were RAGE-dependent in podocytes, but not in mesangial cells. Secondly, the mouse study was an early proof-of-concept appraisal in a non-DKD prone model [30]. Therefore, the present findings may or may not translate to models more closely approximating human DKD. Yet, these data provide insights into early changes that may lead to kidney damage later. Finally, the human component was an exploratory post hoc analysis of samples obtained from a clinical study [28]. Taken together, the association of dietary protein intake with urinary AGE excretion supports key concepts from the experimental studies.
In conclusion, metabolic stressors designed to mimic high-protein diet, with or without diabetes, increased glomerular cell exposure to AGE along with death and inflammation. In podocytes, these responses were mediated by RAGEs. Notably, increased expression of SAA, a proinflammatory protein and RAGE ligand, suggests the possibility of a unique autocrine loop for podocyte death and inflammatory responses. Emerging evidence from mice and people supports the concept that higher protein intake may exacerbate early changes characteristic of DKD.
CONFLICT OF INTEREST STATEMENT
None declared.
ACKNOWLEDGEMENTS
The work was supported by Providence Sacred Heart Medical Center and Children's Hospital, Providence Sacred Heart Medical Center and Children's Hospital Foundation, the National Institutes of Health (grant DK83391 to C.E.A.) and National Institutes of Health (grant U24 DK076126 to the Seattle Mouse Metabolic Phenotyping Center).
REFERENCES
- 1.National Kidney Foundation-Kidney Disease Outcomes Quality Initiative (NKF-KDOQI) Clinical practice guidelines and clinical practice recommendations for diabetes and chronic kidney disease. Am J Kidney Dis. 2007;49:S1–S179. doi: 10.1053/j.ajkd.2006.12.005. [DOI] [PubMed] [Google Scholar]
- 2.United States Renal Data System UADR. Bethesda, MD: National Institutes of Health, National Institute of Diabetes, Digestive, and Kidney Diseases; 2011. Atlas of Chronic Kidney Disease and End-Stage Renal Disease in the United States. [Google Scholar]
- 3.Hostetter TH, Meyer TW, Rennke HG, et al. Chronic effects of dietary protein in the rat with intact and reduced renal mass. Kidney Int. 1986;30:509–517. doi: 10.1038/ki.1986.215. [DOI] [PubMed] [Google Scholar]
- 4.Zatz R, Meyer TW, Rennke HG, et al. Predominance of hemodynamic rather than metabolic factors in the pathogenesis of diabetic glomerulopathy. Proc Natl Acad Sci USA. 1985;82:5963–5967. doi: 10.1073/pnas.82.17.5963. [DOI] [PMC free article] [PubMed] [Google Scholar]
- 5.Uribarri J, Tuttle KR. Advanced glycation end products and nephrotoxicity of high-protein diets. Clin J Am Soc Nephrol. 2006;1:1293–1299. doi: 10.2215/CJN.01270406. [DOI] [PubMed] [Google Scholar]
- 6.Sourris KC, Forbes JM. Interactions between advanced glycation end-products (AGE) and their receptors in the development and progression of diabetic nephropathy—are these receptors valid therapeutic targets. Curr Drug Targets. 2009;10:42–50. doi: 10.2174/138945009787122905. [DOI] [PubMed] [Google Scholar]
- 7.Hofmann SM, Dong HJ, Li Z, et al. Improved insulin sensitivity is associated with restricted intake of dietary glycoxidation products in the db/db mouse. Diabetes. 2002;51:2082–2089. doi: 10.2337/diabetes.51.7.2082. [DOI] [PubMed] [Google Scholar]
- 8.Zheng F, He C, Cai W, et al. Prevention of diabetic nephropathy in mice by a diet low in glycoxidation products. Diabetes Metab Res Rev. 2002;18:224–237. doi: 10.1002/dmrr.283. [DOI] [PubMed] [Google Scholar]
- 9.Stenvinkel P, Carrero JJ, Axelsson J, et al. Emerging biomarkers for evaluating cardiovascular risk in the chronic kidney disease patient: how do new pieces fit into the uremic puzzle? Clin J Am Soc Nephrol. 2008;3:505–521. doi: 10.2215/CJN.03670807. [DOI] [PMC free article] [PubMed] [Google Scholar]
- 10.Semba RD, Ferrucci L, Fink JC, et al. Advanced glycation end products and their circulating receptors and level of kidney function in older community-dwelling women. Am J Kidney Dis. 2009;53:51–58. doi: 10.1053/j.ajkd.2008.06.018. [DOI] [PMC free article] [PubMed] [Google Scholar]
- 11.Yamagishi S, Matsui T. Advanced glycation end products, oxidative stress and diabetic nephropathy. Oxid Med Cell Longev. 2010;3:101–108. doi: 10.4161/oxim.3.2.4. [DOI] [PMC free article] [PubMed] [Google Scholar]
- 12.Banba N, Nakamura T, Matsumura M, et al. Possible relationship of monocyte chemoattractant protein-1 with diabetic nephropathy. Kidney Int. 2000;58:684–690. doi: 10.1046/j.1523-1755.2000.00214.x. [DOI] [PubMed] [Google Scholar]
- 13.Bierhaus A, Schiekofer S, Schwaninger M, et al. Diabetes-associated sustained activation of the transcription factor nuclear factor-kappaB. Diabetes. 2001;50:2792–2808. doi: 10.2337/diabetes.50.12.2792. [DOI] [PubMed] [Google Scholar]
- 14.Zhou LL, Cao W, Xie C, et al. The receptor of advanced glycation end products plays a central role in advanced oxidation protein products-induced podocyte apoptosis. Kidney Int. 2012;82:759–770. doi: 10.1038/ki.2012.184. [DOI] [PubMed] [Google Scholar]
- 15.Dong Z, Wu T, Qin W, et al. Serum amyloid a directly accelerates the progression of atherosclerosis in apolipoprotein E-deficient mice. Mol Med. 2011;17:1357–1364. doi: 10.2119/molmed.2011.00186. [DOI] [PMC free article] [PubMed] [Google Scholar]
- 16.Filep JG, El Kebir D. Serum amyloid A as a marker and mediator of acute coronary syndromes. Future Cardiol. 2008;4:495–504. doi: 10.2217/14796678.4.5.495. [DOI] [PubMed] [Google Scholar]
- 17.King VL, Thompson J, Tannock LR. Serum amyloid A in atherosclerosis. Curr Opin Lipidol. 2011;22:302–307. doi: 10.1097/MOL.0b013e3283488c39. [DOI] [PubMed] [Google Scholar]
- 18.Martinon F, Tschopp J. Inflammatory caspases and inflammasomes: master switches of inflammation. Cell Death Differ. 2007;14:10–22. doi: 10.1038/sj.cdd.4402038. [DOI] [PubMed] [Google Scholar]
- 19.Chow FY, Nikolic-Paterson DJ, Ozols E, et al. Monocyte chemoattractant protein-1 promotes the development of diabetic renal injury in streptozotocin-treated mice. Kidney Int. 2006;69:73–80. doi: 10.1038/sj.ki.5000014. [DOI] [PubMed] [Google Scholar]
- 20.Wada T, Pippin JW, Terada Y, et al. The cyclin-dependent kinase inhibitor p21 is required for TGF-beta1-induced podocyte apoptosis. Kidney Int. 2005;68:1618–1629. doi: 10.1111/j.1523-1755.2005.00574.x. [DOI] [PubMed] [Google Scholar]
- 21.Makita Z, Radoff S, Rayfield EJ, et al. Advanced glycosylation end products in patients with diabetic nephropathy. N Engl J Med. 1991;325:836–842. doi: 10.1056/NEJM199109193251202. [DOI] [PubMed] [Google Scholar]
- 22.Coughlan MT, Thallas-Bonke V, Pete J, et al. Combination therapy with the advanced glycation end product cross-link breaker, alagebrium, and angiotensin converting enzyme inhibitors in diabetes: synergy or redundancy? Endocrinology. 2007;148:886–895. doi: 10.1210/en.2006-1300. [DOI] [PubMed] [Google Scholar]
- 23.Guo S, Kowalewska J, Wietecha TA, et al. Renin-angiotensin system blockade is renoprotective in immune complex-mediated glomerulonephritis. J Am Soc Nephrol. 2008;19:1168–1176. doi: 10.1681/ASN.2007050607. [DOI] [PMC free article] [PubMed] [Google Scholar]
- 24.Weibel ER. Practical Methods for Biological Morphometry. London: Academic Press,; 1979. pp. 40–116. [Google Scholar]
- 25.Pagtalunan ME, Miller PL, Jumping-Eagle S, et al. Podocyte loss and progressive glomerular injury in type II diabetes. J Clin Invest. 1997;99:342–348. doi: 10.1172/JCI119163. [DOI] [PMC free article] [PubMed] [Google Scholar]
- 26.Steffes MW, Schmidt D, McCrery R, et al. Glomerular cell number in normal subjects and in type 1 diabetic patients. Kidney Int. 2001;59:2104–2113. doi: 10.1046/j.1523-1755.2001.00725.x. [DOI] [PubMed] [Google Scholar]
- 27.Macconi D, Bonomelli M, Benigni A, et al. Pathophysiologic implications of reduced podocyte number in a rat model of progressive glomerular injury. Am J Pathol. 2006;168:42–54. doi: 10.2353/ajpath.2006.050398. [DOI] [PMC free article] [PubMed] [Google Scholar]
- 28.Saha SA, LaSalle BK, Clifton GD, et al. Modulation of advanced glycation end products by candesartan in patients with diabetic kidney disease–a dose-response relationship study. Am J Ther. 2010;17:553–558. doi: 10.1097/MJT.0b013e3181b96c27. [DOI] [PubMed] [Google Scholar]
- 29.Maroni BJ, Steinman TI, Mitch WE. A method for estimating nitrogen intake of patients with chronic renal failure. Kidney Int. 1985;27:58–65. doi: 10.1038/ki.1985.10. [DOI] [PubMed] [Google Scholar]
- 30.Brosius FC, Alpers CE, Bottinger EP, et al. Mouse models of diabetic nephropathy. J Am Soc Nephrol. 2009;20:2503–2512. doi: 10.1681/ASN.2009070721. [DOI] [PMC free article] [PubMed] [Google Scholar]
- 31.Tuttle KR, Anderberg RJ, Cooney SK, et al. Oxidative stress mediates protein kinase C activation and advanced glycation end product formation in a mesangial cell model of diabetes and high protein diet. Am J Nephrol. 2009;29:171–180. doi: 10.1159/000154470. [DOI] [PubMed] [Google Scholar]
- 32.Tuttle KR, Johnson EC, Cooney SK, et al. Amino acids injure mesangial cells by advanced glycation end products, oxidative stress, and protein kinase C. Kidney Int. 2005;67:953–968. doi: 10.1111/j.1523-1755.2005.00159.x. [DOI] [PubMed] [Google Scholar]
- 33.Herman-Edelstein M, Thomas MC, Thallas-Bonke V, et al. Dedifferentiation of immortalized human podocytes in response to transforming growth factor-beta: a model for diabetic podocytopathy. Diabetes. 2011;60:1779–1788. doi: 10.2337/db10-1110. [DOI] [PMC free article] [PubMed] [Google Scholar]
- 34.Li JJ, Kwak SJ, Jung DS, et al. Podocyte biology in diabetic nephropathy. Kidney Int Suppl. 2007;72:S36–S42. doi: 10.1038/sj.ki.5002384. [DOI] [PubMed] [Google Scholar]
- 35.Susztak K, Raff AC, Schiffer M, et al. Glucose-induced reactive oxygen species cause apoptosis of podocytes and podocyte depletion at the onset of diabetic nephropathy. Diabetes. 2006;55:225–233. [PubMed] [Google Scholar]
- 36.Wolf G, Ziyadeh FN. Cellular and molecular mechanisms of proteinuria in diabetic nephropathy. Nephron Physiol. 2007;106:26–31. doi: 10.1159/000101797. [DOI] [PubMed] [Google Scholar]
- 37.Tuttle KR, Milton JE, Packard DP, et al. Dietary amino acids and blood pressure: a cohort study of patients with cardiovascular disease. Am J Kidney Dis. 2012;59:803–809. doi: 10.1053/j.ajkd.2011.12.026. [DOI] [PubMed] [Google Scholar]
- 38.Xu ZG, Yoo TH, Ryu DR, et al. Angiotensin II receptor blocker inhibits p27Kip1 expression in glucose-stimulated podocytes and in diabetic glomeruli. Kidney Int. 2005;67:944–952. doi: 10.1111/j.1523-1755.2005.00158.x. [DOI] [PubMed] [Google Scholar]
- 39.Rüster C, Bondeva T, Franke S, et al. Advanced glycation end-products induce cell cycle arrest and hypertrophy in podocytes. Nephrol Dial Transplant. 2008;23:2179–2191. doi: 10.1093/ndt/gfn085. [DOI] [PubMed] [Google Scholar]
- 40.Meek RL, Benditt EP. Amyloid A gene family expression in different mouse tissues. J Exp Med. 1986;164:2006–2017. doi: 10.1084/jem.164.6.2006. [DOI] [PMC free article] [PubMed] [Google Scholar]
- 41.Upragarin N, Landman WJ, Gaastra W, et al. Extrahepatic production of acute phase serum amyloid A. Histol Histopathol. 2005;20:1295–1307. doi: 10.14670/HH-20.1295. [DOI] [PubMed] [Google Scholar]
- 42.Urieli-Shoval S, Cohen P, Eisenberg S, et al. Widespread expression of serum amyloid A in histologically normal human tissues. Predominant localization to the epithelium. J Histochem Cytochem. 1998;46:1377–1384. doi: 10.1177/002215549804601206. [DOI] [PubMed] [Google Scholar]
- 43.Komers R, Anderson S. Paradoxes of nitric oxide in the diabetic kidney. Am J Physiol Renal Physiol. 2003;284:F1121–F1137. doi: 10.1152/ajprenal.00265.2002. [DOI] [PubMed] [Google Scholar]
- 44.Brune B, Sandau K, von Knethen A. Apoptotic cell death and nitric oxide: activating and antagonistic transducing pathways. Biochemistry (Mosc) 1998;63:817–825. [PubMed] [Google Scholar]
- 45.Chung HT, Pae HO, Choi BM, et al. Nitric oxide as a bioregulator of apoptosis. Biochem Biophys Res Commun. 2001;282:1075–1079. doi: 10.1006/bbrc.2001.4670. [DOI] [PubMed] [Google Scholar]
- 46.Sugimoto H, Shikata K, Wada J, et al. Advanced glycation end products-cytokine-nitric oxide sequence pathway in the development of diabetic nephropathy: aminoguanidine ameliorates the overexpression of tumour necrosis factor-alpha and inducible nitric oxide synthase in diabetic rat glomeruli. Diabetologia. 1999;42:878–886. doi: 10.1007/s001250051241. [DOI] [PubMed] [Google Scholar]
- 47.Bremer V, Tojo A, Kimura K, et al. Role of nitric oxide in rat nephrotoxic nephritis: comparison between inducible and constitutive nitric oxide synthase. J Am Soc Nephrol. 1997;8:1712–1721. doi: 10.1681/ASN.V8111712. [DOI] [PubMed] [Google Scholar]
- 48.Yao D, Brownlee M. Hyperglycemia-induced reactive oxygen species increase expression of the receptor for advanced glycation end products (RAGE) and RAGE ligands. Diabetes. 2010;59:249–255. doi: 10.2337/db09-0801. [DOI] [PMC free article] [PubMed] [Google Scholar]
- 49.Mullan RH, McCormick J, Connolly M, et al. A role for the high-density lipoprotein receptor SR-B1 in synovial inflammation via serum amyloid-A. Am J Pathol. 2010;176:1999–2008. doi: 10.2353/ajpath.2010.090014. [DOI] [PMC free article] [PubMed] [Google Scholar]
- 50.Okamura DM, Pennathur S, Pasichnyk K, et al. CD36 regulates oxidative stress and inflammation in hypercholesterolemic CKD. J Am Soc Nephrol. 2009;20:495–505. doi: 10.1681/ASN.2008010009. [DOI] [PMC free article] [PubMed] [Google Scholar]


