

Abstract
Glucocorticoids exert rapid nongenomic effects by several mechanisms including the activation of a membrane-bound glucocorticoid receptor (mGR). Here, we report the first proteomic study on the effects of mGR activation by BSA-conjugated cortisol (Cort-BSA). A subset of target proteins in the proteomic data set was validated by Western blot and we found them responding to mGR activation by BSA-conjugated cortisol in three additional cell lines, indicating a conserved effect in cells originating from different tissues. Changes in the proteome of BSA-conjugated cortisol treated CCRF-CEM leukemia cells were associated with early and rapid pro-apoptotic, immune-modulatory and metabolic effects aligning with and possibly “priming” classical activities of the cytosolic glucocorticoid receptor (cGR). PCR arrays investigating target genes of the major signaling pathways indicated that the mGR does not exert its effects through the transcriptional activity of any of the most common kinases in these leukemic cells, but RhoA signaling emerged from our pathway analysis. All cell lines tested displayed very low levels of mGR on their surface. Highly sensitive and specific in situ proximity ligation assay visualized low numbers of mGR even in cells previously thought to be mGR negative. We obtained similar results when using three distinct anti-GR monoclonal antibodies directed against the N-terminal half of the cGR. This strongly suggests that the mGR and the cGR have a high sequence homology and most probably originate from the same gene. Furthermore, the mGR appears to reside in caveolae and its association with caveolin-1 (Cav-1) was clearly detected in two of the four cell lines investigated using double recognition proximity ligation assay. Our results indicate however that Cav-1 is not necessary for membrane localization of the GR since CCRF-CEM and Jurkat cells have a functional mGR, but did not express this caveolar protein. However, if expressed, this membrane protein dimerizes with the mGR modulating its function.
Classically, glucocorticoids (GCs)1 exert their immunomodulatory effect by activating the cytosolic glucocorticoid receptor (cGR), which translocates to the nucleus and regulates gene expression (1). However, there is increasing evidence of GCs effects on a large number of tissues and organs, which are independent of transcriptional changes and occur rapidly, within minutes or seconds of exposure to GCs (2–4). One of the mechanisms proposed for these rapid nongenomic GC-effects is the activation of a membrane-bound GR (mGR).
The existence of a glucocorticoid receptor (GR) in plasma membrane was first reported in a mouse lymphoma cell line (S-49) and it was proposed to be functionally associated with glucocorticoid-induced cell death (5). Subsequently, a corticosterone binding protein was identified in synapses of amphibian brain, with characteristics similar to G-protein coupled receptors (6–9). The existence of such a receptor was also reported in a mouse pituitary cell line (22), suggesting that a second gene is involved in the expression of this GC-binding proteins at least in the central nervous system. However, in rats a GR immunoreactive protein was detected on the plasma membrane of liver cells (10), of hippocampal and hypothalamic neurons (11), and of neuronal and glial cells in the lateral amygdala. These data support the hypothesis that the mGR originate from the NR3C1 gene, as the cytosolic receptor (12).
The origin and the function of this GR isoform were further investigated in the S-49 mouse T-lymphoma cell line (13–18). The presence of the mGR appeared to be linked to the expression of exon 1A-containing GR transcripts and the production of a high molecular weight (150 kDa) GR immuno-reactive protein. The mammalian mGR was proposed to be a variant of the classical cytosolic GR. It is now accepted that the mGR is a product of the NR3C1 gene, as is the classical cytosolic GR. First, antibodies raised and directed against the cGR epitopes are able to specifically detect a membrane-bound form (19, 20) and additionally, a recent report demonstrated that stable silencing of the classical GR gene is able to down-regulate mGR expression (21). However the over-expression of the classical GR transcript did not lead to an increased level of mGR (22), suggesting that the membrane isoform is not simply an unmodified GR localized on the cell surface.
The number of mGR molecules per cell is particularly low. In CCRF-CEM cells, a human T-cell lymphoblast-like cell line the detection was possible only after enrichment of mGR+ cells using immunopanning methods (19, 24, 25). To date liposome-based fluorescence amplification techniques have been used (26), allowing the detection of as few as 50 receptor molecules per cell. By applying this method, Bartholome et al. confirmed the presence of the mGR on CCRF-CEM cells and demonstrated that the mGR is physiologically present in monocytes and B-cells from healthy donors, while circulating T-lymphocytes were consistently negative (22).
The proportion of mGR positive monocytes was proposed to be linked to the activity of the immune system. The frequency of CD14+/mGR+ cells was increased in patients with systemic lupus erythematosus (SLE) (27). It positively correlated with parameters of disease activity in patients with rheumatoid arthritis (22) and was slightly induced after vaccination (28). In addition the number of mGR positive monocytes dramatically increased on lipopolysaccharides (LPS) stimulation (22), whereas decreasing in a dose-dependent manner on GC treatment in SLE patients (27). On the other hand, the proportion of mGR positive B-cells was stable and not affected by any of these factors. The regulation of the mGR expression by lipopolysaccharides and GCs was dependent on a functional secretory pathway (22) and required both transcription and translation (27).
To date a clear mechanism by which the GR is targeted to the membrane has not been defined. However, the GR has been found in association with Cav-1 in membrane lipid rafts (29–31) and Cav-1 was shown to facilitate the membrane translocation of the estrogen receptor (ER) (32), suggesting a similar role for the mGR. Caveolae are important for signal transduction of many receptors (33) and the localization of the GR in these lipid rafts suggests that the membrane-bound form exerts its function through a mechanism distinct from its cytosolic counterpart. For example, GC stimulation of a lung cell line led to the activation of protein kinase B (PKB) in a Caveolin-dependent mechanism (30). Similarly the presence of Cav-1 and G-protein was required for membrane estrogen receptor (34) and membrane androgen receptor activation (35), suggesting that Cav-1 and probably the associated lipid rafts, may play a role in steroid membrane signaling.
Previous studies have reported several signal transduction pathways activated on short GC-stimulation (4, 36), but only a few of the rapid CG-effects have been shown to be selectively triggered by the mGR. However, bovine serum albumin conjugated GCs (GC-BSA) have been successfully used to discriminate the specific activities of the mGR from those of the cytosolic GR (21). Here, we present the first proteomic study of the effects of the mGR selectively activated by BSA-conjugated cortisol in a human lymphoma cell line. The dissection of mGR specific functions identified effects on the proteome that aligned with classical GC-activities. In CCRF-CEM cells, Cort-BSA activated RhoA signaling and no other signal transduction pathway was identified. We visualized the mGR and its association with Cav-1 using the highly sensitive in situ Proximity Ligation Assay (PLA) (37). This membrane protein seems to modulate Cort-BSA effects, but is not necessary for activity.
EXPERIMENTAL PROCEDURES
Cell Culture
CCRF-CEM and Jurkat cells (human T-cell lymphoblast-like cell lines) were cultured in RPMI 1640 medium (Lonza, Basel, Switzerland) supplemented with 10% fetal bovine serum (FBS, Lonza) and 2 mm Ultraglutamine (Lonza). MCF-7 cells (human breast adenocarcinoma cell line) were grown in RPMI 1640 medium supplemented with 10% FBS, 1% MEM nonessential amino acids (Invitrogen, Merelbeke, Belgium), and 1% sodium pyruvate (Lonza). U2-OS cells (human osteosarcoma cell line) were grown in McCoy's 5A medium (Lonza) supplemented with 10% FBS and 1.5 mm Ultraglutamine. Cells were maintained in a humidified atmosphere at 37 °C containing 5% CO2.
Two-Dimensional Differential Gel Electrophoresis (2D-DIGE)
2D-DIGE experiments and all cell fractionations were performed on biological triplicate samples as previously described in (38–40) with minor modifications. Cytosolic and nuclear fractions were fluorescence-labeled as follows: BSA negative control and 5 min Cort-BSA by Cy5 dye, 15 min and 90 min Cort-BSA by Cy3. A total of three analytical gels were performed for each of the following comparisons: CYTO neg versus CYTO 15 min; CYTO 5 min versus CYTO 90 min; NUCL neg versus NUCL 15 min; and NUCL 5 min versus 90 min. In each analytical gel a common Cy2-labeled control, obtained by pooling all the samples in equal proportion, was loaded and used as internal standard. To account for variations between the labeling, the dyes were swapped in one of the three replicates (supplemental Fig. S1). All gels with the cytosolic fractions were performed in a single electrophoretic run, and all nuclear fractions were performed in a second run. Preparative gels were supplemented with 200 μg of unlabeled protein. Before iso-electrofocusing, dithiotreitol (DTT) concentration of each sample was adjusted to 10 mm (Sigma-Aldrich, Bornem, Belgium) and 2% IPG rehydration buffer (GE Healthcare, Diegem, Belgium) was added in a 1:1 (v/v) ratio. The volume was adjusted with 1% IPG rehydration buffer to 450 μl and samples were loaded by rehydration on 24 cm ImmobilineTM DryStrips with a nonlinear pH 3–10 range (GE Healthcare) for 20 h at room temperature in the dark using the ImmobilineTM DryStrip Reswelling Tray (GE Healthcare). Iso-electrofocusing was performed in an Ettan IPGphor II unit (GE Healthcare) under the following running conditions: 40 V for 2 h, 70 V for 2 h, 300 V for 2 h, 1 kV for 4 h, 8 kV for 4 h, and 8 kV for 9 h (50 μA/Strip). Second dimension protein separation was performed on 2D DALT NF 12.5% precast polyacrylamide gels (Gel Company, Tübingen, Germany) according to the manufacturer's recommendations. The gels were run at 1 W for 2 h followed by 5 W for 16 h at 25 °C and scanned on a Typhoon Scanner at 100 μm using a photomultiplier tube (PMT) voltage of 520 V and the following excitation/emission wavelengths: Cy2 488 nm/520 nm (band pass 40 nm); Cy3 532 nm/580 nm (band pass 30 nm); Cy5 633 nm/670 nm (band pass 30 nm). Subsequently preparative gels were stained using LavaPurpleTM (Gel Company) according to the manufacture's recommendations and scanned on a Typhoon Scanner at 100 μm resolution and a PMT voltage of 400 V using excitation/emission wavelengths of 532 nm/560 nm low pass.
Gel Analysis
Gel images were imported into the Delta2D V4.1.1 software (Decodon, Greifswald, Germany). Replicates were grouped and gel images aligned using a group warping strategy. Spot detection was performed on a fusion image consisting of an overlay of all gel pictures. The different time points (5, 15, and 90 min) of both the cytosolic fraction and nuclear fraction were compared with the control gel (0 min). Differences in the intensity of each spot were tested with a two-sided Student's t test and p < 0.05 was considered significant without correction for multiple testing.
Protein Identification
Protein spot picking, digestion, and identification was performed at the Proteomics Platform of the CRP Gabriel Lippmann in Luxembourg. Spot handling and digestion was performed on an Ettan Spot Handling Work station (GE Healthcare). Spots of 2 mm in diameter were picked and washed twice in 100 μl 50 mm ammonium bicarbonate (Sigma-Aldrich)/50% methanol (Biosolve, Valkenswaard, Nederland) for 20 min and 30 min respectively at room temperature, dehydrated in 2 steps of 30 min in 80 μl 75% ACN (Biosolve) at room temperature and dried at 40 °C for 20 min. Gel spot rehydration and protein digestion was performed in 8 μl of 20 mm ammonium bicarbonate supplemented with 5 ng/μl trypsin (Promega, Mannheim, Germany) for 6 h at 37 °C. Peptides were extracted from the picked gel plugs with 50% ACN/0.1% TFA (Sigma-Aldrich) and dried for 20 min at 37 °C. Peptides were redissolved in 3 μl of 50% acetonitrile (ACN)/0.1% trifluoroacetic acid (TFA) and 0.7 μl were spotted on the 384 target (Bruker, Bremen, Germany) and mixed with 0.7 μl of a matrix containing 7 mg/ml α-cyano-4-hydrocinnamic acid (Bruker)/50% ACN/0.1% TFA. Peptides were then analyzed on a 4800 MALDI-TOF/TOF (Invitrogen) mass spectrometer. MS and MS/MS were calibrated using trypsin fragments (1798.857, 1940.95, 2211.105Da) and the 4700 calibration mix (Applied Biosystems), respectively. For MS analysis, the mass range was set from 800–4000 Da and a minimal signal/noise ratio to 10. A peak density filter of 50 peaks/200 Da and a maximum of 65 peaks were used for identification. Trypsin fragments (842.4, 1940.92, 2211.10, 2233.16, 1045.55, 2299.18, 1707.77, 1944.92, and 2011.98) were excluded. For MS/MS analysis, the mass range was chosen 20–60 Da below the respective precursor mass. The other parameters were identical to MS analysis. GPS explorer V3.6 (Applied Biosystems) was used for peak picking and MASCOT v2.1 (Matrix Science Ltd., London, GB) was used for database search in SwissProt (database release September 2010 containing 519,348 sequences), setting the taxonomy to human (20,359 sequences), a maximum of two missed cleavages, variable and fixed modifications to methionine oxidation, and cysteine carbamidomethylation respectively, precursor ion tolerance to 150 ppm and MS/MS fragment tolerance to 0.75 Da. The false discovery rate was set at 5% and MASCOT scores above 56 were considered significant. Representative gel pictures with identified spots and the peak lists used for identification with MASCOT are available at the Swiss 2D-PAGE repository (http://world-2dpage.expasy.org/repository/0054/) (41). Finally, the identified proteins were submitted to the Ingenuity Pathway Analysis (IPA) (Ingenuity® Systems, www.ingenuity.com).
Caveolin-1 Knock-down
The day before transfection, U2-OS cells were seeded in Chamber Slides (2.5 × 10⁴ cells/well) or in 100 mm dishes (1.2 × 10⁶ cells/dish) (BD Falcon, Erembodegem, Belgium). Cells at about 50% confluence were transiently transfected with Cav-1 specific short interfering RNA (siRNAs) (Hs CAV1 8 FlexiTube siRNA, Qiagen, Venlo, Netherlands) at a final concentration of 10 nm using HiPerFect Transfection Reagent (20 μl/μg of siRNA) (Qiagen) following the manufacturer's protocol. Untransfected cells and cells transfected with AllStars Neg. Control siRNA (Qiagen) were used as controls. Cells were incubated with the transfection complexes for 72 h under normal growth conditions before use.
Cortisol/Cortisol-BSA Stimulation
Cells were washed three times in Dulbecco's phosphate-buffered saline (Lonza) and incubated for 1 h in their growth medium containing 10% charcoal-stripped FBS (Sigma-Aldrich). Cells were stimulated with 1 μm hydrocortisone (Sigma-Aldrich) or 3 μg/ml cortisol-conjugated bovine serum albumin (Cort-BSA, Sigma-Aldrich) for 5, 15, or 90 min. Untreated cells or cells stimulated with 3 μg/ml BSA for 90 min (Sigma-Aldrich) were used as negative controls. Immediately after stimulation, cells were placed on ice and RNA and proteins extracted. Total RNA was isolated from 4 × 10⁶ cells lysed in QIAzol™ Lysis Reagent (Qiagen) using a standard phenol-chloroform extraction. Cytoplasmic and nuclear proteins were separated using the Nuclear Extract Kit (Active Motif, La Hulpe, Belgium). Proteins were purified and concentrated by acetone precipitation and re-suspended in CHAPS lysis buffer (30 mm TrisHCl, 2 m Thiourea, 7 m Urea, 1 × Nuclease Mix (GE Healthcare) 4% w/v of CHAPS, 2 tablets/100 ml of Protease Inhibitors (Roche, Mannheim, Germany), 12% of isopropanol, pH 8.5). The absence of the nuclear marker heterogeneous nuclear riboproteins A2/B1 (HNRP A2/B1) in the cytosolic fraction, and the absence of the cytosolic protein elongation factor 2 from the nuclear fraction confirmed the quality of the subcellular fractionation. Protein quantification was performed using the 2-D Quant Kit (GE Healthcare). Experiments were performed in biological triplicates.
RT-PCR
First strand synthesis was performed on 300 ng of total RNA using 200U of SuperScript® III Reverse Transcriptase (Invitrogen) in a 25 μl reaction containing 50U of RNase Out, 2.5 μm oligo-dT20 primers (Eurogentec, Seraing, Belgium), 400 μm deoxy nucleotide triphosphates in 250 mm Tris-HCl, 375 mm KCl, 15 mm MgCl2, 4 mm DTT (Invitrogen) at 55 °C for 1 h. cDNA amplification was performed in 25 μl reactions containing 20 mm Tris-HCl, 50 mm KCl, 1 mm MgCl2, 200 μm deoxy nucleotide triphosphates, 1 × SYBR green and 2.5 U Platinum Taq Polymerase (Invitrogen). Thermal cycling (CFX96, BioRad, Hercules, CA, USA) conditions were 95 °C, 2mins; 45 cycles of 95 °C, 20s; 60 °C, 20s; 72 °C, 30s; and a final elongation step at 72°C for 10 mins. Oligo deoxynucleotide primers used were GILZ fwd:GCACAATTTCTCCATCTCCTTCTT, GILZ rev:GGTGGTCTTCGGCTGCTTGGTA, β-actin fwd:GGCCACGGCTGCTTC, β-actin rev: GTTGGCGTACAGGTCTTTGC at a final concentration of 1 μm.
PCR Array
The 18 most common signaling pathways were investigated in 4 × 10⁶ CCRF-CEM cells stimulated for 6 h with 3 μg/ml BSA or cortisol-conjugated BSA. Stimulation with Cort 1 μm for 6 h was used as positive control. Total RNA was extracted from cells using the RNeasy® Mini Kit (Qiagen). Contamination by genomic DNA was prevented using an on-column DNase digestion with the RNase-Free DNase Set (Qiagen). cDNA was synthesized from 1 μg of total RNA using the RT2 First Strand Kit (Qiagen) and Human Signal Transduction Pathway Finder RT2 Profiler™ PCR Arrays (Qiagen) were performed following the manufacturer's protocol. Experiments were performed in biological triplicates. Data were analyzed with the RT2 Profiler™ PCR Array Data Analysis V3.5, calculating changes in gene expression using the 2-ΔΔCT method (42).
SDS-PAGE and Western Blot
Immunoblotting was performed according to standard procedures (43). Briefly, protein samples (10 μg per lane) were resolved on a NuPAGE® 4–12% Bis-Tris ZOOMTM gel (Invitrogen) and transferred onto a HyBondTM LFP PVDF membrane (GE Healthcare). Membranes were blocked for 2 h in TBS-3% BSA-0.3% Tween20. Membranes were developed overnight at 4 °C with primary antibodies diluted in blocking buffer (1:500 anti-COX5b, 1:500 anti-ERAB, 1:250 antiprohibitin, 1:500 anti-P23, 1:500 anti-methionine adenosyltransferase (MAT II), 1:500 anti-Caveolin1, Santa Cruz Biotechnologies, Heidelberg, Germany) and appropriate Cy5-labeled secondary antibodies (GE Healthcare). Subsequently, blots were washed and human β-actin was probed (anti-β-actin, Santa Cruz Biotechnologies) and revealed with an appropriate Cy3-labeled secondary antibody (GE Healthcare). Immunoreactive bands were detected using the Typhoon 9400 imager (GE Healthcare) with the appropriate excitation wavelength (Cy5 = 633 nm; Cy3 = 532 nm) at a PMT of 480V and scanned at a resolution of 50 microns. Band intensities were quantified using ImageJ (NIH, Bethesda, MD, USA).
In situ Proximity Ligation Assay (in situ PLA)
U2-OS and MCF-7 cells were seeded (8 × 10⁴ cells/well) on 8-well Culture Slides (BD Falcon) in 500 μl of growing medium and incubated overnight at 37 °C, 5% CO2. Cells were fixed with 3% paraformaldehyde in PBS for 15 min at room temperature, and washed. Jurkat and CCRF-CEM cells were harvested, washed, fixed in PBS-1% paraformaldehyde for 15 min at room temperature, re-washed and then deposited on 0.05% polylysine (Sigma-Aldrich) pre-coated polytetrafluoroethylene printed microscopy slides (Electron Microscopy Sciences, Hatfield, PA, USA). For all cell lines, free aldehydes were quenched with 5 mm Ammonium Chloride in PBS for 10 min room temperature and subsequently washed in PBS. Slides were blocked for 1 h at room temperature with PBS, 5% BSA (Sigma-Aldrich), 0.1% cold-water fish skin gelatin (Sigma-Aldrich), 5% normal goat serum (Uptima, Montluçon, France), and 5% normal rat serum (Uptima). After washing with PBS - 0.1% BSA, cells were incubated overnight at 4 °C with a primary anti-GR or anti Caveolin 1 antibody diluted in washing buffer. Anti-GR antibodies used were 5E4 binding to an epitope within residues 150–176 (provided by Dr. Timea Berki, University of Pécs (44); M20, binding to an epitope within residues 1–50 (Santa Cruz Biotechnologies); H300, binding to an epitope within residues 121–420 (Santa Cruz Biotechnologies); and P20, binding to an epitope within residues 727–777 (Santa Cruz Biotechnologies) as outlined in supplemental Fig. S3. The 4H312 anti Caveolin-1 antibody was raised against the full length protein and has an unknown epitope (Santa Cruz Biotechnologies). Paraformaldehyde was used as fixative and antibodies hybridizations were performed in the absence of detergent to ensure that only the membrane GR was detected. After washing, the in situ PLA was performed with the Duolink Kit II (OLINK Bioscience, Uppsala, Sweden). The expression of the membrane GR was detected by a single recognition PLA using a pair of secondary anti-mouse or anti-rabbit antibodies conjugated with DNA oligonucleotides (PLA probes). The interaction between GR and Cav-1 was detected by a double recognition PLA, using PLA probes raised against two different species. Fluorescent signal was generated using DuolinkII Detection Reagents Orange (OLINK Bioscience) following the manufacturer's protocol. Slides were mounted using the DII Mounting Medium with 4,6-diamidino-2-phenylindole (OLINK Bioscience) and incubated for 30 min at room temperature to stain the nuclei. All experiments were performed in at least biological duplicates. In situ PLA controls were performed without the primary antibody and with the primary antibody pre-incubated with its blocking peptide. Images were recorded on AxioOBSERVER.Z1 fluorescence microscope (Zeiss, Zaventem, Belgium) equipped with ApoTome and Colibri, using an AxioCam MR R3 camera (Zeiss) and the AxioVs40 V4.8.2.0 software (Zeiss). The PLA signals were quantified with the Duolink ImageTool software (OLINK Bioscience) and expressed as average number of spots per cell. Statistical difference among preparations was computed with a Wilcoxon Signed Rank test.
RESULTS
Proteomic and Genomic Effects of mGR Activation
To investigate the effects of mGR activation, CCRF-CEM cells were stimulated with Cort-BSA for 5, 15, and 90 min. Cytosolic and nuclear protein fractions were compared with those from unstimulated control cells using 2-D DIGE (Fig. 1A). Independent of the time points, a total of 43 and 103 differentially expressed proteins were identified in the cytosolic and nuclear fractions, respectively, and 18 of them in both fractions (Fig. 1B, supplemental Table S1), from a total of 1750 spots. Ingenuity pathway analysis of both protein datasets combined identified the “Cell death, Cancer, Cell Cycle” as the top network (Score 24) and the proteins p53, RelA and Myc represented its central nodes (Fig. 1C). Individual IPA were performed for each time point and each fraction (Table I). Statistically significant top networks were obtained for each data set investigated (Scores between 12 and 24). However, the top functions and canonical pathways had relatively high p values (between 4.70E-03 and 7.75E-08), partially, the result of the low number of proteins modulated by Cort-BSA. Networks and molecular functions clearly showed that the activation of the mGR is associated with cell death and apoptosis in CCRF-CEM cells. This is in line with previous findings indicating that the mGR expression strongly correlates with GC-induced lymphocytolysis (24). Furthermore, Cort-BSA appears to affect several metabolic pathways, such as glycolysis/gluconeogenesis, purine metabolism, and aminoacyl-tRNA biosynthesis.
Fig. 1.
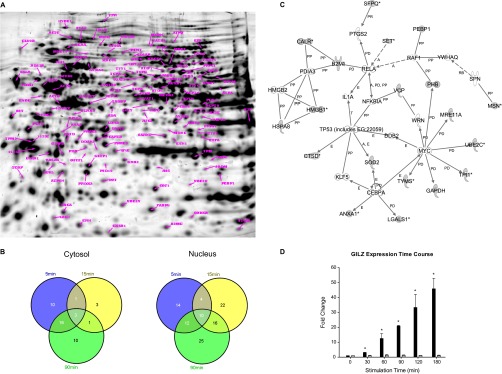
Proteomic changes in CCRF-CEM cells on mGR activation by Cort-BSA.
A, Merged image of 2D-gel pictures obtained for the cytosolic and nuclear fractions at 5, 15, and 90 min after Cort-BSA stimulation. Differentially expressed proteins are shown and labeled. B, Venn diagrams showing the number of Cort-BSA regulated proteins in the cytosolic and nuclear fraction in CCRF-CEM at the indicated time points. Protein names are listed in supplemental Table S1. C, Top rated network generated by Ingenuity pathway analysis on the complete data set of Cort-BSA modulated proteins in CCRF-CEM. D, Cort-BSA stimulation does not induce GILZ expression through the activation of the cytosolic GR.  = Cortisol;
  = Cort-BSA. * p < 0.01.
Table I. Ingenuity analyses summary of Cort-BSA induced proteomic changes in CCRF-CEM cells.
| Data set | Top network | Scorec | Top functions | p value | Top canonical pathways | p value |
|---|---|---|---|---|---|---|
| 5 mina | Cell Death, Cellular Growth and Proliferation, Cancer | 17 | Cell death of tumor cell lines | 3.85E-05 | Glycolysis/Gluconeogenesis | 6.54E-04 |
| Apoptosis of lymphoma cell lines | 7.27E-05 | Purine Metabolism | 7.51E-04 | |||
| Apoptosis of tumor cell lines | 8.63E-05 | Oxidative Phosphorylation | 9.68E-04 | |||
| 15 mina | Cell Death, Cellular Development, Hematological System Development and Function | 12 | Cell death of lymphoma cell lines | 8.21E-05 | Aminoacyl-tRNA Biosynthesis | 3.73E-05 |
| Apoptosis | 1.69E-03 | Mitochondrial Dysfunction | 6.42E-04 | |||
| Apoptosis of lymphoma cell lines | 3.42E-03 | DNA Double-Strand Break Repair by Non-Homologous End Joining | 2.9E-03 | |||
| 90 mina | Cancer, Cell Death, Gastrointestinal Disease | 18 | Cell death of lymphoma cell lines | 1.26E-04 | Purine Metabolism | 3.56E-05 |
| Apoptosis of lymphoma cell lines | 3.89E-04 | RhoA Signaling | 1.51E-04 | |||
| Apoptosis of tumor cell lines | 8.72E-04 | Aminoacyl-tRNA Biosynthesis | 2.05E-04 | |||
| All | Cell Death, Cancer, Cell Cycle | 24 | Cell death of lymphoma cell lines | 8.25E-07 | Aminoacyl-tRNA Biosynthesis | 4.23E-06 |
| Apoptosis | 1.08E-05 | Purine Metabolism | 1.08E-05 | |||
| Apoptosis of lymphoma cell lines | 1.24E-05 | Glycolysis/Gluconeogenesis | 1.41E-05 | |||
| Cytosolb | Cancer, Cell Death, Reproductive System Disease | 13 | Accumulation of hydrogen peroxide | 4.70E-03 | Glycolysis/Gluconeogenesis | 1.72E-04 |
| Adhesion of endothelial cell lines | 4.70E-03 | Mitochondrial Dysfunction | 2.34E-04 | |||
| Permissivity of lymphoma cell lines | 4.70E-03 | Protein Ubiquitination Pathway | 3.91E-03 | |||
| Nucleusb | Cell Death, Cancer, Gene Expression | 19 | Cell death of lymphoma cell lines | 7.75E-08 | Aminoacyl-tRNA Biosynthesis | 1.09E-06 |
| Apoptosis of lymphoma cell lines | 1.84E-06 | RhoA Signaling | 3.77E-04 | |||
| Apoptosis | 3.18E-06 | DNA Double-Stand Break Repair by Non-Homologous End Joining | 3.9E-04 |
a Combined cytosol and nuclear fractions.
b Combined time points of 5, 15 and 90 minutes.
c Network scores ≥ 2 have at least a 99% confidence of not being generated by random chance.
In contrast to the networks, molecular functions and canonical pathways were different when analyzing the cytosolic and nuclear fractions separately. In the cytosol, 27 protein spots were up- and 20 down-regulated on Cort-BSA stimulation. The strongest induction and inhibition was observed for Catalase (+1.7 fold-change; p = 0.043 at 5 min) and for SET protein (-2.6 fold-change; p < 0.001 at 5 min). The top canonical pathway identified in this data set was glycolysis/gluconeogenesis, mitochondrial dysfunction, and protein ubiquitination pathway. The top functions identified were not related to cell death and included accumulation of hydrogen peroxide, adhesion of endothelial cell lines, and susceptibility to infection of lymphoma cell lines.
In the nuclear fraction, we had twice as many proteins regulated by Cort-BSA than in the cytosol. Forty-eight protein spots were up- and 54 down-regulated on stimulation, and eight spots were modulated differently at all three time points investigated. The strongest up- and down-regulation was observed for Glutaredoxin-3 (+2.7 fold-change; p = 0.029 at 5 min) and for Prostaglandin E synthase 3 (-3.9 fold-change; p = 0.025 at 90 min), respectively. In this fraction, the top canonical pathways identified were aminoacyl-tRNA biosynthesis, RhoA signaling, and DNA double-strand break repair by nonhomologous end joining.
To confirm the purity of Cort-BSA and the selectivity of its activity, we stimulated CCRF-CEM cells with either Cort or Cort-BSA and we measured the expression of GC-induced leucine zipper (GILZ), a cytosolic GR target gene. GILZ was found significantly up-regulated by Cort already after 30 min, whereas Cort-BSA had no detectable effects, thus excluding the activation of the cytosolic GR (Fig. 1D).
To investigate if the activation of the mGR ultimately leads to genomic effects, via known signaling pathways, we stimulated CCRF-CEM cells with either BSA or Cort-BSA for 6 h. We measured by PCR array the expression of 84 genes representative of 18 signal transduction pathways. Fold changes ranged between -1.317 (Telomerase reverse transcriptase, TERT) and +1.728 (Interleukin 8, IL-8), but no statistical difference was found between the Cort-BSA treatment and BSA neg. controls (p values ranging from 0.16 to 0.95) (Fig. 2A). On the other hand cortisol stimulation significantly modulated 63 of the 84 investigated genes (Fig 2B) (supplemental Table S3).
Fig. 2.

Cort-BSA stimulation does not induce transcription by common signaling pathways. CCRF-CEM cells were stimulated with 3 μg/ml Cort-BSA (Group 1) or BSA (Control group) for 6 h and Human Signal Transduction Pathway Finder RT2 Profiler™ PCR Arrays (Qiagen) were performed in biological triplicates and graphical representations were generated by RT2 Profiler™ PCR Array Data Analysis V3.4. The scatter plot of the 84 genes investigated (left panel) show no changes in gene expression and the volcano plot (right panel) shows the range of p values obtained.
Collectively these proteomics and transcriptomics results suggest that Cort-BSA stimulated the mGR with significant effects on the CCRF-CEM cell proteome, mainly associated with cell death via apoptosis. However, there was no activation of any of the major cell signaling pathways.
Validation of Cort-BSA Regulated Proteins
Immunoblots were performed to validate the proteomic data of five selected proteins that were modulated by a short exposure to Cort-BSA (Table II).
Table II. Cort-BSA regulated proteins in CCRF-CEM cells validated by Western blot.
| Protein name | Fraction | Time point | Fold change (2D-DIGE)a | Fold change (WBb) | p value |
|---|---|---|---|---|---|
| Cytochrome C oxidase subunit Vb COX5B_HUMAN | nucleus | 5 min | +1.291 | +1.223 | 0.006 |
| Cytochrome C oxidase subunit Vb COX5B_HUMAN | cytosol | 15 min | −1.373 | −3.231 | <0.001 |
| 3-hydroxyacyl-CoA dehydrogenase type-2 HCD2_HUMAN | cytosol | 15 min | −1.296 | −1.843 | 0.003 |
| Prostaglandin E synthase 3 TEBP_HUMAN | nucleus | 90 min | −3.869 | −1.557 | 0.039 |
| S-adenosylmethionine synthase isoform type-2 METK2_HUMAN | cytosol | 90 min | +1.375 | +1.553 | 0.014 |
| Prohibitin PHB_HUMAN | nucleus | 5 min | +1.239 | +1.173 | 0.167 |
a Differentially expressed protein spots were detected using the Delta2D software and accepted based on fold changes with a t-test value of p < 0.05.
b Western Blot.
We confirmed the mild up-regulation (+1.223; p = 0.006) of the subunit Vb of Cytochrome C oxidase (Cox Vb) in the nuclear fraction after 5 min, and its down-regulation (−3.231; p < 0.001) in the cytosol at 15 min. The Western blot showed a more robust decrease of Cox Vb in the cytosol compared with the proteomic data (−1.373; p < 0.044), probably because of the greater sensitivity of the latter technique. Also the down-regulation of the mitochondrial protein 3-hydroxyacyl-CoA dehydrogenase type-2 (HADH) was validated (−1.843 fold change at 15 min in the cytosol, p = 0.003). The effect of 90 min Cort-BSA stimulation on two cytosolic proteins was confirmed, observing a significant decrease (−1.557; p = 0.039) of the Prostaglandin E Synthase/p23 in the nuclear fraction and an up-regulation (+1.553; p = 0.014) of MAT II in the cytosolic fraction. Finally, we tested prohibitin, a membrane associated protein and, as expected, we observed an up-regulation in the nuclear fraction at 5 min after Cort-BSA stimulation, however this difference was not statistically significant (+1.173; p = 0.167), probably because of the very small fold-change we tried to confirm. Four out of the five selected proteins were validated by an independent sensitive technique and these changes were sensitive to pretreatment with a GR antagonist (supplemental Fig. S5). Because RU486 binds to the GR and not the mineralocorticoid receptor (MR) this experiment demonstrates that the Cort-BSA effects are not mediated by the MR. Interestingly, this experiment also shows that RU486 is an antagonist also of the mGR. This is not surprising because antibodies binding to the ligand binding domain of the cytosolic GR also bind to the membrane GR (Fig. 3B). Thus, we conclude that our proteomics data set provides a realistic picture of mGR activation effects in CCRF-CEM cells.
Fig. 3.
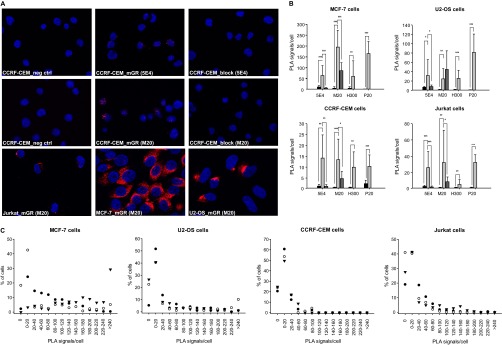
mGR detection by in situ Proximity Ligation Assay.
A, Representative microscopy pictures of mGR detection by in situ PLA in CCRF-CEM, Jurkat, U2-OS and MCF-7 cells. Control conditions are shown for CCRF-CEM cells only: in situ PLA was performed either with no primary antibody (neg ctrl) or blocking the primary antibody with its cognate peptide “block”. B, The number of mGR molecules, expressed in average PLA signals per cell, in CCRF-CEM, Jurkat, U2-OS, and MCF-7 cells is summarized. Plots show the controls for each cell line and for each of the three anti-GR antibodies tested. = Neg control; = mGR;  = block. C, PLA signals were counted for each cells and the distribution of the signal over the population of cells is shown for all the cell lines tested. ● = 5E4 mAb; ▾ = H300 ab; △ = M20 ab. * p < 0.05, ** p < 0.01, *** p < 0.005.
mGR Detection by In Situ PLA
Because Cort-BSA induced significant proteomic changes after 5, 15, and 90 min of stimulation, we investigated whether the GR is present on the cell surface. We performed in situ PLA in four different cell lines using three different anti-GR antibodies, each targeting a different epitope within the N-terminal region (Fig. 3A).
All the cell lines tested expressed the mGR although in considerably different amounts (Fig. 3B) with MCF-7 and U2-OS cells having the highest levels: the proportion of highly positive cells (>100 PLA signals/cell) in MCF-7 cells was significantly higher than in CCRF-CEM and Jurkat cells for the three antibodies tested, whereas for U2-OS cells this was true only for the H300 antibody (Ab) (Kruskal-Wallis One Way Analysis of Variance on Ranks, p < 0.001; Tukey test for all pairwise multiple comparisons, all p < 0.05). In MCF-7 cells we observed some differences between anti-GR antibodies. First, in this cell line the M20 Ab gave the strongest average PLA signal (Fig. 3B). Second, the H300 antibody detected the mGR in only 82% of MCF7 cells, whereas with the other Abs essentially all cells were mGR positive (97.8% 5E4 and 100.0% M20) (Fig. 3C).
In U2-OS cells, we observed similar average numbers of PLA signals per cell and a similar distribution within the cell population for the three different anti-GR antibodies (Fig. 3B and 3C). The percentage of negative cells varied between 5 and 25% (Fig. 3C).
The two lymphoblast-like T-cell lines (CCRF-CEM and Jurkat) had a very low mGR expression, with few target molecules per cell and 20–25% mGR negative cells (Fig. 3C), or even 40% negative Jurkat cells when the H300 antibody was used. A considerable proportion (40–41%) of Jurkat cells had less than 20 copies of mGR per cell. Fifty percent to 61% of CCRF-CEM cells had similarly low numbers of receptors (Fig. 3C), which corresponded to the lowest mGR signal among all cell lines tested.
Thus, the high sensitivity of the PLA technique detected the mGR in all the cell lines tested, including very low numbers of this receptor even in Jurkat cells, which were reported to be negative in previous studies. In situ PLA was sensitive enough to detect the mGR in these cell lines without the need for serum starvation, known to enhance membrane expression of steroid receptors (45). As expected GC withdrawal increased mGR expression in all cell lines (except Jurkat cells) (supplemental Fig. S4).
Except for the above mentioned discrepancies in MCF-7 cells, the average number of PLA signals per cell and the signal distribution within the population was similar for the cell lines investigated regardless of the antibody used (Fig. 3B and 3C). This shows that the different epitopes in the N terminus are exposed and equally available on the cell surface. Similar results were obtained with the P20 antibody targeting the ligand binding domain (LBD) of the receptor, confirming that also this domain is exposed on the membrane surface and accessible to membrane impermeable GC (Fig. 3B).
Cort-BSA Regulated Proteins in Different Cell Lines
In the previous section we directly visualized the mGR in four different cell lines. Here, we investigated in the three additional cell lines the effect of short (5, 15 and 90 min) Cort-BSA stimulations on the levels of the validated target proteins identified above in CCRF-CEM cells (Table III).
Table III. Cort-BSA regulated proteins in different cell lines.
| Name | Fraction | Time point | Cell line | Fold change | p value | Comment |
|---|---|---|---|---|---|---|
| Cytochrome C oxidase subunit Vb COX5B_HUMAN | cytosol | 15 min | CCRF-CEM | −3.231 | <0.001 | |
| U2-OS | +1.551 | 0.197 | ||||
| Jurkat | +1.040 | 0.747 | ||||
| MCF-7 | −1.328 | 0.007 | ||||
| nucleus | 5 min | CCRF-CEM | +1.223 | 0.006 | ||
| U2-OS | +1.119 | 0.639 | −2.004; p = 0.055 at 90 min | |||
| Jurkat | +1.009 | 0.976 | ||||
| MCF-7 | +1.670 | 0.087 | ||||
| 3-hydroxyacyl-CoA dehydrogenase type-2 HCD2_HUMAN | cytosol | 15 min | CCRF-CEM | −1.843 | 0.003 | |
| U2-OS | −2.086 | 0.015 | ||||
| Jurkat | −6.072 | 0.005 | ||||
| MCF-7 | −1.879 | 0.129 | −5.141; p = 0.005 at 5 min | |||
| Prohibitin PHB_HUMAN | nucleus | 5 min | CCRF-CEM | +1.173 | 0.167 | |
| U2-OS | −1.338 | 0.122 | ||||
| Jurkat | +1.349 | 0.166 | +2.315; p = 0.016 at 15 min | |||
| MCF-7 | −1.266 | 0.078 | −1.442; p = 0.019 at 15 min | |||
| Prostaglandin E synthase 3 TEBP_HUMAN | nucleus | 90 min | CCRF-CEM | −1.557 | 0.039 | |
| U2-OS | not detected | |||||
| Jurkat | not detected | |||||
| MCF-7 | not detected | |||||
| S-adenosylmethionine synthase type-2 METK2_HUMAN | cytosol | 90 min | CCRF-CEM | +1.553 | 0.014 | |
| U2-OS | +1.393 | 0.252 | ||||
| Jurkat | −1.662 | 0.090 | −2.026; p = 0.009 at 15 min | |||
| MCF-7 | +1.221 | 0.264 |
HADH was consistently down-regulated by Cort-BSA in all cell lines investigated. After 15 min the effect was most pronounced in Jurkat cells (−6.072; p = 0.005). In MCF-7 cells, HADH down-regulation was faster than in the other cell lines (−5.141; p = 0.005 at 5 min) and was no longer significant at later time points.
In MCF-7 cells, mGR activation significantly down-regulated CoxVb in the cytosolic fraction (−1.328; p = 0.007), while up-regulating it in the nuclear fraction (+1.670; p = 0.087), as observed above in CCRF-CEM cells. In U2-OS cells, CoxVb responded to Cort-BSA stimulation only in the nucleus after 90 min (−2.004; p = 0.055), indicating a different kinetic and regulation in this cell line. In Jurkat cells there was no effect on CoxVb.
Similarly, MAT II response to Cort-BSA differed between cell lines. In both U2-OS and MCF-7 cells, this protein was not significantly modulated on stimulation, but as in CCRF-CEM cells there was a mild up-regulation in the cytosol. On the other hand, Jurkat showed a down-regulation of MAT II already at 15 min (-2.026; p = 0.009), resulting in -1.661 fold-change (p = 0.090) at 90 min.
2D-gel analysis suggested prohibitin as a potential component of fast GC nongenomic effects in CCRF-CEM cells. Although this was the only protein of the five tested of which changes in expression could not be validated by Western blot, we investigated Cort-BSA effects on prohibitin in the other cell lines. In Jurkat cells, we observed a significant induction after 15 min of GC exposure (+2.315; p = 0.016), whereas in MCF-7 Cort-BSA had an opposite effect (−1.442; p = 0.019). Therefore we confirm prohibitin as a genuine Cort-BSA regulated protein, at least in the latter cell lines. No significant change was induced in U2-OS cells.
Finally, p23 was not detectable by Western blot in neither U2-OS, Jurkat nor MCF-7 cells, thus excluding this protein from this analysis.
Despite cell-specific differences, overall the above proteins that were validated as Cort-BSA targets in CCRF-CEM cells also responded to mGR activation in three other cell lines, suggesting a common function of the mGR in cells derived from different organs.
mGR and Caveolin-1 Interaction
Previous reports suggested a key role of the caveolar structural protein Cav-1, in mediating rapid effects of GCs through its interaction with the GR (30). We investigated the presence of mGR/Cav-1 heterodimers by double recognition in situ PLA, in the above four cell lines. Interestingly, in situ PLA on U2-OS cells with the 5E4 antibody, which targets the transactivation domain (AF1, amino acid (aa) 150–176) of the GR in combination with a rabbit anti-Cav-1 antibody, generated no detectable signal. This is in line with previous findings showing that the GR interacts with Cav-1 through its AF1 domain (30). Therefore we performed the PLA assays with the GR rabbit Ab M20 (aa 1–50) and a mouse anti-Caveolin-1 mAb (Fig. 4A and 4B).
Fig. 4.
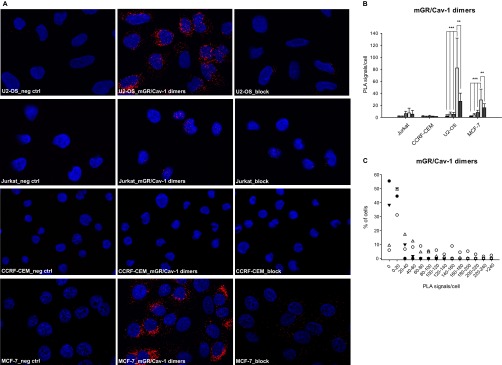
mGR and Cav-1 heterodimers detection by in situ Proximity Ligation Assay.
A, Representative microscopy pictures of mGR/Cav-1 heterodimers detection by in situ PLA in CCRF-CEM, Jurkat, U2-OS and MCF-7 cells. Control conditions includes: no primary antibody (neg ctrl), no GR antibody (Cav-1 only), no Cav-1 antibody (M20 only), or blocking the anti-GR primary antibody with its cognate peptide “block.” B, The average number of mGR/Cav-1 heterodimers, expressed in PLA signals per cell, in CCRF-CEM, Jurkat, U2-OS and MCF-7 cells is summarized. = Neg control; = Cav-1 ab only; = GR ab only;  = GR/Cav-1 dimers;
  = block. C, PLA signals were counted for each cell line and the distribution of the signal over the population of cells is shown for the four cell lines tested. ● = CCRF-CEM cells; ○ = U2-OS cells; ▾ = Jurkat cells; △ = MCF-7 cells. * p < 0.05, ** p < 0.01, *** p < 0.005.
U2-OS cells had the highest average number of detectable mGR/Cav-1 dimers per cells (Fig. 4A and 4B). Only 5,9% of cells were negative and a considerable proportion of cells (34.1%) were highly positive (>100 mGR/Cav-1 dimers per cell; Fig. 4C). The specificity of the in situ PLA technique was confirmed in Cav-1 knocked-down U2-OS cells. A 70% reduction of Cav-1 at the protein level also reduced significantly the average number of mGR/Cav-1 dimers detected at both 48 h (p = 0.01) and 72 h (p = 0.02) post siRNA transfection (Fig. 5B and 5C).
Fig. 5.
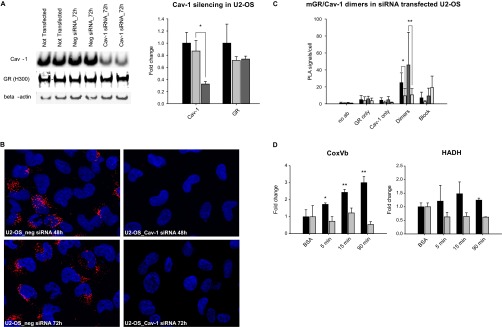
Effects of Cav-1 silencing in U2-OS cells.
A, Caveolin 1 was silenced in U2-OS by transient transfection of specific siRNA. The protein expression was reduced by 70% compared with cells not transfected or transfected with unrelated siRNA (Neg siRNA). GR expression was not affected by the treatment. = Not transfected; = Neg siRNA; = Cav-1 siRNA. B, Representative pictures of GR/Cav-1 heterodimers in U2-OS transiently transfected for 48 h and 72 h with either Cav-1 siRNA or Neg siRNA. C, GR/Cav-1 dimers, expressed in average PLA signals per cell, were significantly reduced on siRNA transfection at both 48 h and 72 h. = Neg siRNA 48 h; = Cav-1 siRNA 48 h; = Neg siRNA 72 h; = Cav-1 siRNA 72 h. D, Modulation of HADH and CoxVb by Cort-BSA in U2-OS cells transfected with either Neg siRNA (), or Cav-1 siRNA (). * p < 0.05, ** p < 0.01.
MCF-7 cells had a lower average number of mGR/Cav-1 dimers per cell and 9.3% of cells had no detectable signal (Fig. 4B and 4C). Very few cells (3.0%) were highly positive whereas a high proportion of MCF-7 (49.4%) had less than 20 PLA signals per cell (Fig. 4C).
The two lymphoblast-like T-cell lines had no detectable mGR/Cav-1 dimers. Although 50.0% of Jurkat cells had few detectable spots (1–20 PLA signals/cell), 38.3% were negative, resulting in a low average number of mGR/Cav-1 dimers that was not significantly different from controls (p values ranging from 0.08 to 0.68) (Fig. 4B). In CCRF-CEM cells we consistently observed no mGR/Cav-1 interaction, 95.2% of these cells had less than five spots per cell and more than half had none (Fig. 4C). Western blot and PCR in both Jurkat and CCRF-CEM confirmed that these cell lines had no detectable Cav-1 (data not shown). The absence of Cav-1 in these cell lines suggests that this protein is not essential for mediating GCs rapid non-genomic effects at least in these T-cell lines.
Role of Caveolin-1 in Cort-BSA Mediated Effects
We showed above that in U2-OS cells on Cort-BSA exposure HADH and CoxVb were down-regulated in the cytosol and in the nuclear fraction, respectively (Table III). To investigate the role of Cav-1 in mGR mediated effects, we knocked-down Cav-1 in U2-OS cells using siRNA and stimulated the cells with Cort-BSA 72h post-transfection. Cav-1 expression at the protein level was significantly reduced to 30% and GR expression was not affected by the treatment (Fig. 5A).
Immunoblots were performed on these cells to assess the expression of HADH and Cox Vb 5, 15, and 90 min after GC-exposure. As expected, in cells transfected with the irrelevant control siRNA we observed a down-regulation of these target proteins and two-way analysis of variance showed no statistical difference with untransfected cells (Fig. 5D). Cav-1 knocked-down cells were significantly different from controls and in these cells Cort-BSA up-regulated both target proteins. At 90 min we observed a fold-change of +1.244 and +3.004 for HADH and CoxVb, respectively (Fig. 5D). The effect of Cav-1 siRNA and time on protein expression was highly significant for CoxVb (p < 0.001) and narrowly failed the test for HADH (p = 0.078).
The opposite effect of Cort-BSA on CoxVb and HADH mediated by Cort-BSA in knocked-down cells suggests that at least in U2-OS cells, Cav-1 modulates the final outcome of mGR activation.
DISCUSSION
Glucocorticoids exert their therapeutic effects by activating the cytosolic GR leading to classical genomic effects. In addition there is a fast nongenomic pathway that is at least partially mediated by a membrane bound GR. Here, we report the first study on proteomic effects induced by selective activation of the mGR only. The lymphoblast-like T-cell line CCRF-CEM was chosen as it was the first human cell line shown to have a functional mGR (19), responsible for the well-known pharmacological effect of GCs, GC-induced apoptosis (18, 24, 25). This cell line was also used to validate the liposome-based mGR detection technique by Bartholome et al. (22) and it is the cell line in which the mGR has been mostly studied. For their lymphocytolytic activity, GCs are widely used in the treatment of acute lymphoblastic leukemia (18). For their anti-inflammatory and immuno-suppressive effects they are often used in the treatment of autoimmune and inflammatory diseases (46). Proteomic analysis identified 128 proteins that were differentially regulated in CCRF-CEM cells on specific activation of the mGR using BSA-conjugated cortisol. These activities were confirmed to be unique to the mGR as there was no activation of the cGR target gene GILZ. In line with the above known pharmacological effects of GCs, we observed that the top networks activated on mGR activation were mainly involved in cell death of this lymphoma cell line via apoptosis. MAT II was one of the proteins identified in our proteomic data set and subsequently validated as a mGR target protein. This protein catalyzes the biosynthesis of S-adenosylmethionine, which is the principal methyl donor in the cell and is required for T-lymphocyte activation and proliferation (47). In Jurkat cells, GCs were previously shown to inhibit MAT II expression thus blocking T-cell proliferation, inflammation, and initiation of an immune response (47). Our observation of a rapid decrease of this protein in the cytosolic fraction on mGR activation of Jurkat cells suggests that these effects are already initiated by the early activation of the mGR.
Also some other anti-inflammatory effects seem to be triggered by mGR activation. We showed that Cort-BSA reduced Prostaglandin E synthase 3 (p23) in CCRF-CEM cells. This protein is part of the multiprotein complex binding the inactive GR and is required for GR nuclear translocation and target gene trans-activation and trans-repression (48). This protein also catalyzes the production of prostaglanding E2 (PGE2) as an immediate response to pro-inflammatory stimuli and GCs were previously shown to exert their anti-inflammatory function, partially by inhibiting the up-regulation of other prostaglanding E2 synthases (49). Our results suggest that the mGR plays an early role in this GC activity.
Furthermore, we found several metabolic pathways to be associated with Cort-BSA stimulation, including the glycolysis/gluconeogenesis and amino-acyl tRNA biosynthesis pathways. It is well established that GCs are important for the maintenance of metabolic homeostasis. They mediate the switch from amino acid and protein anabolism to catabolism by down-regulating enzymes, such as aminoacyl-tRNA synthetases (50). CGs also stimulate hepatic gluconeogenesis; inhibit glucose uptake by peripheral tissues (51); liberate energy substrates as glucose, amino acids, glycerol, and fatty acids; and increase lipolysis by up-regulating lipase in adipocytes (52). Our IPA results strongly suggest that these effects are at least partially the result of the rapid activation of mGR. In our data set, HADH was found to be inhibited rapidly after Cort-BSA stimulation in all cell lines investigated. This protein is a metabolic enzyme involved in the β-oxidation of fatty acids and their transformation into acetyl Co-A fueling the citric acid cycle. HADH was also shown to directly interact with the glutamate dehydrogenase (GDH), an enzyme oxidizing and deaminating glutamate to α-ketoglutarate. HADH inhibits glutamate dehydrogenase activity controlling insulin release in pancreatic cells and glycemia (53).
On mGR activation we also observed a rapid translocation of COX Vb from the cytosol to the nuclear fraction, which may also contain mitochondria. This Cort-BSA target protein is an important regulatory subunit of the cytochrome C oxidase (COX), the terminal enzyme of the mitochondrial respiratory chain (54). In CEM cells the recruitment of COX Vb to the mitochondria increases oxydative phosphorylation and mitochondrial respiration encouraging adenosine triphosphate (ATP) production (55). Thus the mGR seems to be involved in multiple ways in the effects of GC on the fatty acid, glucose, and citric acid pathways as well as the respiratory chain, to rapidly provide energy under stress. Although we have only started to dissect mGR specific activities and to discriminate them from the cytosolic GR, our data seem to suggest that the mGR supports a number of GC-effects by rapid “priming” of the cell for the subsequent genomic actions (56).
The mechanism by which mGR activation leads to these proteomic changes requires further investigation. CoxVb was previously reported as a protein kinase A target (54) and prohibitin appears to play a role in several processes such as proliferation, apoptosis, maintenance of mitochondria function and morphology, gene transcription and signal transduction pathways, especially phosphatidylinositol 3-kinase/PKB and Ras/ Mitogen activated protein kinase /extracellular-signal-regulated kinase signaling (57, 58). Modulation of prohibitin by Cort-BSA was not validated by Western blot in CCRF-CEM cells, but in Jurkat and MCF-7 cells mGR activation lead to a significant change in prohibitin levels. Therefore, we studied 84 downstream target genes of 18 established signaling cascades, such as mitogenic, survival, cAMP response element-binding protein, and PKC pathways. In these experiments, CCRF-CEM cells were stimulated with Cort-BSA for 6 h to allow transcriptional changes to occur, however, for all genes differential expression (measured by qPCR) was below a twofold change and not statistically significant. In conclusion, in CCRF-CEM cells no shifts characteristic for phosphorylation were observed in our 2D-DIGE experiments, none of the above mentioned pathways emerged from Ingenuity analysis and target genes of the most important signal transduction pathways were not transcriptionally up-regulated. We cannot totally exclude that effects on the proteome may be mediated by rapidly phosphorylated kinases or other regulatory proteins, that are functionally very important, but are not necessarily detected by 2D-DIGE because of their low abundance. Nevertheless if this was the case it did not translate into transcriptional activation of target genes of major signaling pathways. Recently p38 Mitogen activated protein kinase was shown to be phosphorylated in human monocytes on mGR activation by dexamethasone-BSA (20), suggesting cell- or GC-specific mGR effects.
In CCRF-CEM T-lymphoma cells the mGR appears to exert its function at least partially through the modulation of RhoA activity. In our proteomic data set, this signaling mechanism emerged as a significantly enriched canonical pathway from the Ingenuity analysis. RhoA belongs to a family of guanosine triphosphatases, which are essential for adhesion, migration, morphological polarization, and activation of T-cells (59). Accordingly, in the cytoplasmic fraction we found that the top functions included adhesion of endothelial cell lines and susceptibility to infection of lymphoma cell lines, which is part of the category “Cell morphology.” These Rho guanosine triphosphatases are highly conserved and ubiquitously expressed and their modulatory mechanism differs considerably from other molecular regulators such as kinases. They exert their function only when associated to the membrane and on activation they induce a conformational change in their effector molecules requiring protein-protein interactions (59). Although major signaling pathways activating transcriptional events were not detectable, the short Cort-BSA stimulation used suggests that the effects observed are most probably caused by protein translocation, post-translational modifications, or protein-protein interactions.
In all stimulations we used a physiologically relevant dose of cortisol reflecting the concentration observed in human sera after moderate psychosocial stress. Similar GC levels in the in vivo study by Datson et al. resulted in an equally mild gene response in brain cells (60). Higher concentrations of Cort-BSA may have elicited stronger GC effects, but their physiological relevance could be questionable. Interestingly, our proteomic experiments are in direct agreement with another recent 2D-DIGE study from our laboratory (40). After acute stress in vivo similar fold changes were observed in an overlapping set of proteins in rat thymocytes. For example, after 15 min of restraint stress rat thymocytes showed a −2.23-fold change of SET protein in the cytosolic fraction whereas in the present study we observed a −2.6-fold change for SET. Similarly other proteins were found commonly regulated in the two data sets: Peroxiredoxin II (PRDX2; −1.74 in our study and −1.45 in stressed rats), the Heterogeneous nuclear ribonucleoprotein C (HNRPC; +1.16 in our study and −2.11 in stressed rats) and the ATP synthase subunit beta (ATPB; −1.12 in our study and −1.45 in stressed rats). This comparison between the two studies further underlines the physiological significance of our findings.
Furthermore, we confirmed the existence of the mGR at very low levels on the cell surface, by using the very sensitive in situ PLA method, which in principle generates a signal for each target molecule in a cell (37). Considering the high sensitivity of this PLA technique our 5% of CCRF-CEM cells having more than 50 molecules of mGR agree well with the 11% positivity found by flow cytometry using a liposome-based immunofluorescence amplification technique (22). Three additional cell lines, including Jurkat cells, which were previously reported to be essentially mGR negative (27), were positive for mGR expression by in situ PLA. MCF-7 cells had a considerably higher numbers of detectable receptors, whereas Jurkat and CCRF-CEM had the lowest. Even the low numbers of signals in these cell lines were consistently and significantly reduced to background levels when the antibodies were blocked with their cognate peptides, confirming the specificity of the mGR detection. Interestingly three antibodies directed against different epitopes within the first 400 residues of the classical GR gave the same results in three of the four cell lines tested. This strongly suggests that the mGR and the cGR have a high sequence homology (at least within these first 400 residues) and most probably originate from the same gene. Accordingly, a mild decrease in mGR levels was previously observed when the classical GR transcript was stably silenced with siRNAs (21). We also confirmed that the Ligand Binding Domain is exposed on the cell surface and is accessible to interact with the membrane-impermeable Cort-BSA conjugate. This is also compatible with our finding that the GR antagonist RU486 binds to the mGR and blocks its activity. We speculate that the residues between aa 420 and 527 may be involved in the association with the membrane or other membrane anchoring proteins. Specific splicing variants may be responsible for the membrane localization on this receptor. In any case no signal peptide or transmembrane domain has so far been identified in the classical GR protein sequence.
We extended the validation of the five Cort-BSA modulated proteins to the other mGR-positive cell lines. Although prostaglandin E synthase 3 was a Cort-BSA target in CCRF-CEM, this protein was not expressed in Jurkat, U2-OS, and MCF-7 cells. CoxVb, HADH, prohibitin, and MAT II were all modulated by Cort-BSA in at least one other cell line in the same manner as in CCRF-CEM cells. HADH was found to be down-regulated in all cell types, whereas the other validated Cort-BSA modulated proteins showed more heterogeneity. For example, MCF-7 showed an up-regulation of CoxVb in the nuclear fraction comparable to CCRF-CEM cells, whereas in U2-OS mGR activation down-regulated CoxVb with a different kinetics. Overall, these results indicate that these proteins are genuine mGR specific targets, albeit with some differences in kinetics.
The mechanism by which the GR is targeted to the membrane remains elusive. Our observation that Cav1-mGR dimers were detectable with the M20 GR antibody, and not with the 5E4 mAb covering the AF1 domain could be explained by a previous suggestion that the GR interacts with Cav-1 through this transactivation domain (30). Cav-1 is a structural protein of caveolae that previously has been shown to facilitate the translocation of the estrogen receptor to the cell membrane (32). For the mGR, it would appear that Cav-1 is not necessary for membrane localization, as previously suggested (27), because both CCRF-CEM and Jurkat cells do not express Cav-1. However, irrespective of the Cav-1 expression, the changes in the Cort-BSA modulated proteins were visible in all the cell lines investigated. To assess the role played by Cav-1 in rapid GCs effects we silenced Cav-1 in U2-OS cells, which had the highest number of mGR/Cav-1 dimers. After a 70% reduction in Cav-1 protein levels, HADH was no longer down-regulated by Cort-BSA and CoxVb showed an opposite regulation, with a marked and significant up-regulation in the nuclear fraction already after 5 min exposure. In absence of Cav-1, Cort-BSA induces an up-regulation of CoxVb as observed in CCRF-CEM cells and knocked-down U2-OS cells, whereas it is down-regulated when Cav-1 is present and associated with the mGR. However, in all cell lines tested Cort-BSA induced a down-regulation of HADH independent of Cav-1. Membrane-GR stimulation after Cav-1 silencing lead to a mild up-regulation of HADH, which was not observed in CCRF-CEM cells that do not express Cav-1. Thus, Cav-1 seems to act as a modulator of mGR activity and the outcome of mGR activation may ultimately depend on the relative numbers of mGR associated with Cav-1 or other members of the caveolin family, such as Cav-2 α, also expressed in leukemia T cells (61, 62).
We conclude that similar to the cytosolic GR, at least the first 400 amino acids of the mGR are the product of the NR3C1 gene. The expression of this receptor varies considerably among cell lines and our results suggest that even cells considered so far as mGR negative express this receptor. The activation of the mGR induces proteomic changes, which were largely validated in four cell lines despite some differences in kinetics and regulation. The IPA provides strong evidences that the mGR is involved in pro-apoptotic, immune-modulatory, and metabolic pathways, which are also modulated by GC and the cytosolic GR, suggesting that mGR activation triggers rapid early priming events that pave the way for the slower genomic GC activities. In CCRF-CEM cells, mGR activation was strongly related to cell death and seems to be largely responsible for the GC induced therapeutic lymphocytolysis. No clear genomic effect that would suggest transcriptional activation of the important kinases and their signaling pathways was identified on Cort-BSA stimulation and RhoA emerged as the most prominent signaling pathway. Finally, Cav-1 was not required for membrane localization of the GR and it was not necessary for activity, however if it dimerizes with the mGR it modulates Cort-BSA induced proteomic effects.
Supplementary Material
Acknowledgments
We thank Professor Timea Berki from the University of Pécs, Hungary for supplying the anti-GR antibody (clone 5E4) used in the study. We are grateful to Hartmut Schächinger for his initiatives within the Trier-Leiden International Research Training Group (IRTG GRK 1389/1) and the Graduate School of Psychobiology.
Footnotes
* This work was supported by a grant from the Fonds National de la Recherche, Luxembourg (AFR grants PHD-08-053).
 This article contains supplemental Figs. S1 to S5 and Tables S1 to S3.
1 The abbreviations used are:
- GC
- Glucocorticoid
- aa
- amino acid
- Ab
- antibody
- AF1
- transactivation domain
- ATP
- Adenosine triphosphate
- Cav-1
- caveolin-1
- cGR
- cytosolic glucocorticoid receptor
- Co-A
- coenzyme-A
- Cort
- cortisol
- Cort-BSA
- BSA-conjugated cortisol
- CoxVb
- Cytochrome C oxidase, subunit Vb
- FBS
- fetal bovine serum
- GC-BSA
- BSA-conjugated Glucocorticoid
- GILZ
- GC-induced leucine zipper
- GR
- glucocorticoid receptor
- HADH
- 3-hydroxyacyl-CoA dehydrogenase type-2
- IPA
- Ingenuity pathway analysis
- mAb
- Monoclonal antibody
- MAT II
- Methionine adenosyltransferase 2
- mGR
- membrane glucocorticoid receptor
- PBS
- Phosphate buffered saline
- PLA
- Proximity ligation assay
- PMT
- Photomultiplier Tubes
- siRNA
- Short interfering RNA.
REFERENCES
- 1. Zanchi N. E., Filho M. A., Felitti V., Nicastro H., Lorenzeti F. M., Lancha A. H., Jr. (2010) Glucocorticoids: extensive physiological actions modulated through multiple mechanisms of gene regulation. J. Cell. Physiol. 224, 311–315 [DOI] [PubMed] [Google Scholar]
- 2. Buttgereit F., Scheffold A. (2002) Rapid glucocorticoid effects on immune cells. Steroids 67, 529–534 [DOI] [PubMed] [Google Scholar]
- 3. Boldizsar F., Talaber G., Szabo M., Bartis D., Palinkas L., Nemeth P., Berki T. (2010) Emerging pathways of non-genomic glucocorticoid (GC) signalling in T cells. Immunobiology 215, 521–526 [DOI] [PubMed] [Google Scholar]
- 4. Haller J., Mikics E., Makara G. B. (2008) The effects of non-genomic glucocorticoid mechanisms on bodily functions and the central neural system. A critical evaluation of findings. Front Neuroendocrinol. 29, 273–291 [DOI] [PubMed] [Google Scholar]
- 5. Gametchu B. (1987) Glucocorticoid receptor-like antigen in lymphoma cell membranes: correlation to cell lysis. Science 236, 456–461 [DOI] [PubMed] [Google Scholar]
- 6. Orchinik M., Murray T. F., Franklin P. H., Moore F. L. (1992) Guanyl nucleotides modulate binding to steroid receptors in neuronal membranes. Proc. Natl. Acad. Sci. U.S.A. 89, 3830–3834 [DOI] [PMC free article] [PubMed] [Google Scholar]
- 7. Orchinik M., Murray T. F., Moore F. L. (1991) A corticosteroid receptor in neuronal membranes. Science 252, 1848–1851 [DOI] [PubMed] [Google Scholar]
- 8. Evans S. J., Moore F. L., Murray T. F. (1998) Solubilization and pharmacological characterization of a glucocorticoid membrane receptor from an amphibian brain. J. Steroid Biochem. Mol. Biol. 67, 1–8 [DOI] [PubMed] [Google Scholar]
- 9. Evans S. J., Murray T. F., Moore F. L. (2000) Partial purification and biochemical characterization of a membrane glucocorticoid receptor from an amphibian brain. J. Steroid Biochem. Mol. Biol. 72, 209–221 [DOI] [PubMed] [Google Scholar]
- 10. Grote H., Ioannou I., Voigt J., Sekeris C. E. (1993) Localization of the glucocorticoid receptor in rat liver cells: evidence for plasma membrane bound receptor. Int J Biochem. 25, 1593–1599 [DOI] [PubMed] [Google Scholar]
- 11. Liposits Z., Bohn M. C. (1993) Association of glucocorticoid receptor immunoreactivity with cell membrane and transport vesicles in hippocampal and hypothalamic neurons of the rat. J. Neurosci. Res. 35, 14–19 [DOI] [PubMed] [Google Scholar]
- 12. Johnson L. R., Farb C., Morrison J. H., McEwen B. S., LeDoux J. E. (2005) Localization of glucocorticoid receptors at postsynaptic membranes in the lateral amygdala. Neuroscience 136, 289–299 [DOI] [PubMed] [Google Scholar]
- 13. Gametchu B., Watson C. S., Shih C. C., Dashew B. (1991) Studies on the arrangement of glucocorticoid receptors in the plasma membrane of S-49 lymphoma cells. Steroids 56, 411–419 [DOI] [PubMed] [Google Scholar]
- 14. Chen F., Watson C. S., Gametchu B. (1999) Association of the glucocorticoid receptor alternatively-spliced transcript 1A with the presence of the high molecular weight membrane glucocorticoid receptor in mouse lymphoma cells. J. Cell. Biochem. 74, 430–446 [PubMed] [Google Scholar]
- 15. Chen F., Watson C. S., Gametchu B. (1999) Multiple glucocorticoid receptor transcripts in membrane glucocorticoid receptor-enriched S-49 mouse lymphoma cells. J. Cell. Biochem. 74, 418–429 [PubMed] [Google Scholar]
- 16. Powell C. E., Watson C. S., Gametchu B. (1999) Immunoaffinity isolation of native membrane glucocorticoid receptor from S-49++ lymphoma cells: biochemical characterization and interaction with Hsp 70 and Hsp 90. Endocrine 10, 271–280 [DOI] [PubMed] [Google Scholar]
- 17. Gametchu B., Watson C. S., Pasko D. (1991) Size and steroid-binding characterization of membrane-associated glucocorticoid receptor in S-49 lymphoma cells. Steroids 56, 402–410 [DOI] [PubMed] [Google Scholar]
- 18. Gametchu B., Watson C. S. (2002) Correlation of membrane glucocorticoid receptor levels with glucocorticoid-induced apoptotic competence using mutant leukemic and lymphoma cells lines. J. Cell. Biochem. 87, 133–146 [DOI] [PubMed] [Google Scholar]
- 19. Gametchu B., Watson C. S., Wu S. (1993) Use of receptor antibodies to demonstrate membrane glucocorticoid receptor in cells from human leukemic patients. FASEB J. 7, 1283–1292 [DOI] [PubMed] [Google Scholar]
- 20. Berki T., Kumánovics G., Kumánovics A., Falus A., Ujhelyi E., Németh P. (1998) Production and flow cytometric application of a monoclonal anti-glucocorticoid receptor antibody. J. Immunol. Methods 214, 19–27 [DOI] [PubMed] [Google Scholar]
- 21. Strehl C., Gaber T., Löwenberg M., Hommes D. W., Verhaar A. P., Schellmann S., Hahne M., Fangradt M., Wagegg M., Hoff P., Scheffold A., Spies C. M., Burmester G. R., Buttgereit F. (2011) Origin and functional activity of the membrane-bound glucocorticoid receptor. Arthritis Rheumatism 63, 3779–3788 [DOI] [PubMed] [Google Scholar]
- 22. Bartholome B., Spies C. M., Gaber T., Schuchmann S., Berki T., Kunkel D., Bienert M., Radbruch A., Burmester G. R., Lauster R., Scheffold A., Buttgereit F. (2004) Membrane glucocorticoid receptors (mGCR) are expressed in normal human peripheral blood mononuclear cells and up-regulated after in vitro stimulation and in patients with rheumatoid arthritis. FASEB J. 18, 70–80 [DOI] [PubMed] [Google Scholar]
- 23. Maier C., Rünzler D., Schindelar J., Grabner G., Waldhausl W., Kohler G., Luger A. (2005) G-protein-coupled glucocorticoid receptors on the pituitary cell membrane. J. Cell Sci. 118, 3353–3361 [DOI] [PubMed] [Google Scholar]
- 24. Gametchu B., Chen F., Sackey F., Powell C., Watson C. S. (1999) Plasma membrane-resident glucocorticoid receptors in rodent lymphoma and human leukemia models. Steroids 64, 107–119 [DOI] [PubMed] [Google Scholar]
- 25. Sackey F. N., Watson C. S., Gametchu B. (1997) Cell cycle regulation of membrane glucocorticoid receptor in CCRF-CEM human ALL cells: correlation to apoptosis. Am. J. Physiol. 273, E571–583 [DOI] [PubMed] [Google Scholar]
- 26. Scheffold A., Assenmacher M., Reiners-Schramm L., Lauster R., Radbruch A. (2000) High-sensitivity immunofluorescence for detection of the pro- and anti-inflammatory cytokines gamma interferon and interleukin-10 on the surface of cytokine-secreting cells. Nat. Med. 6, 107–110 [DOI] [PubMed] [Google Scholar]
- 27. Spies C. M., Schaumann D. H., Berki T., Mayer K., Jakstadt M., Huscher D., Wunder C., Burmester G. R., Radbruch A., Lauster R., Scheffold A., Buttgereit F. (2006) Membrane glucocorticoid receptors are down regulated by glucocorticoids in patients with systemic lupus erythematosus and use a caveolin-1-independent expression pathway. Ann. Rheumatic Dis. 65, 1139–1146 [DOI] [PMC free article] [PubMed] [Google Scholar]
- 28. Spies C. M., Bartholome B., Berki T., Burmester G. R., Radbruch A., Scheffold A., Buttgereit F. (2007) Membrane glucocorticoid receptors (mGCR) on monocytes are up-regulated after vaccination. Rheumatology 46, 364–365 [DOI] [PubMed] [Google Scholar]
- 29. Jain S., Li Y., Kumar A., Sehgal P. B. (2005) Transcriptional signaling from membrane raft-associated glucocorticoid receptor. Biochem. Biophys. Res. Commun. 336, 3–8 [DOI] [PubMed] [Google Scholar]
- 30. Matthews L., Berry A., Ohanian V., Ohanian J., Garside H., Ray D. (2008) Caveolin mediates rapid glucocorticoid effects and couples glucocorticoid action to the antiproliferative program. Mol. Endocrinol. 22, 1320–1330 [DOI] [PMC free article] [PubMed] [Google Scholar]
- 31. Chidlow J. H., Jr., Sessa W. C. (2010) Caveolae, caveolins, and cavins: complex control of cellular signalling and inflammation. Cardiovasc. Res. 86, 219–225 [DOI] [PMC free article] [PubMed] [Google Scholar]
- 32. Razandi M., Oh P., Pedram A., Schnitzer J., Levin E. R. (2002) ERs associate with and regulate the production of caveolin: implications for signaling and cellular actions. Mol. Endocrinol. 16, 100–115 [DOI] [PubMed] [Google Scholar]
- 33. Pike L. J. (2003) Lipid rafts: bringing order to chaos. J. Lipid Res. 44, 655–667 [DOI] [PubMed] [Google Scholar]
- 34. Watson C. S., Jeng Y. J., Hu G., Wozniak A., Bulayeva N., Guptarak J. (2012) Estrogen- and xenoestrogen-induced ERK signaling in pituitary tumor cells involves estrogen receptor-alpha interactions with G protein-alphai and caveolin I. Steroids 77, 424–432 [DOI] [PMC free article] [PubMed] [Google Scholar]
- 35. Liu J., Youn H., Yang J., Du N., Liu J., Liu H., Li B. (2011) G-protein alpha-s and -12 subunits are involved in androgen-stimulated PI3K activation and androgen receptor transactivation in prostate cancer cells. Prostate 71, 1276–1286 [DOI] [PMC free article] [PubMed] [Google Scholar]
- 36. Cato A. C., Nestl A., Mink S. (2002) Rapid actions of steroid receptors in cellular signaling pathways. Sci STKE 2002, re9. [DOI] [PubMed] [Google Scholar]
- 37. Fredriksson S., Gullberg M., Jarvius J., Olsson C., Pietras K., Gústafsdottir S. M., Ostman A., Landegren U. (2002) Protein detection using proximity-dependent DNA ligation assays. Nat. Biotechnol. 20, 473–477 [DOI] [PubMed] [Google Scholar]
- 38. Billing A. M., Fack F., Renaut J., Olinger C. M., Schote A. B., Turner J. D., Muller C. P. (2007) Proteomic analysis of the cortisol-mediated stress response in THP-1 monocytes using DIGE technology. J. Mass Spectrom. 42, 1433–1444 [DOI] [PubMed] [Google Scholar]
- 39. Billing A. M., Fack F., Turner J. D., Muller C. P. (2011) Cortisol is a potent modulator of lipopolysaccharide-induced interferon signaling in macrophages. Innate Immun. 17, 302–320 [DOI] [PubMed] [Google Scholar]
- 40. Billing A. M., Revets D., Hoffmann C., Turner J. D., Vernocchi S., Muller C. P. (2012) Proteomic profiling of rapid non-genomic and concomitant genomic effects of acute restraint stress on rat thymocytes. J. Proteomics 75, 2064–2079 [DOI] [PubMed] [Google Scholar]
- 41. Hoogland C., Walther D., Palagi P. M., Bouchet G., Mostaguir K., Robin X., Appel R. D., Lisacek F. (2008) A suite of tools to analyse and publish 2DE data. Proteomics 8, 4907–9 [DOI] [PubMed] [Google Scholar]
- 42. Livak K. J., Schmittgen T. D. (2001) Analysis of relative gene expression data using real-time quantitative PCR and the 2(-Delta Delta C(T)) Method. Methods 25, 402–408 [DOI] [PubMed] [Google Scholar]
- 43. Towbin H., Staehelin T., Gordon J. (1979) Electrophoretic transfer of proteins from polyacrylamide gels to nitrocellulose sheets: procedure and some applications. Proc. Natl. Acad. Sci. U. S. A. 76, 4350–4354 [DOI] [PMC free article] [PubMed] [Google Scholar]
- 44. Berki T., Kumanovics G., Kumanovics A., Falus A., Ujhelyi E., Nemeth P. (1998) Production and flow cytometric application of a monoclonal anti-glucocorticoid receptor antibody. J. Immunol. Methods 214, 19–27 [DOI] [PubMed] [Google Scholar]
- 45. Campbell C. H., Bulayeva N., Brown D. B., Gametchu B., Watson C. S. (2002) Regulation of the membrane estrogen receptor-alpha: role of cell density, serum, cell passage number, and estradiol. FASEB J. 16, 1917–1927 [DOI] [PMC free article] [PubMed] [Google Scholar]
- 46. Löwenberg M., Stahn C., Hommes D. W., Buttgereit F. (2008) Novel insights into mechanisms of glucocorticoid action and the development of new glucocorticoid receptor ligands. Steroids 73, 1025–1029 [DOI] [PubMed] [Google Scholar]
- 47. Zeng Z., Yang H., Huang Z. Z., Chen C., Wang J., Lu S. C. (2001) The role of c-Myb in the up-regulation of methionine adenosyltransferase 2A expression in activated Jurkat cells. Biochem. J. 353, 163–168 [PMC free article] [PubMed] [Google Scholar]
- 48. Lovgren A. K., Kovarova M., Koller B. H. (2007) cPGES/p23 is required for glucocorticoid receptor function and embryonic growth but not prostaglandin E2 synthesis. Mol. Cell. Biol. 27, 4416–4430 [DOI] [PMC free article] [PubMed] [Google Scholar]
- 49. Hara S., Kamei D., Sasaki Y., Tanemoto A., Nakatani Y., Murakami M. (2010) Prostaglandin E synthases: Understanding their pathophysiological roles through mouse genetic models. Biochimie 92, 651–659 [DOI] [PubMed] [Google Scholar]
- 50. Revollo J. R., Cidlowski J. A. (2009) Mechanisms generating diversity in glucocorticoid receptor signaling. Ann. N.Y. Acad. Sci. 1179, 167–178 [DOI] [PubMed] [Google Scholar]
- 51. Munck A., Guyre P. M., Holbrook N. J. (1984) Physiological functions of glucocorticoids in stress and their relation to pharmacological actions. Endocr. Rev. 5, 25–44 [DOI] [PubMed] [Google Scholar]
- 52. Peckett A. J., Wright D. C., Riddell M. C. (2011) The effects of glucocorticoids on adipose tissue lipid metabolism. Metabolism 60, 1500–1510 [DOI] [PubMed] [Google Scholar]
- 53. Li C., Chen P., Palladino A., Narayan S., Russell L. K., Sayed S., Xiong G., Chen J., Stokes D., Butt Y. M., Jones P. M., Collins H. W., Cohen N. A., Cohen A. S., Nissim I., Smith T. J., Strauss A. W., Matschinsky F. M., Bennett M. J., Stanley C. A. (2010) Mechanism of hyperinsulinism in short-chain 3-hydroxyacyl-CoA dehydrogenase deficiency involves activation of glutamate dehydrogenase. J. Biol. Chem. 285, 31806–31818 [DOI] [PMC free article] [PubMed] [Google Scholar]
- 54. Bender E., Kadenbach B. (2000) The allosteric ATP-inhibition of cytochrome c oxidase activity is reversibly switched on by cAMP-dependent phosphorylation. FEBS Lett. 466, 130–134 [DOI] [PubMed] [Google Scholar]
- 55. Chen Z. X., Pervaiz S. (2010) Involvement of cytochrome c oxidase subunits Va and Vb in the regulation of cancer cell metabolism by Bcl-2. Cell Death Differ. 17, 408–420 [DOI] [PubMed] [Google Scholar]
- 56. Chen H. C., Farese R. V. (1999) Steroid hormones: Interactions with membrane-bound receptors. Curr. Biol. 9, R478–481 [DOI] [PubMed] [Google Scholar]
- 57. Mishra S., Ande S. R., Nyomba B. L. (2010) The role of prohibitin in cell signaling. FEBS J. 277, 3937–3946 [DOI] [PubMed] [Google Scholar]
- 58. Theiss A. L., Sitaraman S. V. (2011) The role and therapeutic potential of prohibitin in disease. Biochim. Biophys. Acta 1813, 1137–1143 [DOI] [PMC free article] [PubMed] [Google Scholar]
- 59. Rougerie P., Delon J. (2012) Rho GTPases: masters of T lymphocyte migration and activation. Immunol. Lett. 142, 1–13 [DOI] [PubMed] [Google Scholar]
- 60. Datson N. A., Speksnijder N., Mayer J. L., Steenbergen P. J., Korobko O., Goeman J., de Kloet E. R., Joëls M., Lucassen P. J. (2012) The transcriptional response to chronic stress and glucocorticoid receptor blockade in the hippocampal dentate gyrus. Hippocampus 22, 359–371 [DOI] [PubMed] [Google Scholar]
- 61. Tsuji Y., Hatanaka M., Maeda T., Seya T., Takenaka H., Shimizu A. (2005) Differential-expression and tyrosine-phosphorylation profiles of caveolin isoforms in human T cell leukemia cell lines. Int. J. Mol. Med. 16, 889–893 [PubMed] [Google Scholar]
- 62. Tsuji Y., Nakagawa T., Hatanaka M., Takeuchi T., Matsumoto E., Takenaka H., Shimizu A. (2006) Quantification of caveolin isoforms using quantitative real-time RT-PCR, and analysis of promoter CpG methylation of caveolin-1alpha in human T cell leukemia cell lines. Int. J. Mol. Med. 18, 489–495 [PubMed] [Google Scholar]
Associated Data
This section collects any data citations, data availability statements, or supplementary materials included in this article.