

Abstract
Understanding epistasis is central to biology. For instance, epistatic interactions determine the topography of the fitness landscape and affect the dynamics and determinism of adaptation. However, few empirical data are available, and comparing results is complicated by confounding variation in the system and the type of mutations used. Here, we take a systematic approach by quantifying epistasis in two sets of four beneficial mutations in the antibiotic resistance enzyme TEM-1 β-lactamase. Mutations in these sets have either large or small effects on cefotaxime resistance when present as single mutations. By quantifying the epistasis and ruggedness in both landscapes, we find two general patterns. First, resistance is maximal for combinations of two mutations in both fitness landscapes and declines when more mutations are added due to abundant sign epistasis and a pattern of diminishing returns with genotype resistance. Second, large-effect mutations interact more strongly than small-effect mutations, suggesting that the effect size of mutations may be an organizing principle in understanding patterns of epistasis. By fitting the data to simple phenotype resistance models, we show that this pattern may be explained by the nonlinear dependence of resistance on enzyme stability and an unknown phenotype when mutations have antagonistically pleiotropic effects. The comparison to a previously published set of mutations in the same gene with a joint benefit further shows that the enzyme's fitness landscape is locally rugged but does contain adaptive pathways that lead to high resistance.
Keywords: epistasis, beneficial mutations, fitness landscape, antibiotic resistance, β-lactamase
Introduction
Epistasis describes the phenomenon that mutations can have different phenotypic effects depending on the genetic background on which they occur. Epistatic interactions among mutations are important because they influence the course of evolution and may reveal how biological functions are built from their molecular components. For instance, epistasis affects the dynamics and repeatability of evolution (Weinreich et al. 2005; Salverda et al. 2011; Woods et al. 2011; Blount et al. 2012; Szendro, Franke, et al. 2013), the divergence and reproductive isolation of species (Orr and Turelli 2001; Dettman et al. 2007), and the evolution of sexual reproduction (Kondrashov 1988; de Visser et al. 2009). When epistasis affects the sign of the fitness effects of mutations—and beneficial mutations turn deleterious on different genetic backgrounds or vice versa—it has a particularly strong impact on natural selection. It may render mutational pathways effectively inaccessible (Weinreich et al. 2005) and enhance the contingency of mutational pathways on early mutations (Kvitek and Sherlock 2011; Salverda et al. 2011), or open up new pathways (Weinreich et al. 2006; Salverda et al. 2011). Magnitude epistasis affects only the magnitude of the mutational fitness effects but can influence the likelihood that particular mutational pathways are taken and thereby contribute to declining rates of adaptation observed in constant environments (MacLean et al. 2010; Chou et al. 2011; Khan et al. 2011).
Despite its fundamental role in biology, we know little about the general pattern of epistasis in real organisms. Earlier studies looked for epistasis among pairs of—often deleterious—mutations and found widespread magnitude epistasis and substantial sign epistasis (reviewed in Kouyos et al. 2007; de Visser et al. 2011). Typically, studies involving more than two mutations quantified the unidimensional relationship between average fitness and mutation number. These studies thus neglected much of the higher order epistatic interactions that may also affect the topography and accessibility of the fitness landscape (Wright 1932; Kondrashov FA and Kondrashov AS 2001; Carneiro and Hartl 2009; Franke et al. 2011; Lobkovsky et al. 2011; Poelwijk et al. 2011). Recent studies have begun to systematically explore multidimensional patterns of epistasis by engineering mutants carrying all possible combinations of small sets of mutations and characterizing the local fitness landscape involved (reviewed in Szendro, Schenk, et al. 2013). These studies have found substantial but varying levels of epistasis, including sign epistasis, and prevailing negative epistasis among beneficial mutations. However, drawing general conclusions is hampered by the variation in the experimental systems and mutations involved. For instance, the mutations involved vary with respect to the sign and size of their fitness effects, were either selected from fit combinations or for their individual effect, and occur in the same or in different genes. Such differences are likely to bias the observed pattern of epistasis (Szendro, Schenk, et al. 2013), and it is therefore imperative to distinguish between methodological and biological factors that are of influence.
We present a comparative analysis of the pattern of epistasis among two sets of beneficial mutations in the antibiotic resistance enzyme TEM-1 β-lactamase, one with small and the other with large effects on resistance to the antibiotic cefotaxime (Ctx). Our focus on the effect size of beneficial mutations is motivated by the prediction that combinations of large-effect mutations are more likely to be affected by nonlinear areas of the phenotype-fitness map than combinations of small-effect mutations (Pumir and Shraiman 2011). Support for this prediction exists for deleterious mutations, based on a positive correlation between the effect size of mutations and the strength of epistasis observed in models (Wilke and Adami 2001; You and Yin 2002; Pumir and Shraiman 2011) and experiments (Bershtein et al. 2006; Trindade et al. 2009; MacLean 2010). We constructed mutants carrying all 16 possible combinations within each set and measured their effect on Ctx resistance as a proxy for fitness. On the basis of the comparative analysis of four measures of epistasis or landscape ruggedness, we find that the fitness landscape of large-effect mutations is more rugged than the landscape of small-effect mutations. In turn, both landscapes display stronger epistasis than a previously published landscape of four mutations in the same enzyme that were identified in a highly resistant combination (Weinreich et al. 2006). We further show that a simple model that relates resistance to the enzyme's stability and an unknown phenotype can explain the pervasiveness of sign epistasis in our landscapes and its dependence on the effect size of beneficial mutations when mutations have antagonistically pleiotropic effects.
Results
Fitness Landscapes of Beneficial Mutations
We recently identified 48 mutations in the TEM-1 β-lactamase gene that significantly increase resistance to the third-generation cephalosporin Ctx (Schenk et al. 2012). To quantify the epistatic interactions between these beneficial mutations, we constructed two local fitness landscapes by introducing all 16 (=24) combinations of four mutations in the background of TEM-1 using site-directed mutagenesis. All examined mutations lead to an amino acid replacement in the mature protein. The “large-effect landscape” contains the mutations E104K, R164S, G238S, and R241P, the “small-effect landscape” contains the mutations E171G, I173V, S235T, and G267R. We determined the Ctx resistance of all combinations by estimating the inhibitory concentration of Ctx that kills 99.99% of the bacterial cells (IC99.99; supplementary tables S1 and S2, Supplementary Material online). The IC99.99 values vary significantly between genotypes in both landscapes (large: F15,32 = 1,472.36, P < 0.001; small F15,48 = 120.60, P < 0.001) and range from 1.9 to 224 and 0.8 to 3.1-fold improvement relative to TEM-1 for large- and small-effect landscapes, respectively. Post hoc Tukey tests show that resistance differs significantly between all 24 adjacent genotype pairs (i.e., Hamming distance = 1) in the large-effect landscape, this is true for 17 pairs in the small-effect landscape (supplementary tables S1 and S2, Supplementary Material online).
Comparative Analysis of Epistasis and Landscape Ruggedness
To compare the pattern of epistasis in both landscapes, we first consider their general topography. Figure 1 shows all 24 mutational trajectories that lead from the ancestral genotype to the 4-fold mutants and display the resistance levels of the 16 genotypes along these trajectories. Accessibility of these trajectories is severely constrained, highlighting the abundance of sign epistasis. For comparison, we also show a previously published landscape (fig. 1C) of four mutations in the same gene that were derived from a highly Ctx-resistant mutant (Weinreich et al. 2006). This landscape shares the mutations E104K and G238S with the large-effect landscape. The most striking difference is that the 4-fold mutant represents the global maximum in the latter landscape, whereas the 4-fold mutants in the large- and small-effect landscapes have a relatively low resistance (rank 14 and 13 out of 16; supplementary tables S1 and S2, Supplementary Material online), and the global maxima occur at genotypes carrying two mutations, respectively, at E104K + G238S and I173V + S235T (see supplementary fig. S1, Supplementary Material online, for a mutational network representation). In addition, the large-effect landscape contains a local maximum (E104K + R164S). Thus, mutations that each increase resistance in the background of TEM-1 have limited long-term adaptive value, due to sign epistasis causing average resistance to decline when more than two mutations are combined.
Fig. 1.

Three local fitness landscapes based on four mutations in the TEM β-lactamase gene that improve Ctx resistance: (A) large-effect mutations, (B) small-effect mutations, and (C) a previously published set of mutations identified in a highly resistant combination (Weinreich et al. 2006). The relationship between improvement of Ctx resistance relative to TEM-1 (on a 2log scale) is shown as function of the number of mutations (0–4) involved. Nodes represent genotypes, and lines connect adjacent genotypes (Hamming distance = 1). The nodes that represent peaks in the landscapes are labeled. Red lines indicate cases where adding a mutation decreases Ctx resistance, hence show sign epistasis. Dashed lines indicate cases where the addition of a mutation did not have significant effect on resistance. Resistance levels in (C) were transformed from minimal inhibitory concentration to IC99.99 scales using the relation described in supplementary figure S2, Supplementary Material online. Only the four amino acid replacements in the mature TEM protein in this latter landscape were included in the figure. *1 indicates values that overlap in reality, but have been slightly displaced for clarity.
Second, we quantified epistasis for all mutants carrying multiple mutations by calculating the difference between observed and expected resistance without epistasis. Both landscapes are dominated by negative epistasis: 18 of the 22 combinations show significant negative epistasis and only three show positive epistasis (supplementary tables S1 and S2, Supplementary Material online). Several recent studies have found a pattern of diminishing returns epistasis among beneficial mutations, where the negative epistatic deviation from a null model increases with the expected benefit (MacLean et al. 2010; Chou et al. 2011; Khan et al. 2011; Nagel et al. 2012). To test for such pattern in our data, we plotted epistasis, εm, against the expected normalized resistance (fig. 2). Both the large- (r = −0.85, n = 11, P < 0.001) and small-effect landscapes (r = −0.75, n = 11, P = 0.0079) indeed show a negative correlation between epistasis and expected benefit. However, different from earlier studies (MacLean et al. 2010; Chou et al. 2011; Khan et al. 2011; Nagel et al. 2012), εm not only shows a negative dependence on expected resistance but is also negative in sign for most genotypes. Based on the contribution of each mutation to resistance across genetic backgrounds (supplementary fig. S3, Supplementary Material online), it can be seen that not all mutations contribute equally to the overall pattern of diminishing returns: The effects of the mutations G267R, E171G, E104K, and I173V are idiosyncratic across backgrounds, with only I173V being unconditionally beneficial.
Fig. 2.

Relationship between epistasis (εm) and expected fitness under the null model (no epistasis). The negative pattern shows that epistasis is largest in the combinations that are expected to have the highest resistance. Log-transformed data are normalized to a scale from 0 (TEM-1) to 1 (maximum) to allow for the comparison between large-effect (black symbols) and small-effect (red symbols) landscapes in a single view. Genotypes carry two (squares), three (triangles), or four mutations (circles).
Next, we analyzed four measures of landscape ruggedness that were used in a recent meta-analysis of empirical fitness landscapes (Szendro, Schenk, et al. 2013). These include 1) the roughness-to-slope ratio, r/s, which measures how well the landscape is described by a linear model; 2) the fraction of the total variation in resistance explained by two-way, three-way, and four-way interactions among mutations, Fsum; 3) the fraction of pairwise interactions that show sign or reciprocal sign epistasis, fs + fr; and 4) the number of pathways to the global maximum from its antipode where resistance increases with each mutational step, Ncp. Although fs + fr measures local ruggedness, the other three measures are affected by local and global contributions of epistasis. These measures show two main patterns (fig. 3). First, both landscapes show substantial ruggedness but less than would be expected for a maximally rugged landscape (indicated by the dashed lines in fig. 3). Second, they consistently show that the large-effect landscape is more rugged than the small-effect landscape, although the differences are significant only for r/s and Fsum (P < 0.01 based on resampling the data 10,000 times [see Materials and Methods]; for Ncp and fs + fr, P values are 0.063 and 0.320, respectively). These results therefore support the prediction that large-effect beneficial mutations show more epistasis than small-effect mutations.
Fig. 3.

Comparison of epistasis in the large and small-effect landscapes using four ruggedness measures (Szendro, Schenk, et al. 2013). The roughness-to-slope ratio (r/s) and the fraction of the variation in resistance explained by all interaction terms (Fsum) both provide measures of how well the landscape can be described by a linear model and are affected by pairwise and higher order interactions. The Ncp measure counts the number of accessible paths to the global maximum from its antipode (i.e., Hamming distance = 4), where each of the four steps increase resistance. Finally, fs + fr quantifies the fraction of mutation pairs that display the strongest forms of epistasis, that is, sign or reciprocal sign epistasis. The central line of the box plots indicate the median, the borders of the box the 25th and the 75th percentile, and error bars the 1st and the 99th percentile, which are based on resampling the data. The dashed and dash-dotted lines show the expectation for a maximally rugged and an additive landscape, respectively.
Explaining Epistasis from the Nonlinear Mapping of Phenotypes on Resistance
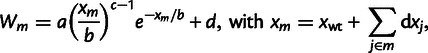
To understand the abundance of epistasis and its dependence on the effect size of beneficial mutations, we compare the fit of two simple models to the data of both landscapes (31 genotypes; allele TEM-1 is shared by both landscapes). Both models assume additive effects (no epistasis) of mutations on the underlying phenotype(s) and thus explain epistasis from the nonlinear mapping of the phenotype(s) onto resistance. The first model assumes a single (unknown) underlying phenotype and explains sign epistasis from overshooting the optimum (Rokyta et al. 2011). It is defined by
 |
[1] |
where  's are fitted to the logarithms of the IC99.99 values, and the
  's are the phenotypic effects of the individual point mutations
  . The sum runs over all mutations present in mutant m. This model has 12 parameters (
 ,
,  ,
,  ,
,  , and the eight
  's), whose values are estimated from the data. The value of
  is not fitted but set to an arbitrary value. This introduces an arbitrary scale, which is compensated by dividing by the free parameter
  .
.
Although this model provides a reasonable representation of the data (fig. 4A and B), the best fit is achieved when some of the small-effect mutations have much larger phenotypic effects than any of the four large-effect mutations, which is counter intuitive. Furthermore, because of the assumed small phenotypic effects of certain point mutations, the fit predicts very similar resistance values for groups of mutants, which is not observed in the data. These two features suggest a systematic failure of the single-phenotype model to explain the data.
Fig. 4.

Explanation of the observed epistasis from the nonlinear dependence of Ctx resistance on one or two underlying phenotypes. (A) Fit of a gamma function relating a single phenotype to resistance of the 31 unique genotypes of both landscapes. The model assumes additive effects of mutations on the underlying phenotype. (B) Quality of the fit of the single-phenotype model shown by the correlation between expected and observed effects of mutations on Ctx resistance. (C) Fit of the model that relates resistance to two phenotypes. One phenotype is enzyme stability, for which the model uses fixed estimates from the FoldX routine, effects on the other phenotype are estimated by fitting the model (see text and Materials and Methods for details); mutation effects on both phenotypes are assumed to combine additively and phenotypes have independent effects on resistance. Curved lines indicate lines of equal resistance, where values are log[IC99.99] values and shading indicates their gradient from low values (dark) to high values (light). For better visibility, the marked section is shown magnified and rotated in supplementary figure S4, Supplementary Material online. (D) Quality of the fit of the two-phenotype model.
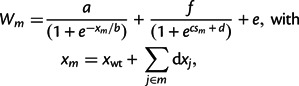
We, therefore, introduce a second model that maps an unknown phenotype and a known phenotype, thermodynamic stability, to resistance. Thermodynamic stability is a key determinant of enzyme function (DePristo et al. 2005; Soskine and Tawfik 2010), and we can infer mutational effects on enzyme stability using the FoldX routine (see Materials and Methods). To reduce the number of parameters, and in contrast to previous work using a two-phenotype model (Martin et al. 2007), the model does not assume the existence of an optimal phenotype. Instead, we take resistance to saturate to constant values for large and small values of the phenotypic variables, and the two phenotypes are assumed to act multiplicatively on resistance. A simple parametrization that is consistent with these assumptions is
 |
[2] |
where again  's are fitted to the logarithms of the IC99.99 values,
  's are the calculated
  values of mutant m (see Materials and Methods), and the
  's the individual effects of the point mutations on the second, unknown, phenotype.
Numerous models can be conceived that relate resistance to two underlying phenotypes. Our particular model [2] is arguably the simplest two-phenotype model for explaining epistasis, because it assumes 1) additive effects of mutations on both phenotypes, 2) independent effects (i.e., multiplicative effects, because we use log resistance values to fit the additive model) of the phenotypes on resistance, and 3) no phenotypic optima but phenotypic maxima that are asymptotically approached. A further realistic feature is that resistance is bounded from below by the parameter  , which corresponds to the residual resistance that is achieved when the enzyme is nonfunctional. As we do not know what the second phenotype corresponds to, its effect could in principle follow a different functional form than that of stability, but for simplicity and to keep the number of free parameters as small as possible, we choose the dependence of resistance on the two phenotypes to be of the same form.
The two-phenotype model [2] has 14 free parameters ( ,
,  ,
,  ,
,  ,
,  , f, and the eight
  's), two more than the one-phenotype model [1], and its performance in terms of the squared fitting error
  is only slightly better (
 ,
,  ; note that these errors constitute upper bounds, as we cannot be certain to have found the truly optimal fits). Importantly, however, it does not seem to suffer from the systematic errors of the single-phenotype model [1] (fig. 4C and D and supplementary fig. S4, Supplementary Material online), as errors are more homogeneously distributed among mutants and mutations with small effect on resistance also have small phenotypic effects. As can be seen in figure 4C and supplementary figure S4, Supplementary Material online, sign epistasis in this model arises from the curvature of the phenotype resistance map on which the position of the mutants is severely constrained by antagonistically pleiotropic effects of mutations on both phenotypes: Positive effects on resistance from the unknown phenotype are counteracted by negative effects from decreased enzyme stability with the net result that resistance declines on average when more than two mutations are combined.
Discussion
Epistasis plays a central role in biology. Developmental and systems biologists seek to understand the physical, biochemical, and physiological causes of epistasis, whereas evolutionary biologists study its evolutionary consequences (Costanzo et al. 2010; de Visser et al. 2011; Lehner 2011; Wagner and Zhang 2011). One line of research is to build biochemical or metabolic models that predict epistasis (Dean et al. 1986; Szathmáry 1993; Segrè et al. 2005) and test these with empirical data. Another way forward is to study empirical patterns of epistasis and identify organizing principles. At present, a lack of empirical data hampers both approaches. Moreover, inferring general patterns of epistasis is complicated by confounding methodological issues across studies, including variation in the sign and size of fitness effects and in the location (in a single or in multiple genes) of the examined mutations (Szendro, Schenk, et al. 2013).
This study attempts to bridge these approaches and circumvent methodological issues by searching for patterns of epistasis among large- and small-effect beneficial mutations occurring in the same gene—the antibiotic resistance gene TEM-1 β-lactamase—and using simple models to interpret the results based on two enzyme properties. All examined mutations increased bacterial resistance to the antibiotic Ctx in the TEM-1 background as single mutations. We examined five measures of epistasis or landscape ruggedness and obtained support for two general conclusions. First, we found a high incidence of sign epistasis. Evidence that sign epistasis is abundant is accumulating; it has been detected among mutations in the same and in different genes in viruses, bacteria, fungi, and yeast, reviewed in Weinreich et al. (2005) and Szendro, Schenk, et al. (2013). It has been suggested that epistasis is stronger among mutations in the same gene than among mutations in different genes (Poon and Chao 2005; Watson et al. 2010), but confounding methodological variation across studies has prevented solid tests (Szendro, Schenk, et al. 2013). The relatively slow rate of expansion of the “protein universe” (Povoltskaya and Kondrashov 2010) and discrepancy between long and short-term amino acid substitution rates (Breen et al. 2012) also suggest constraints from sign epistasis in protein evolution.
Second, we found support for the notion that large-effect beneficial mutations interact more strongly than small-effect mutations. This confirms findings from previous studies based on models and experiments involving deleterious mutations (Wilke and Adami 2001; You and Yin 2002; Trindade et al. 2009; MacLean et al. 2010; Pumir and Shraiman 2011; Lalic and Elena 2012) and suggests that the effect size of mutations may be an organizing principle for understanding patterns of epistasis. Similar studies of other data sets would be highly desirable to strengthen this conclusion and overcome the statistical limitations of our work, which is based on a single pair of landscapes. Intriguingly, both landscapes are much more rugged than a previously reported landscape for the same gene (fig. 1). Two recently published landscapes involving beneficial mutations in different bacterial genes (Chou et al. 2011; Khan et al. 2011) show an overall pattern of diminishing returns similar to the pattern that we observe (fig. 2) but with no (Chou et al. 2011) or very little (Khan et al. 2011) sign epistasis. The lower incidence of epistasis in previously examined landscapes may partly be explained by the fact that the involved mutations co-occurred in high-fitness genotypes (Weinreich et al. 2006; Chou et al. 2011; Khan et al. 2011) and hence had survived the filter of natural selection. Although two mutations in the large-effect landscape (G238S and R164S) were known to interact negatively from previous work (Giakkoupi et al. 2000; Salverda et al. 2011), the mutations we study were not chosen on the basis of their combined effect but solely because they represented mutations of large or small individual benefit. However, we like to emphasize that our results may also yield a biased pattern, because we excluded mutations that are neutral or deleterious in the background of TEM-1, whereas they may increase resistance in the presence of other beneficial mutations, such as the global suppressor mutation M182T (Salverda et al. 2010).
We found that a model that relates Ctx resistance to enzyme stability and a second property can reasonably explain both the observed abundance of epistasis and its dependence on the effect size of mutations in TEM-1 β-lactamase. Previous studies have also explained epistasis from the nonlinear dependence of fitness on underlying phenotypes. For instance, Kvitek and Sherlock (2011) and Nagel et al. (2012) evoked an intrinsic fitness maximum due to some intrinsic physiological constraint, but this cannot explain epistasis in our case, because resistance decreases for more than two mutations in both landscapes, whereas the optima occur at very different levels. Rokyta et al. (2011) found a reasonable fit of a single-phenotype model to explain the observed sign epistasis in mutants of ssDNA bacteriophage D11 carrying one or two mutations, but the fit obtained for this model seems to suffer from systematic errors for our data (see fig. 4A and B). The reasonable fit of the simple two-phenotype model (fig. 4C and D and supplementary fig. S4, Supplementary Material online) is consistent with a key role of enzyme stability in determining enzyme function, as well as with the predicted trade-off between enzyme stability and other key properties, such as enzyme activity, leading to antagonistically pleiotropic effects of beneficial mutations (Wang et al. 2002; DePristo et al. 2005; Soskine and Tawfik 2010). Clearly, direct measurements of mutational effects on key enzyme properties, such as enzyme stability and activity, are imperative to test the assumptions of our simple model, including the absence of epistatic effects at the level of the underlying phenotypes.
The results from our study together with those from Weinreich et al. (2006) yields a picture of a fitness landscape of TEM-1 β-lactamase that is locally very rugged but does contain accessible pathways toward high fitness. The extent to which epistasis constrains adaptation on any landscape depends on the relative frequency of beneficial mutations at each step. Sign epistasis changes the identity of beneficial mutations: It causes mutations that are beneficial in the progenitor background to be no longer beneficial after the first step but at the same time renders mutations that are deleterious or neutral in the progenitor to become available for adaptation. Whether epistasis also affects the total number of beneficial mutations and the distribution of their fitness effects at each step, and hence the dynamics of phenotypic adaptation, may seem likely but is presently unknown (MacLean et al. 2010; Kryazhimskiy et al. 2012). Future studies should preferably address these questions in unbiased ways by considering epistasis among random mutations, rather than (individually or jointly) beneficial or deleterious mutations.
Materials and Methods
Beneficial Mutations and Construction of Genotypes
All genotypes were constructed using the pACSE3 plasmid into which TEM-1 has been cloned after amplification from pBR322 to yield the pACTEM1 plasmid (Barlow and Hall 2002). By running successive rounds of site-directed mutagenesis using the QuikChange Site-Directed Mutagenesis Kit (Stratagene), we constructed all possible combinations within two sets of four mutations, resulting in two fitness landscapes of 16 genotypes each (supplementary tables S1 and S2, Supplementary Material online). The TEM locus of mutants was sequenced to verify the introduction of the desired mutations without additional mutations.
All plasmids were introduced into Escherichia coli strain DH5αE by transformation. Single clones of each genotype were grown overnight at a constant temperature of 37°C in LB broth containing 15 μg tetracycline/ml (pACTEM1 carries a tetracycline resistance gene). Glycerol was added, and stock cultures were stored at −80°C. Expression of the TEM gene is controlled by the pTac promoter that is regulated by the lacI repressor present on pACTEM1. In the resistance assays, expression of TEM was induced by 50 µM isopropyl beta-D-1-thiogalactopyranoside to mimic natural expression levels (Barlow and Hall 2002).
Ctx Resistance Measurements
We measured Ctx resistance of all genotypes by determining survival probabilities using an agar plate assay (Schenk et al. 2012). Ten-fold dilutions of exponentially growing cultures were spread onto a series of LB plates with a 2-fold dilution of Ctx ranging from 0.015625 to 64 μg/ml and 50 µM IPTG. The number of colonies on each plate was counted after 40 h to derive the fraction of survivors relative to the colony numbers on plates without Ctx. The Ctx concentration that inhibits survival of 99.99% of the cells (IC99.99) is estimated using linear interpolation between the surviving fractions at the two adjacent Ctx concentrations and serves as a measure of the resistance level. Genotypes were assayed in triplicate (large-effect landscape) or quadruplicate (small-effect landscape) in a blocked design with replicates present in different blocks.
Analysis of Epistasis
We analyzed the fitness landscape using five measures of epistasis or landscape ruggedness. We first normalized the Ctx resistance measure IC99.99 of each mutant by that of TEM-1 and then log-transformed these estimates using the 2log to yield “doublings in resistance" to remove the positive correlation between mean and replica variance in IC99.99 estimates (before r = 0.97; after r = 0.07), allowing parametric tests. We define epistasis by the deviation of the log-transformed estimates from an additive model, 
 , where
  correspond to the 2log(IC99.99) levels of some mutant carrying m point mutations and the
  correspond to the individual effects of point mutations at locus
  with respect to the wild type (Sanjuán and Elena 2006). The sum runs over all point mutations present in mutant m. Note that the additive model on log-transformed resistance data corresponds to a multiplicative null model for the untransformed resistance data. Whether
  differed significantly from zero was tested using one-sample two-tailed t-tests with serial-Bonferroni correction.
The four ruggedness measures r/s, Fsum, fs + fr, and Ncp that were used to compare large and small-effect landscapes are taken from and explained in detail in a recent meta-analysis of empirical fitness landscapes (Szendro, Schenk, et al. 2013). We estimated 99%-confidence limits of each estimate based on resampling the log(IC99.99) value of each genotype 10,000 times from a Gaussian distribution with mean and standard deviation based on the replicate measurements for each mutant. As a reference, we also calculated these four measures for the two extremes (no epistasis and maximal ruggedness) using a simplified version of the Rough Mount Fuji model, as explained in Szendro, Schenk, et al. (2013).
Phenotype Resistance Models
The effects of the mutations on thermodynamic stability were computed using the protein design tool FoldX (version 3.0) following the procedure described in Tokuriki et al. (2007). The TEM-1 structure (PDB: 1XPB) was used to calculate the  values of the 31 mutant genotypes of both landscapes; FoldX assumes additivity of mutational effects. These values were normalized, using (
 FoldX + 0.078)/1.14, before fitting the model. The fitting was done by numerically minimizing the squared error
  , by means of a Levenberg–Marquardt algorithm, where
  's are the logarithms of the corresponding IC99.99 values. The parameter space has many dimensions and
  contains a large number of local minima with respect to the parameter choices. We, therefore, cannot guarantee that the best possible fits were found, but present the best fits encountered when repeating the fitting procedure 68 times for model [1] and 98 times for model [2] for different starting values of the fitting parameters
  .
.
Supplementary Material
Supplementary figures S1–S4 and tables S1 and S2 are available at Molecular Biology and Evolution online (http://www.mbe.oxfordjournals.org/).
Acknowledgments
The authors thank Bertha Koopmanschap and Jasper Franke for help with the experiments. This work was supported by Deutsche Forschungsgemeinschaft (http://www.dfg.de) within SFB 680 “Molecular Basis of Evolutionary Innovations.”
References
- Barlow M, Hall BG. Predicting evolutionary potential: in vitro evolution accurately reproduces natural evolution of the TEM beta-lactamase. Genetics. 2002;160:823–832. doi: 10.1093/genetics/160.3.823. [DOI] [PMC free article] [PubMed] [Google Scholar]
- Bershtein S, Segal M, Bekerman R, Tokuriki N, Tawfik DS. Robustness-epistasis link shapes the fitness landscape of a randomly drifting protein. Nature. 2006;444:929–932. doi: 10.1038/nature05385. [DOI] [PubMed] [Google Scholar]
- Blount ZD, Barrick JE, Davidson CJ, Lenski RE. Genomic analysis of a key innovation in an experimental Escherichia coli population. Nature. 2012;489:513–518. doi: 10.1038/nature11514. [DOI] [PMC free article] [PubMed] [Google Scholar]
- Breen MS, Kemena C, Vlasov PK, Notredame C, Kondrashov FA. Epistasis as the primary factor in molecular evolution. Nature. 2012;490:535–538. doi: 10.1038/nature11510. [DOI] [PubMed] [Google Scholar]
- Carneiro M, Hartl DL. Adaptive landscapes and protein evolution. Proc Natl Acad Sci U S A. 2009;107:1747–1751. doi: 10.1073/pnas.0906192106. [DOI] [PMC free article] [PubMed] [Google Scholar]
- Chou H-H, Chiu H-C, Delaney NF, Segrè D, Marx CJ. Diminishing returns epistasis among beneficial mutations decelerates adaptation. Science. 2011;332:1190–1192. doi: 10.1126/science.1203799. [DOI] [PMC free article] [PubMed] [Google Scholar]
- Costanzo M, Baryshnikova A, Bellay J, et al. (53 co-authors) The genetic landscape of a cell. Science. 2010;327:425–431. doi: 10.1126/science.1180823. [DOI] [PMC free article] [PubMed] [Google Scholar]
- de Visser JAGM, Cooper TF, Elena SF. The causes of epistasis. Proc Biol Sci. 2011;278:3617–3624. doi: 10.1098/rspb.2011.1537. [DOI] [PMC free article] [PubMed] [Google Scholar]
- de Visser JAGM, Park S-C, Krug J. Exploring the effect of sex on empirical fitness landscapes. Am Nat. 2009;174:S15–S30. doi: 10.1086/599081. [DOI] [PubMed] [Google Scholar]
- Dean AM, Dykhuizen DE, Hartl DL. Fitness as a function of beta-galactosidase function in Escherichia coli. Genet Res. 1986;48:1–8. doi: 10.1017/s0016672300024587. [DOI] [PubMed] [Google Scholar]
- DePristo MA, Weinreich DM, Hartl DL. Missense meanderings in sequence space: a biophysical view of protein evolution. Nat Rev Genet. 2005;6:678–687. doi: 10.1038/nrg1672. [DOI] [PubMed] [Google Scholar]
- Dettman JR, Sirjusingh C, Kohn LM, Anderson JB. Incipient speciation by divergent adaptation and antagonistic epistasis in yeast. Nature. 2007;447:585–588. doi: 10.1038/nature05856. [DOI] [PubMed] [Google Scholar]
- Franke J, Klözer A, de Visser JAGM, Krug J. Evolutionary accessibility of mutational pathways. PLoS Comp Biol. 2011;7:e1002134. doi: 10.1371/journal.pcbi.1002134. [DOI] [PMC free article] [PubMed] [Google Scholar]
- Giakkoupi P, Tzelepi E, Tassios PT, Legakis NJ, Tzouvelekis LS. Detrimental effect of the combination of R164S with G238S in TEM-1 beta-lactamase on the extended-spectrum activity conferred by a single mutation. J Antimicrob Chemother. 2000;45:101–104. doi: 10.1093/jac/45.1.101. [DOI] [PubMed] [Google Scholar]
- Khan AI, Dinh DM, Schneider D, Lenski RE, Cooper TF. Negative epistasis between beneficial mutations in an evolving bacterial population. Science. 2011;332:1193–1196. doi: 10.1126/science.1203801. [DOI] [PubMed] [Google Scholar]
- Kondrashov AS. Deleterious mutations and the evolution of sexual reproduction. Nature. 1988;336:435–440. doi: 10.1038/336435a0. [DOI] [PubMed] [Google Scholar]
- Kondrashov FA, Kondrashov AS. Multidimensional epistasis and the disadvantage of sex. Proc Natl Acad Sci U S A. 2001;98:12089–12092. doi: 10.1073/pnas.211214298. [DOI] [PMC free article] [PubMed] [Google Scholar]
- Kouyos RD, Silander OK, Bonhoeffer S. Epistasis between deleterious mutations and the evolution of recombination. Trends Ecol Evol. 2007;22:308–315. doi: 10.1016/j.tree.2007.02.014. [DOI] [PubMed] [Google Scholar]
- Kryazhimskiy S, Rice DP, Desai MM. Population subdivision and adaptation in asexual populations of Saccharomyces cerevisiae. Evolution. 2012;66:1931–1941. doi: 10.1111/j.1558-5646.2011.01569.x. [DOI] [PubMed] [Google Scholar]
- Kvitek DJ, Sherlock G. Reciprocal sign epistasis between frequently experimentally evolved adaptive mutations causes a rugged fitness landscape. PLoS Genet. 2011;7:e1002056. doi: 10.1371/journal.pgen.1002056. [DOI] [PMC free article] [PubMed] [Google Scholar]
- Lalic J, Elena SF. Magnitude and sign epistasis among deleterious mutations in a positive-sense plant RNA virus. Heridity. 2012;109:71–77. doi: 10.1038/hdy.2012.15. [DOI] [PMC free article] [PubMed] [Google Scholar]
- Lehner B. Molecular mechanisms of epistasis within and between genes. Trends Genet. 2011;27:323–331. doi: 10.1016/j.tig.2011.05.007. [DOI] [PubMed] [Google Scholar]
- Lobkovsky AE, Wolf YI, Koonin EV. Predictability of evolutionary trajectories in fitness landscapes. PLoS Comp Biol. 2011;7:e1002302. doi: 10.1371/journal.pcbi.1002302. [DOI] [PMC free article] [PubMed] [Google Scholar]
- MacLean RC. Predicting epistasis: an experimental test of metabolic control theory with bacterial transcription and translation. J Evol Biol. 2010;23:488–493. doi: 10.1111/j.1420-9101.2009.01888.x. [DOI] [PubMed] [Google Scholar]
- MacLean RC, Perron GG, Gardner A. Diminishing returns from beneficial mutations and pervasive epistasis shape the fitness landscape for rifampicin resistance in Pseudomonas aeruginosa. Genetics. 2010;186:1345–1354. doi: 10.1534/genetics.110.123083. [DOI] [PMC free article] [PubMed] [Google Scholar]
- Martin G, Elena SF, Lenormand T. Distributions of epistasis in microbes fit predictions from a fitness landscape model. Nat Genet. 2007;33:555–560. doi: 10.1038/ng1998. [DOI] [PubMed] [Google Scholar]
- Nagel AC, Joyce P, Wichman HA, Miller CR. Stickbreaking: a novel fitness landscape model that harbors epistasis and is consistent with commonly observed patterns of adaptive evolution. Genetics. 2012;190:655–667. doi: 10.1534/genetics.111.132134. [DOI] [PMC free article] [PubMed] [Google Scholar]
- Orr HA, Turelli M. The evolution of postzygotic isolation: accumulating Dobzhansky-Muller incompatibilities. Evolution. 2001;55:1085–1094. doi: 10.1111/j.0014-3820.2001.tb00628.x. [DOI] [PubMed] [Google Scholar]
- Poelwijk FJ, Tanase-Nicola S, Kiviet DJ, Tans SJ. Reciprocal sign epistasis is a necessary condition for multi-peaked fitness landscapes. J Theor Biol. 2011;272:141–144. doi: 10.1016/j.jtbi.2010.12.015. [DOI] [PubMed] [Google Scholar]
- Poon A, Chao L. The rate of compensatory mutation in the DNA bacteriophage phiX174. Genetics. 2005;170:989–999. doi: 10.1534/genetics.104.039438. [DOI] [PMC free article] [PubMed] [Google Scholar]
- Povoltskaya IS, Kondrashov FA. Sequence space and the ongoing expansion of the protein universe. Nature. 2010;465:922–926. doi: 10.1038/nature09105. [DOI] [PubMed] [Google Scholar]
- Pumir A, Shraiman B. Epistasis in a model of molecular signal transduction. PLoS Comp Biol. 2011;7:e1001134. doi: 10.1371/journal.pcbi.1001134. [DOI] [PMC free article] [PubMed] [Google Scholar]
- Rokyta DR, Joyce P, Caudle SB, Miller C, Beisel CJ, Wichman HA. Epistasis between beneficial mutations and the phenotype-to-fitness map for a ssDNA virus. PLoS Genet. 2011;7:e1002075. doi: 10.1371/journal.pgen.1002075. [DOI] [PMC free article] [PubMed] [Google Scholar]
- Salverda MLM, Dellus E, Gorter FA, Debets AJM, Van der Oost J, Hoekstra RF, Tawfik DS, de Visser JAGM. Initial mutations direct alternative pathways of protein evolution. PLoS Genet. 2011;7:e1001321. doi: 10.1371/journal.pgen.1001321. [DOI] [PMC free article] [PubMed] [Google Scholar]
- Salverda MLM, de Visser JAGM, Barlow M. Natural evolution of TEM-1 beta-lactamase: experimental reconstruction and clinical relevance. FEMS Microb Rev. 2010;34:1015–1036. doi: 10.1111/j.1574-6976.2010.00222.x. [DOI] [PubMed] [Google Scholar]
- Sanjuán R, Elena SF. Epistasis correlates to genomic complexity. Proc Natl Acad Sci U S A. 2006;103:14402–14405. doi: 10.1073/pnas.0604543103. [DOI] [PMC free article] [PubMed] [Google Scholar]
- Schenk MF, Szendro IG, Krug J, de Visser JAGM. Quantifying the adaptive potential of an antibiotic resistance enzyme. PLoS Genet. 2012;8:e1002783. doi: 10.1371/journal.pgen.1002783. [DOI] [PMC free article] [PubMed] [Google Scholar]
- Segrè D, DeLuna A, Church GM, Kishony R. Modular epistasis in yeast metabolism. Nat Genet. 2005;37:77–83. doi: 10.1038/ng1489. [DOI] [PubMed] [Google Scholar]
- Soskine M, Tawfik DS. Mutational effects and the evolution of new protein functions. Nat Rev Genet. 2010;11:572–582. doi: 10.1038/nrg2808. [DOI] [PubMed] [Google Scholar]
- Szathmáry E. Do deleterious mutations interact synergistically? Metabolic control theory provides a partial answer. Genetics. 1993;133:127–132. doi: 10.1093/genetics/133.1.127. [DOI] [PMC free article] [PubMed] [Google Scholar]
- Szendro IG, Franke J, de Visser JAGM, Krug J. Predictability of evolution depends non-monotonically on population size. Proc Natl Acad Sci U S A. 2013;110:571–576. doi: 10.1073/pnas.1213613110. [DOI] [PMC free article] [PubMed] [Google Scholar]
- Szendro IG, Schenk MF, Franke J, Krug J, de Visser JAGM. Quantitative analyses of empirical fitness landscapes. J Stat Mech. 2013:P01005. [Google Scholar]
- Tokuriki N, Stricher F, Schymkowitz J, Serrano L, Tawfik DS. The stability effects of protein mutations appear to be universally distributed. J Mol Biol. 2007;369:1318–1332. doi: 10.1016/j.jmb.2007.03.069. [DOI] [PubMed] [Google Scholar]
- Trindade S, Sousa A, Bivar Xavier K, Dionisio F, Godinho Ferreira M, Gordo I. Positive epistasis drives the acquisition of multidrug resistance. PLoS Genet. 2009;5:e1000578. doi: 10.1371/journal.pgen.1000578. [DOI] [PMC free article] [PubMed] [Google Scholar]
- Wagner GP, Zhang J. The pleiotropic structure of the genotype–phenotype map: the evolvability of complex organisms. Nat Rev Genet. 2011;12:204–213. doi: 10.1038/nrg2949. [DOI] [PubMed] [Google Scholar]
- Wang X, Minasov G, Shoichet BK. Evolution of an antibiotic resistance enzyme constrained by stability and activity trade-offs. J Mol Biol. 2002;320:85–95. doi: 10.1016/S0022-2836(02)00400-X. [DOI] [PubMed] [Google Scholar]
- Watson RA, Weinreich DM, Wakeley J. Genome structure and the benefits of sex. Evolution. 2010;65:523–536. doi: 10.1111/j.1558-5646.2010.01144.x. [DOI] [PubMed] [Google Scholar]
- Weinreich DM, Delaney NF, DePristo MA, Hartl DL. Darwinian evolution can follow only very few mutational paths to fitter proteins. Science. 2006;312:111–114. doi: 10.1126/science.1123539. [DOI] [PubMed] [Google Scholar]
- Weinreich DM, Watson RA, Chao L. Perspective: sign epistasis and genetic constraint on evolutionary trajectories. Evolution. 2005;59:1165–1174. [PubMed] [Google Scholar]
- Wilke CO, Adami C. Interaction between directional epistasis and average mutational effects. Proc Biol Sci. 2001;268:1469–1474. doi: 10.1098/rspb.2001.1690. [DOI] [PMC free article] [PubMed] [Google Scholar]
- Woods RJ, Barrick JE, Cooper TF, Shrestha U, Kauth MR, Lenski RE. Second-order selection for evolvability in a large Escherichia coli population. Science. 2011;331:1433–1436. doi: 10.1126/science.1198914. [DOI] [PMC free article] [PubMed] [Google Scholar]
- Wright S. The roles of mutation, inbreeding, crossbreeding and selection in evolution. Proc 6th Intl Congress Genet. 1932;1:356–366. [Google Scholar]
- You L, Yin J. Dependence of epistasis on environment and mutation severity as revealed by in silico mutagenesis of phage T7. Genetics. 2002;160:1273–1281. doi: 10.1093/genetics/160.4.1273. [DOI] [PMC free article] [PubMed] [Google Scholar]
Associated Data
This section collects any data citations, data availability statements, or supplementary materials included in this article.