Abstract
Monodelphis domestica (short-tailed opossum) is an emerging animal model for studies of neural development due to the extremely immature state of the nervous system at birth and its subsequent rapid growth to adulthood. Yet little is known about its normal sensory discrimination abilities. In the present investigation, visual acuity was determined in this species using the optokinetic test (OPT), which relies on involuntary head tracking of a moving stimulus and can be easily elicited using a rotating visual stimulus of varying spatial frequencies. Using this methodology, we determined that the acuity of Monodelphis is 0.58 cycles per degree (cpd), which is similar to the acuity of rats using the same methodology, and higher than in mice. However, acuity in the short-tailed opossum is lower than in other marsupials. This is in part due to the methodology used to determine acuity, but may also be due to differences in diel patterns, lifestyle and phylogeny. We demonstrate that for the short-tailed opossum, the OPT is a rapid and reliable method of determining a baseline acuity and can be used to study enhanced acuities due to cortical plasticity.
Keywords: marsupial, behavior, optokinetic, evolution, visual acuity
Introduction
The gray short-tailed opossum (Monodelphis domestica) has been a model laboratory animal in the United States since 1979 (VandeBerg, 1983). This small marsupial readily reproduces in captivity and has a short gestation period, making it useful for a wide range of research. Particularly, it gives birth at a very early stage of neural development (Molnar et al. 1998), and has a well-developed and well-studied visual system, (Taylor and Guillery, 1994; Kahn et al, 2000) making it an excellent model organism for studying visual development. Despite this, no researcher has used behavioral measures to assess its visual acuity.
While there are many possible methods by which visual acuity can be measured, we chose a method which provided a quantitative estimate of visual acuity but would not require a lengthy training process. Additionally, unlike some commonly used methods such as the Morris water maze, we preferred a method that limited the stress experienced by the animal. For these reasons we used the optokinetic drum to elicit the optomotor response.
The optokinetic drum does not require behavioral training and provides an unambiguous measure of visual acuity. There is a long history of use of the optokinetic drum in visual science (e.g. Hahnenberger, 1977; Cowey and Franzini, 1979), and it has been used successfully to measure acuity in animals ranging from rats and mice (Cowey and Franzini, 1979; Douglas et al. 2005; Prusky et al. 2006) to humans (Dichgans and Brandt, 1972). Generally, it involves restricting an animal's movements to the center of a circular arena which is encased by a rotating drum with walls that are fitted with interchangeable inserts of striped visual stimuli that vary in width (Fig. 1). The animal then remains stationary while the drum rotates, and this rotation induces the optokinetic response, which is a compensatory eye movement in the direction of the moving stimulus. The optokinetic response is reflexive, and is thought to occur in an attempt to reduce the movement of the image across the retina. Importantly, the optokinetic response is absent if the drum is not rotating, or if there are no discernible visual features on which an animal can fixate. Thus, a solid gray stimulus on the outer drum would not induce the optokinetic response, and likewise a sufficiently high spatial frequency (which an animal cannot discriminate from gray) would not induce this reflex.
Figure 1.
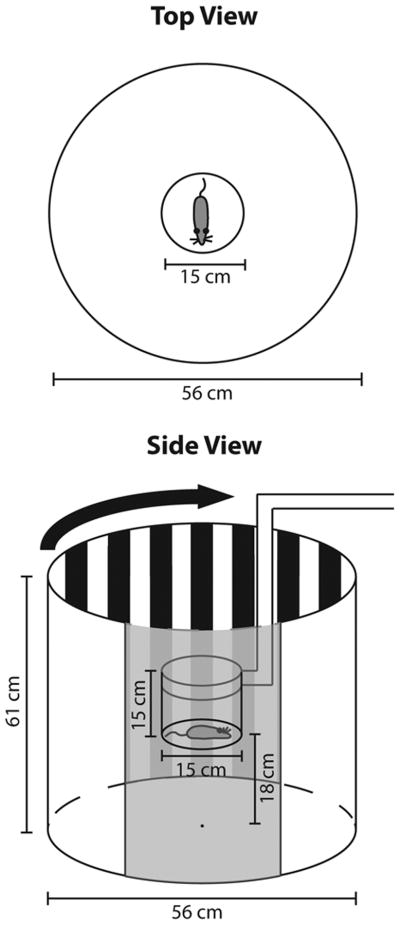
A top and side view of the optokinetic testing apparatus. The animal is enclosed in a central chamber which is suspended within a larger rotating drum. The drum contains high contrast stripes of varying widths (see Table 1) that when viewed from the calculated central distance correspond to a particular spatial frequency. Throughout testing different widths of stripes are used to determine visual acuity. The gray in the bottom panel represents a cut away portion of the outer drum so that the inner chamber can be seen. The opossum is not to scale.
Similar to the eye tracking observed in the optokinetic response is an animal's ability to track a moving stimulus, previously called head tracking or optomotor tracking. In order to allow the head to move, the animal cannot be restrained, which can introduce variation in the distance between the head and the stimulus, but this lack of restraint reduces the amount of stress on the animal. Head tracking has been shown previously in guinea pigs (Gresty, 1975) as well as rats and mice (Cowey and Franzini, 1979; Fuller, 1985; Douglas et al. 2005). Particularly, head movements have been shown to occur consistently in rats when the outer drum rotates at a speed greater than 10 degrees but less than 20 degrees per second (Fuller, 1985; Douglas et al. 2005).
Because head tracking does not require restraint of the animal, and because it has been used previously to estimate visual acuity in small mammals, we chose to use the head tracking response to test visual acuity in Monodelphis domestica. Here we describe the methodology used to ensure that short-tailed opossums consistently exhibit head tracking behavior. Additionally, we provide the first behavioral estimate of Monodelphis domestica's visual acuity. We compare acuities in Monodelphis with other marsupials, as well as with rodents in which the same methodology was used to determine acuity. Ultimately these data serve as a baseline for future studies in which we will measure acuity in animals in which the visual system has been surgically manipulated and in animals reared in alternate visual environments.
Materials and Methods
Subjects
Subjects were 6 (3 male, 3 female; 84 – 109 g) short tailed opossums (Monodelphis domestica). The average age for 5 of these animals was 198 days old (range 184-219); the sixth animal was 1.5 years old. Opossums were bred and housed in the vivarium at the University of California, Davis, in a 14:10 light:dark schedule (lights on at 7am and off at 9pm). Behavioral testing began no earlier than 6 months of age, when all animals have reached sexual maturity. All procedures were approved by the Animal Care and Use Administrative Advisory Committee of the University of California, Davis, and conform to National Institutes of Health guidelines.
Equipment
In order to determine the visual acuity of short tailed opossums, we constructed an optokinetic drum similar to that described previously (Thaung et al. 2002, Fig. 1). Briefly, the testing apparatus consisted of a drum (diameter 56 cm, height 61 cm) that rotates clockwise at 2.4 revolutions per minute (RPM) or 14.4 deg/sec. This speed is consistent with the speed at which previous investigators have consistently observed head movements using an optokinetic drum (Fuller, 1985; Thang et al., 2002; Thomas et al., 2004; Douglas et al., 2005). The opossum was placed in a clear cylindrical chamber (diameter 15 cm, height 15 cm) at the center of the drum, which remained stationary throughout testing while the drum rotated around it. A spatial frequency stimulus, consisting of alternating black and white bars, was attached to the interior wall of the outer chamber. The spatial frequency of the stimulus was calculated by determining the length of one degree of visual angle from the center of the outer cylinder and ranged from 0.15 cycles per degree (cpd) to 0.8 cpd, where one “cycle” is one black and one white vertical stripe (Table 1). Additionally, a neutral (homogeneous gray) stimulus was used as a control to ensure head tracking did not occur in the absence of a high-contrast stimulus. Finally, a video camera was mounted above the optokinetic drum apparatus to record trials for off-line data analysis.
Table 1.
Width of stripes (in cm) on the outer drum for one cycle of all spatial frequencies tested. One cycle consists of one black and white stripe.
| Spatial Frequency | Cycle (cm) |
|---|---|
| 0.15 | 3.25 |
| 0.20 | 2.44 |
| 0.25 | 1.95 |
| 0.30 | 1.63 |
| 0.35 | 1.39 |
| 0.40 | 1.22 |
| 0.45 | 1.08 |
| 0.50 | 0.98 |
| 0.55 | 0.89 |
| 0.60 | 0.81 |
| 0.65 | 0.75 |
| 0.70 | 0.70 |
| 0.75 | 0.65 |
| 0.80 | 0.61 |
Behavioral Test
Animals were tested during daylight hours. At the beginning of each day of testing, a stimulus was placed on the inside of the drum (Fig. 1) and the animal was placed in the central chamber. Once the drum began rotating the animal remained in the central chamber for up to 30 minutes, or until head tracking was observed by the experimenter. If head tracking was observed, testing continued for an additional 5 minutes. If the animal exhibited head tracking, the spatial frequency increased in the next trial, however if no head tracking was observed, the spatial frequency decreased. The animal remained in the testing chamber while the spatial frequency was changed. In additional trials, animals remained in the central chamber for up to 15 minutes. As in the first trial, if head tracking was observed the animal remained in the chamber for 5 additional minutes. No animals were tested for more than 60 minutes in a single day. Animals were tested across multiple days, and an animal's daily visual threshold was determined. The value then reported as an animal's maximum spatial frequency is the maximum daily visual threshold recorded.
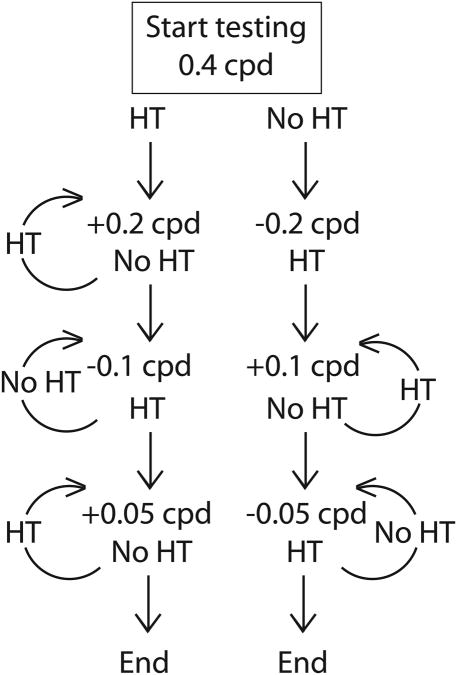
All animals began testing with stimuli that had a spatial frequency of 0.4 cpd. Following this initial spatial frequency, subsequent spatial frequencies followed a staircase procedure in which the step size started at ±0.2 cpd and the step size was halved after each reversal (Fig. 2). Thus successful head tracking at 0.4 cpd would cause the next stimulus presented to be (0.4 + 0.2), or 0.6 cpd. Following the successful trial, unsuccessful head tracking at 0.6 cpd would halve the step size, and the next stimulus presented would be (0.6 – 0.1), or 0.5 cpd. This staircase design was then terminated when the step size reached 0.05 cpd. For example, an animal with a visual acuity of 0.65 cpd would have been exposed to the following stimuli in the following order: 0.4 → 0.6 → 0.8 → 0.7 → 0.6 → 0.65 cpd. Following completion of testing, videos of trials were scored by assistants who were uninvolved in the behavioral testing process to independently confirm tracking behavior.
Figure 2.
A decision tree representing the order of presentation of spatial frequencies starting at 0.4 cpd. If head tracking (HT) occurs in response to the stimulus, frequency presented would be increased by 0.2 cpd to 0.6 cpd. If no head tracking (NoHT) occurs, it would be decreased by 0.2 cpd to 0.2 cpd. Depending on the outcome of each trial, the next spatial frequency is increased or decreased. Every reversal of tracking behavior caused the step for the following trial to be halved, and testing was complete when the next step required would be less than 0.05 cpd.
Data analysis
The spatial frequency of each stimulus is calculated using the distance from the center of the inner testing chamber to the outer wall. However, because the animal is unrestrained within the inner testing chamber, there exists a small amount of variability in the “viewing distance” of the stimuli, depending on the location of the animal while head tracking. To account for this, we recalculated the maximum visual acuity for each trial based on the actual distance between the eyes and the visual stimulus using archived video footage. Animals showed a tendency to head track closer to the edge of the inner chamber, the result of this recalculation resulted in the actual spatial frequency reported here being slightly lower than the value that was initially calculated for each stimulus.
Trial length was defined as the amount of time the animal was in the central chamber. The time reported before head tracking was observed was defined as the duration from initiation of outer drum rotation until head tracking was observed.
Results
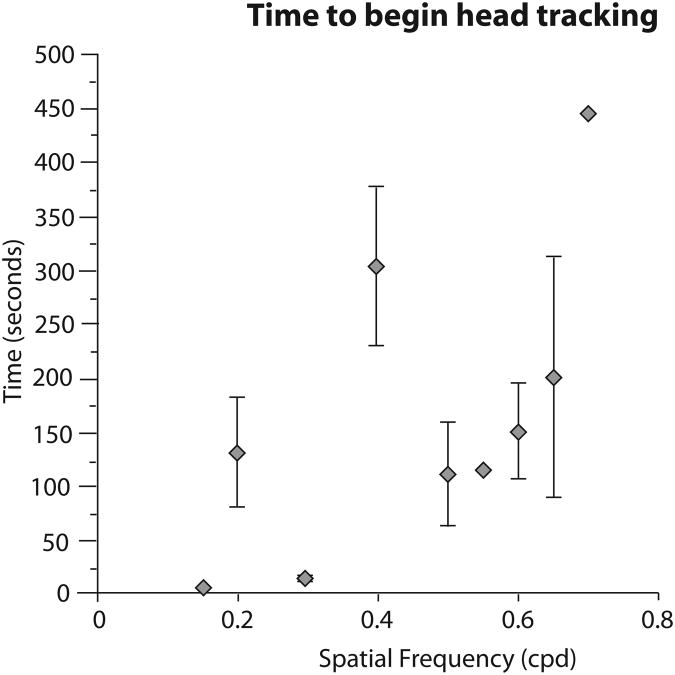
As is outlined throughout the methods, it is more time consuming to get an estimate of visual acuity in Monodelphis domestica than in rats and mice. Across all trials, determining visual acuity took an average of 55 minutes 27 seconds, and animals were tested for multiple days. The latency to head track varied across different spatial frequencies (Fig. 3). In general, animals were quicker to initiate head tracking at lower spatial frequencies, and were slower to initiate head tracking at higher spatial frequencies. The largest deviation from this pattern was observed at 0.4 cpd. However this is likely because this was the first stimulus presented for all animals, and thus took more time before the animals began attending to the stimulus.
Figure 3.
Head tracking latency as a function of stimulus spatial frequency. The diamonds represent means (±SEM) for all animals at a given spatial frequency using the raw (uncorrected) data. There was a general trend for animals to begin head tracking faster for lower spatial frequencies, with the exception of the starter stimulus of 0.4 cpd.
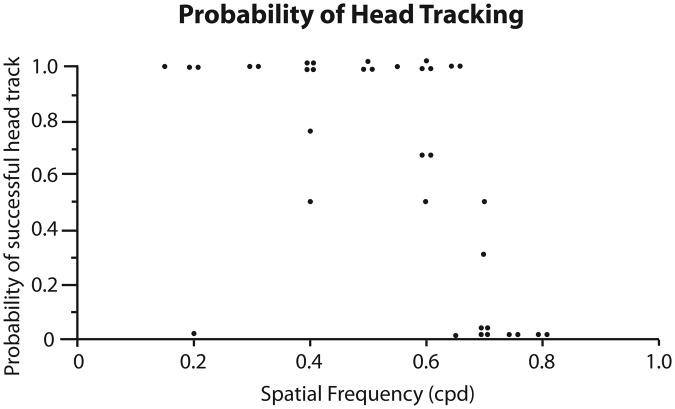
The maximum observed visual acuity was consistent between animals (mean 0.585 cpd ± 0.019 standard error of the mean, SEM), ranging from 0.55 to 0.65 cpd. To further explore peak acuity, we looked at the probability (ranging from 0 to 1) each animal exhibited head tracking at a given spatial frequency (Fig. 4). For example, if an animal's probability of head tracking is 1.0, head tracking is always observed at that spatial frequency for that animal. Thus, head tracking was nearly always observed for spatial frequencies below 0.55 cpd, however the likelihood of observing head tracking decreased at spatial frequencies above 0.55 cpd until 0.75 cpd. For spatial frequencies of 0.75 cpd and above, head tracking was never observed.
Figure 4.
Probability of head tracking for different spatial frequencies. The dots represent the probability that head tracking would be observed at a given spatial frequency for an individual animal, where 1 indicates head tracking was observed every time and 0 indicates head tracking was never observed. The acuities listed here are raw (uncorrected) values.
Discussion
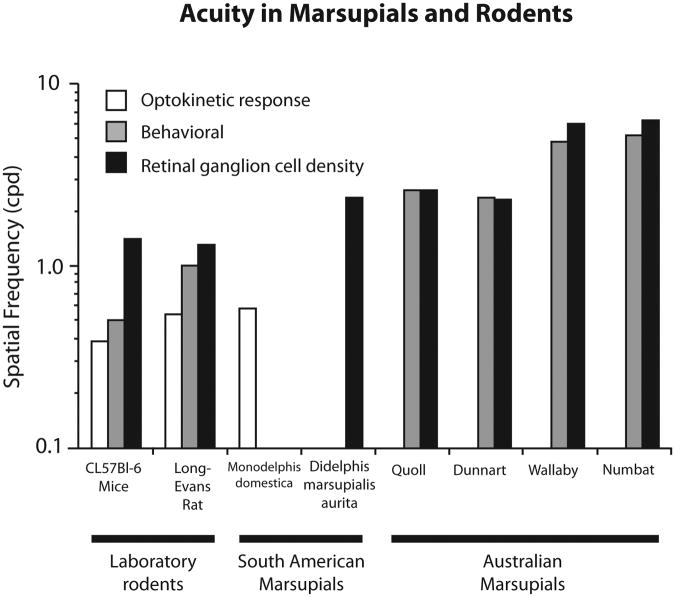
In the present investigation we demonstrate that visual acuity in the South American marsupial, Monodelphis domestica (short-tailed opossums), can be rapidly and consistently obtained using the optokinetic test (OPT). This is the first test of visual acuity in the Monodelphis and one of only a few studies that has examined acuity in marsupials in general. Marsupials constitute a major radiation of mammals and the marsupial clade contains over 300 species that have undergone parallel evolution of both the brain and the body, similar to that of eutherians (Karlen and Krubitzer, 2007 for review). Yet, relatively little is known about the sensory discriminatory abilities of these animals, or aspects of brain organization that generate these abilities. Previous studies in Australian marsupials that utilized behavioral tests such as the visual water task (VWT) and two choice discrimination to determine visual discrimination abilities report acuities ranging from 2.36 cpd to 5.2 cpd, and these measures appear to be strongly associated with diel pattern and to a lesser extent feeding behaviors (e.g. predators/omnivores). For example, acuity in the Australian numbat, the only diurnal marsupial, is 5.2 cpd (Arrese et al., 2000) and in the crepuscular wallaby is 4.8 cpd (Hemmi and Mark, 1998; Fig 5). Nocturnal and arrhythmic marsupials such as the quoll and fat-tailed dunnart have lower acuities of 2.6 cpd and 2.36 cpd respectively (Harman, 1986; Arrese et al., 1999). There does not appear to be a relationship between phylogeny and acuity in Australian marsupials since the animals studied came from two separate orders Dasyuromorphia (quoll; numbat, dunnart) and Diprotodontia (wallaby). It is important to note that the behavioral task used to assess acuity in these marsupials may have introduced some variability. For example the Mitchell jumping task (Mitchell et al., 1977) was used to determine acuity in dunnarts and quolls, while variations on a two choice discrimination task was used to assess acuity in wallabies and numbats (Fig. 5).
Figure 5.
Comparison of visual acuity in common rodent models, South American marsupials, and Australian marsupials. Results are further separated by the method used to determine acuity. The optokinetic response (white) is lower than behaviorally determined acuity (gray), which is less than the physiologically determined maximum possible acuity by ganglion cell density (black).
There are no behavioral studies of acuity in South American marsupials, which are composed of three orders (see Krubitzer and Karlen, 2007 for review). One study in the nocturnal South American opossum (Didelphis marsupialis aurita) used peak retinal ganglion cell density to determine a physiologically maximum acuity of 2.4 cpd. Additionally, they estimated visual acuity to be 1.25 cpd by looking at cortical potentials (Silveira, Picaco-Diniz and Oswaldo-Cruz, 1982), which is much lower than acuities measured in nocturnal Australian marsupials, suggesting that phylogeny may be associated with acuity. Unfortunately, no behavioral test of acuity was performed, and thus the data are too limited to come to any firm conclusions.
In the present study, we found that the mean acuity in the crepuscular Monodelphis domestica is 0.58 cpd, which is substantially higher than mice (0.39 cpd) and slightly higher than rats (0.54 cpd) using this same methodology (Douglas et al., 2005), but lower than other marsupials. Significantly, variance in acuity found between animals was low (0.58 cpd ± 0.019 SEM). While the OPT is a reliable and efficient means of determining acuity or other features of visual discrimination such as motion or contrast sensitivity (e.g. Douglas et al., 2005), it consistently underestimates acuity. For example, when acuity obtained using the OPT is compared with acuity determined using more complex discrimination tasks such as the VWT, there is a 25% and 45% reduction in acuity in mice and rats respectively. Preliminary data in opossums using a modified Y maze to determine acuity indicates a similar underestimation of acuity with the OPT (Luu et al., Neuroscience abstract). However, acuity obtained using the OPT remains useful for determining the acuity of a species, as animals with higher acuity in more complex discrimination tasks also have a higher acuity using the OPT.
The differences in visual acuity using the OPT versus water maze of two choice discrimination tasks is likely due to the neural circuitry that underlies the response for the different tests. For example, the OPT relies on subcortical processing (Prusky et al., 2004) which includes retinal projections to the optokinetic nuclei (including the nucleus of the optic tract and the pretectal olivary nucleus, for review see Wallman, 1993; Gamlin, 2006). These nuclei have been shown to mediate the optokinetic response in order to prevent retinal slippage, however they also receive direct cortical projections. While areas in visual cortex and the frontal eye fields are active during optokinetic stimulation in humans (e.g. Bucher et al., 1997; see Schraa-Tam et al., 2009 for review), lesions of visual cortex do not affect acuity determined with OPT in rats (Douglas et al., 2005) and have a slight, short lived affect on optokinetic nystagmus in cats (Ventre, 1985). On the other hand, tests such as the VWT and two choice discrimination tasks are believed to rely more on the geniculo-cortical pathways because lesions to visual cortex have been shown to reduce acuity measured with these types of test (Douglas et al., 2005). Different tests reliance on particular neural pathways underlies some of this variance.
Although the optokinetic response is driven by subcortical circuits (Gamlin, 2006) and lesioning the neocortex does not produce a change in this response in normal animals, the OPT has been used successfully to examine the sensory mediated behavior in animals reared in different sensory environments. For example, studies in which rats that had early visual exposure to high spatial frequency gratings and moving stimuli used the OPT to demonstrate improved discrimination of spatial frequency and motion of the enhanced stimulus in adults (Prusky et al., 2008). Lesions to visual cortex eradicated this effect indicating that this behavioral plasticity was mediated by primary visual cortex. Thus, the OPT is effective in measuring cortical enhancement of discriminatory abilities (see Tschetter et al., 2011).
While the scope of the present study was limited to determining if the OPT is a viable measure of acuity in Monodelphis, our overall goal is to generate a battery of tests, including the OPT that can measure sensory mediated behaviors in both normal and experimentally manipulated animals. For this reason, results from the present investigation are an important extension of experiments in our own and a number of other laboratories that use Monodelphis as a developmental model. As noted in the introduction, these animals are born at a very early stage of neural development and studies that would be performed in utero in more traditional laboratory animals such as mice and rats can be performed ex utero in Monodelphis. Further, the entire genome of Monodelphis domestica has been recently sequenced (Mikkelsen et al., 2007) which opens the door for developmental studies that utilize genetic manipulations, much like those done in mice (e.g. Hunt et al., 2009; Cheung et al., 2010; Noor et al., 2011; Sears et al., 2012). Thus, establishing measures of sensory discrimination and other measures of sensory mediated behavior is important for future studies in animals in which the nervous system is physically or genetically altered.
Acknowledgments
We would like to thank Dylan Cooke for helpful comments on the manuscript, Conor Weatherford for assistance constructing the optokinetic drum, and Julie Luu for generating pilot data. This work was supported by grants to Leah Krubitzer from NINDS (R21NS071225-01) and funding from the NEI (T32-EY015387-05) to James Dooley and Adele Seelke.
Literature Cited
- Arrese C, Archer M, Runham P, Dunlop SA, Beazley LD. Visual System in a Diurnal Marsupial, the Numbat(Myrmecobius fasciatus): Retinal Organization, Visual Acuity and Visual Fields. Brain, Behavior and Evolution. 2000;55:163–175. doi: 10.1159/000006650. [DOI] [PubMed] [Google Scholar]
- Arrese C, Dunlop SA, Harman AM, Braekevelt CR, Ross WM, Shand J, Beazley LD. Retinal structure and visual acuity in a polyprotodont marsupial, the fat-tailed dunnart (Sminthopsis crassicaudata) Brain Behav Evol. 1999;53:111–126. doi: 10.1159/000006588. [DOI] [PubMed] [Google Scholar]
- Bucher SF, Dieterich M, Seelos KC, Brandt T. Sensorimotor cerebral activation during optokinetic nystagmus. A functional MRI study. Neurology. 1997;49:1370–1377. doi: 10.1212/wnl.49.5.1370. [DOI] [PubMed] [Google Scholar]
- Cheung AF, Kondo S, Abdel-Mannan O, Chodroff RA, Sirey TM, Bluy LM, Webber N, et al. The subventricular zone is the developmental milestone of a 6-layered neocortex: comparisons in metatherian and eutherian mammals. Cerebral Cortex (New York, N Y: 1991) 2010;20(5):1071–1081. doi: 10.1093/cercor/bhp168. [DOI] [PubMed] [Google Scholar]
- Cowey A, Franzini C. The retinal origin of uncrossed optic nerve fibres in rats and their role in visual discrimination. Experimental Brain Research. 1979;35:443–455. doi: 10.1007/BF00236763. [DOI] [PubMed] [Google Scholar]
- Dichgans J, Brandt T. Visual-vestibular interaction and motion perception. Bibl Ophthalmol. 1972;82:327–338. [PubMed] [Google Scholar]
- Douglas RM, Alam NM, Silver BD, Mcgill TJ, Tschetter WW, Prusky GT. Independent visual threshold measurements in the two eyes of freely moving rats and mice using a virtual-reality optokinetic system. Visual Neuroscience. 2005;22:677–684. doi: 10.1017/S0952523805225166. [DOI] [PubMed] [Google Scholar]
- Fadem BH, Schwartz RA. A Sexually Dimorphic Suprasternal Scent Gland in Gray Short-Tailed Opossums (Monodelphis domestica) Journal of Mammalogy. 1986;67:205. [Google Scholar]
- Fuller JH. Eye and head movements in the pigmented rat. Vision Res. 1985;25:1121–1128. doi: 10.1016/0042-6989(85)90101-4. [DOI] [PubMed] [Google Scholar]
- Gamlin PDR. The pretectum: connections and oculomotor-related roles. Prog Brain Res. 2006;151:379–405. doi: 10.1016/S0079-6123(05)51012-4. [DOI] [PubMed] [Google Scholar]
- Gresty MA. Eye, head and body movements of the guinea pig in response to optokinetic stimulation and sinusoidal oscillation in yaw. Pflügers Archiv European Journal of Physiology. 1975;353:201–214. doi: 10.1007/BF00584284. [DOI] [PubMed] [Google Scholar]
- Hahnenberger RW. Differences in optokinetic nystagmus between albino and pigmented rabbits. Experimental Eye Research. 1977;25:9–17. doi: 10.1016/0014-4835(77)90240-8. [DOI] [PubMed] [Google Scholar]
- Harman AM, Nelson JE, Crewther SG, Crewther DP. Visual acuity of the northern native cat (Dasyurus hallucatus)--behavioural and anatomical estimates. Behav Brain Res. 1986;22:211–216. doi: 10.1016/0166-4328(86)90065-3. [DOI] [PubMed] [Google Scholar]
- Hemmi JM, Mark RF. Visual acuity, contrast sensitivity and retinal magnification in a marsupial, the tammar wallaby (Macropus eugenii) J Comp Physiol A. 1998;183:379–387. doi: 10.1007/s003590050264. [DOI] [PubMed] [Google Scholar]
- Hunt DM, Chan J, Carvalho LS, Hokoc JN, Ferguson MC, Arrese CA, Beazley LD. Cone visual pigments in two species of South American marsupials. Gene. 2009;433(1–2):50–55. doi: 10.1016/j.gene.2008.12.006. [DOI] [PubMed] [Google Scholar]
- Kahn DM, Huffman KJ, Krubitzer L. Organization and connections of V1 in Monodelphis domestica. The Journal of Comparative Neurology. 2000;428:337–354. [PubMed] [Google Scholar]
- Karlen SJ, Krubitzer L. The functional and anatomical organization of marsupial neocortex: evidence for parallel evolution across mammals. Prog Neurobiol. 2007;82:122–141. doi: 10.1016/j.pneurobio.2007.03.003. [DOI] [PMC free article] [PubMed] [Google Scholar]
- Mikkelsen TS, Wakefield MJ, Aken B, Amemiya CT, Chang JL, et al. Genome of the marsupial Monodelphis domestica reveals innovation in non-coding sequences. Nature. 2007;447:167–177. doi: 10.1038/nature05805. [DOI] [PubMed] [Google Scholar]
- Mitchell DE, Giffin F, Timney B. A behavioural technique for the rapid assessment of the visual capabilities of kittens. Perception. 1977;6:181–193. doi: 10.1068/p060181. [DOI] [PubMed] [Google Scholar]
- Molnár Z, Knott GW, Blakemore C, Saunders NR. Development of thalamocortical projections in the South American gray short-tailed opossum (Monodelphis domestica) The Journal of Comparative Neurology. 1999;398:491–514. [PubMed] [Google Scholar]
- Noor NM, Steer DL, Wheaton BJ, Ek CJ, Truettner JS, Dietrich WD, Dziegielewska KM, et al. Age-Dependent Changes in the Proteome Following Complete Spinal Cord Transection in a Postnatal South American Opossum (Monodelphis domestica) PLoS ONE. 2011;6(11):e27465. doi: 10.1371/journal.pone.0027465. [DOI] [PMC free article] [PubMed] [Google Scholar]
- Prusky GT, Alam NM, Beekman S, Douglas RM. Rapid Quantification of Adult and Developing Mouse Spatial Vision Using a Virtual Optomotor System. IOVS. 2004;45:4611–4616. doi: 10.1167/iovs.04-0541. [DOI] [PubMed] [Google Scholar]
- Prusky GT, Alam NM, Douglas RM. Enhancement of Vision by Monocular Deprivation in Adult Mice. J Neurosci. 2006;26:11554–11561. doi: 10.1523/JNEUROSCI.3396-06.2006. [DOI] [PMC free article] [PubMed] [Google Scholar]
- Prusky GT, Silver BD, Tschetter WW, Alam NM, Douglas RM. Experience-Dependent Plasticity from Eye Opening Enables Lasting, Visual Cortex-Dependent Enhancement of Motion Vision. J Neurosci. 2008;28:9817–9827. doi: 10.1523/JNEUROSCI.1940-08.2008. [DOI] [PMC free article] [PubMed] [Google Scholar]
- Schraa-Tam CKL, van der Lugt A, Smits M, Frens MA, van Broekhoven PCA, van der Geest JN. Differences between smooth pursuit and optokinetic eye movements using limited lifetime dot stimulation: a functional magnetic resonance imaging study. Clin Physiol Funct Imaging. 2009;29:245–254. doi: 10.1111/j.1475-097X.2009.00858.x. [DOI] [PubMed] [Google Scholar]
- Sears KE, Patel A, Hübler M, Cao X, Vandeberg JL, Zhong S. Disparate Igf1 Expression and Growth in the Fore- and Hind Limbs of a Marsupial Mammal (Monodelphis domestica) Journal of Experimental Zoology Part B: Molecular and Developmental Evolution. 2012;318(4):279–293. doi: 10.1002/jez.b.22444. [DOI] [PubMed] [Google Scholar]
- Silveira LCL, Picanço-Diniz CW, Oswaldo-Cruz E. Contrast sensitivity function and visual acuity of the opossum. Vision Research. 1982;22:1371–1377. doi: 10.1016/0042-6989(82)90227-9. [DOI] [PubMed] [Google Scholar]
- Taylor JSH, Guillery RW. Early development of the optic chiasm in the gray short-tailed opossum, Monodelphis domestica. The Journal of Comparative Neurology. 2004;350:109–121. doi: 10.1002/cne.903500108. [DOI] [PubMed] [Google Scholar]
- Thaung C, Arnold K, Jackson IJ, Coffey PJ. Presence of visual head tracking differentiates normal sighted from retinal degenerate mice. Neurosci Lett. 2002;325:21–24. doi: 10.1016/s0304-3940(02)00223-9. [DOI] [PubMed] [Google Scholar]
- Tschetter WW, Douglas RM, Prusky GT. Experience-induced interocular plasticity of vision in infancy. Front Syst Neurosci. 2011;5:44. doi: 10.3389/fnsys.2011.00044. [DOI] [PMC free article] [PubMed] [Google Scholar]
- Ventre J. Cortical control of oculomotor functions. I. Optokinetic nystagmus. Behavioural Brain Research. 1985;15:211–226. doi: 10.1016/0166-4328(85)90176-7. [DOI] [PubMed] [Google Scholar]
- Wallman J. Subcortical optokinetic mechanisms. Rev Oculomot Res. 1993;5:321–342. [PubMed] [Google Scholar]


