

Abstract
Urinary bisphenol A (BPA), a widely-used biomarker of exposure to BPA, has been associated with cardiometabolic derangements in laboratory studies and with low-grade albuminuria in Chinese adults. Despite the known unique vulnerability of children to environmental chemicals, no studies have examined associations of urinary BPA with albuminuria in children. Since exposure to BPA is widespread in the United States population, we examined data from 710 children in the 2009–10 National Health and Nutrition Examination Survey with urinary BPA measurements and first morning urine samples with creatinine values. Controlled for a broad array of sociodemographic and environmental risk factors as well as insulin resistance and elevated cholesterol, children with the highest compared to the lowest quartile of urinary BPA had a significant 0.91 mg/g higher albumin-to-creatinine ratio, adjusted for the urinary BPA concentration. When the multivariable model was reprised substituting continuous measures of BPA, a significant 0.28 mg/g albumin-to-creatinine ratio increase was identified for each log unit increase in urinary BPA. Thus, an association of BPA exposure with low-grade albuminuria is consistent with previous results found in Chinese adults and documents this in children in the United States. Our findings broaden the array of adverse effects of BPA to include endothelial dysfunction as evidenced by the low-grade albuminuria and support proactive efforts to prevent harmful exposures.
Keywords: bisphenol A, albuminuria, endothelial dysfunction
INTRODUCTION
Bisphenol A (BPA) is used to manufacture polycarbonate resin, and is a breakdown product of coatings intended to prevent metal corrosion in food and beverage containers.1–3 In the US population, exposure is nearly ubiquitous and begins early in life. 92.6% of ≥6 year olds had detectable BPA in their urine in the 2003–4 National Health and Nutrition Examination Survey (NHANES).4 While food is a major source of exposure to BPA,5 dental sealants,6 and thermal copy paper 7 are also sources.
Laboratory studies suggest that multiple metabolic mechanisms are perturbed by BPA. BPA induces fibroblast differentiation into adipocytes,8 affects glucose transport,9 and inhibits adiponectin release from human adipose tissue.10 Low-level BPA can also stimulate release of inflammatory cytokines that stimulate lipolysis.11 Estrogenic effects,12,13 thyroid hormone antagonism,14 and disruption of glucagon secretion15 have been documented. Cross-sectional studies have associated urinary BPA (uBPA) with adult diabetes, cardiovascular diagnoses and abnormalities in liver function.16,17 High levels of uBPA have been associated with incident coronary artery disease in apparently healthy European adults.18 Recent reports have identified associations of elevated uBPA with increased risk of obesity in the US population, both in adults 19,20 and in children.21
Animal studies indicate that BPA induces oxidant stress22,23 within the renal parenchyma, and that this damage is further exacerbated by vitamin C or nutritional iron deficiency.24,25 Given that BPA is a potential contributor to physiologic processes that increase cardiometabolic risk, and since individuals with increased cardiovascular risk have increased albuminuria,26,27 BPA exposure may be associated with low-grade albuminuria. The only study which has evaluated this possibility examined 3,055 Chinese adults living in the Shanghai region, and identified uBPA as an independent determinant of the extent of low grade albuminuria (albumin:creatinine ratio <30 mg/g), with 23% increased odds for the highest quartile of albuminuria in the highest urinary concentration BPA quartile compared to the lowest quartile. This association was not modified by other risk factors such as age, gender, smoking, alcohol consumption, BMI, hypertension, diabetes, and the estimated glomerular filtration rate.28
Despite their unique, physiologically- and biologically-based vulnerabilities to environmental toxins,29 the impact of BPA exposure on albuminuria has not been evaluated in children. In view of the potential adverse consequences of early-life cardiometabolic risk, we examined associations of uBPA with low grade albuminuria among US children age 6–19 years of age.
RESULTS
Descriptive analyses of the NHANES 2009–10 subsample we analyzed are presented in Table 1. Older and higher socioeconomic status children had lower urinary BPA. We did not find differences in dilution-adjusted BPA among children with confounding medical conditions, such as overweight, insulin resistance and prehypertension. ACR in the first morning urine sample was higher among females and younger children, while overweight children had significantly lower ACR.
Table 1.
Study population characteristics in 2009–2010 NHANES (n=667)c
| Total, N (%)a | Mean Urinary BPA (ng/mL)b | P | Mean ACR (mg/g) | P | |
|---|---|---|---|---|---|
| Sex |
|
||||
| Male | 355 (51.7) | 1.889 | Reference | 4.999 | Reference |
| Female | 312 (48.3) | 1.934 | 0.743 | 5.981 | 0.001 |
|
| |||||
| Age (y) |
|
||||
| 6–11 | 336 (43.2) | 2.253 | Reference | 7.591 | Reference |
| 12–19 | 331 (56.8) | 1.761 | 0.016 | 5.810 | <0.001 |
|
| |||||
| Race/ethnicity |
|
||||
| Hispanic-Mexican American | 180 (13.1) | 2.006 | Reference | 6.211 | Reference |
| Hispanic-Other Hispanic | 82 (6.5) | 2.292 | 0.231 | 6.770 | 0.232 |
| Non-Hispanic White | 226 (58.2) | 1.863 | 0.454 | 6.830 | 0.158 |
| Non-Hispanic Black | 128 (12.9) | 2.159 | 0.544 | 5.672 | 0.184 |
| Other | 51 (9.4) | 1.947 | 0.829 | 6.207 | 0.994 |
|
| |||||
| Poverty-income ratio |
|
||||
| First quartile (< 0.78) | 114 (12.4) | 2.411 | Reference | 6.220 | Reference |
| Second quartile (0.78 to 1.35) | 159 (17.8) | 1.875 | 0.041 | 7.699 | 0.001 |
| Third quartile (1.35 to 2.91) | 164 (24.2) | 1.947 | 0.084 | 6.614 | 0.541 |
| Fourth quartile (at least 2.91) | 165 (36.9) | 1.891 | 0.022 | 6.627 | 0.523 |
|
| |||||
| Caregiver education |
|
||||
| Less than 9th grade | 75 (6.6) | 1.897 | Reference | 6.707 | Reference |
| 9th–12th grade | 115 (12.9) | 2.119 | 0.509 | 6.550 | 0.885 |
| High school or GED | 145 (20.9) | 2.201 | 0.399 | 6.022 | 0.729 |
| Some college | 185 (30.8) | 1.833 | 0.819 | 6.213 | 0.123 |
| College or greater | 128 (28.8) | 1.856 | 0.889 | 7.429 | 0.169 |
|
| |||||
| Serum cotinine | |||||
| Less than 0.015 ng/mL | 170 (23.1) | 1.937 | Reference | 6.952 | Reference |
| 0.015–1.9 ng/mL | 159 (54.8) | 1.972 | 0.823 | 6.537 | 0.512 |
| At least 2.0 ng/mL | 161 (10.4) | 1.740 | 0.384 | 5.938 | 0.211 |
|
| |||||
| Obesity status | |||||
| Not overweight | 393 (63.3) | 1.989 | Reference | 7.047 | Reference |
| Overweight | 267 (36.7) | 1.906 | 0.577 | 5.723 | 0.015 |
|
| |||||
| Blood pressure | |||||
| <90th percentile | 521 (94.9) | 1.876 | Reference | 6.750 | Reference |
| ≥90th percentile | 32 (5.1) | 1.711 | 0.612 | 6.188 | 0.565 |
|
| |||||
| Cholesterol | |||||
| Not elevated | 390 (65.2) | 1.971 | Reference | 6.838 | Reference |
| Elevated | 201 (34.8) | 1.868 | 0.617 | 6.120 | 0.155 |
|
| |||||
| Insulin resistance | |||||
| Not resistant | 101 (72.3) | 1.627 | Reference | 5.686 | Reference |
| Resistant | 41 (27.7) | 1.450 | 0.366 | 5.248 | 0.528 |
|
| |||||
| Albumin-to-creatinine ratio | |||||
| First quartile (<4.3 mg/g) | 170 (25.6) | 1.746 | Reference | ||
| Second quartile (4.3–6.06 mg/g) | 159 (23.4) | 1.967 | 0.446 | ||
| Third quartile (6.06–9.34 mg/g) | 161 (22.8) | 1.943 | 0.513 | ||
| Fourth quartile (≥9.34 mg/g) | 177 (28.1) | 2.039 | 0.235 | ||
|
| |||||
| BPA quartileb | |||||
| First quartile (<1.1 ng/mL) | 172 (24.9) | 5.820 | Reference | ||
| Second quartile (1.1–2.1 ng/mL) | 163 (27.1) | 6.530 | 0.294 | ||
| Third quartile (2.1–4.3 ng/mL) | 170 (26.0) | 6.851 | 0.203 | ||
| Fourth quartile (≥4.3 ng/mL) | 162 (22.1) | 7.250 | 0.006 | ||
|
| |||||
| Triclosan quartileb | |||||
| First quartile (<2.7 ng/mL) | 154 (20.8) | 1.718 | Reference | 6.233 | Reference |
| Second quartile (2.7–9.7 ng/mL) | 184 (28.8) | 2.142 | 0.050 | 6.389 | 0.767 |
| Third quartile (9.7–44.75 ng/mL) | 191 (31.6) | 2.115 | 0.045 | 6.907 | 0.179 |
| Fourth quartile (≥44.75 ng/mL) | 138 (18.9) | 2.427 | 0.664 | 6.695 | 0.399 |
|
| |||||
| Benzophenone-3 quartileb | |||||
| First quartile (<5.5 ng/mL) | 159 (20.6) | 1.702 | Reference | 6.058 | Reference |
| Second quartile (5.5–12.9 ng/mL) | 168 (22.1) | 1.862 | 0.336 | 6.737 | 0.330 |
| Third quartile (12.9–41.1 ng/mL) | 169 (25.4) | 2.034 | 0.261 | 6.302 | 0.540 |
| Fourth quartile (≥41.1 ng/mL) | 171 (31.9) | 2.178 | 0.066 | 7.044 | 0.002 |
All percentages are weighted using population weights for the sample in which BPA was measured.
Calculated using linear regression, after adjustment for urinary creatinine.
Total number of subjects from some variables do not total to 667 due to missing data. See text.
Association of uBPA and ACR, adjusting for urinary dilution
Initial regression analysis, adjusting only for urinary dilution in the BPA sample, identified children with the highest quartile of uBPA with 1.77 mg/g higher ACR compared to the lowest quartile of uBPA (p=0.006). When ACR was modeled as a continuous variable, regression analysis adjusting only for urinary dilution identified a 0.50 mg/g increase in ACR for each log unit increase in uBPA(p=0.045). Increases in micro/macroalbuminuria were not significantly associated with log-transformed uBPA (OR 1.06, p=0.765) or quartiled uBPA (ORs for 2nd, 3rd and 4th quartiles above lowest 0.85, 1.32, 1.10 respectively, all p>0.2) in regression models adjusted only for urinary dilution in the BPA sample.
Association between uBPA and ACR, adjusting for urinary dilution and potential confounders
Addition of sociodemographic characteristics, other environmental exposures and potentially confounding medical conditions to the regression modeling failed to diminish the association of uBPA with low-grade albuminuria further (Table 2). In the final multivariable model examining quartiled uBPA, a 0.91 mg/g increase in ACR in the fourth quartile of uBPA is identified compared with the lowest (p=0.007). In the final multivariable regression model examining continuous measures of uBPA, for each log unit increase in urinary BPA, a 0.28 mg/g ACR increase was identified (p=0.030). No significant relationship was identified for micro/macroalbuminuria, either with log-transformed or quartiled uBPA.
Table 2.
Linear and Logistic Regression Analysis of Albumin-to-Creatinine Ratio Outcomes Against Quartiled and Log-Transformed Urinary Bisphenol A.
| Increment in Albumin- to-Creatinine Ratio | Odds of Micro/macroalbuminuria | |
|---|---|---|
| First Quartile | Reference | Reference |
| Second Quartile | +0.19 (−0.84, +1.45) | 0.66 (0.23, 1.85) |
| Third Quartile | +0.70 (−0.36, +1.98) | 1.22 (0.54, 2.72) |
| Fourth Quartile | +0.91 (+0.28, +1.63)** | 1.12 (0.26, 4.81) |
| Albumin-to-Creatinine Ratio | Odds of Micro/macroalbuminuria | |
|---|---|---|
| Increment per Log Unit Urinary BPA | +0.28 (+0.03, +0.52)* | 1.11 (0.77, 1.61) |
All models control for gender, poverty-income ratio, caregiver education, serum cotinine, urinary creatinine, age, prehypertension, insulin resistance, Body Mass Index, hypercholesterolemia and race/ethnicity categories.
For all models, n=667.
p <0.05,
p <0.01
Association of other environmental phenols with BPA and ACR
Increasing urinary triclosan was significantly associated with uBPA, but not ACR, adjusted for creatinine in the BPA sample. The highest quartile of benzophenone-3 was associated both with increased uBPA (p=0.066) and ACR (p=0.002) after adjusting for dilution of the BPA sample.
Table 3 confirms the absence of association of two other environmental phenols (triclosan and benzophenone-3) with ACR, whether examined as quartiled or log-transformed, and whether substituted for or added to log-transformed or quartiled uBPA in the final multivariable model. When urinary concentrations of the other environmental phenols were added to final multivariable models controlling for creatinine, sociodemographic characteristics, other environmental exposures and potentially confounding medical conditions, associations of quartiled and log-transformed uBPA with ACR remained nearly identical (changed by <10%). Neither quartiled triclosan nor benzophenone-3 were associated with ACR (p>0.267 throughout). The final results were robust both to alternate weighting and imputation of HOMA-IR (see Appendix Tables 1 and 2). In fact, on unweighted modeling, the dose-response relationship is strengthened, as the third quartile of uBPA is also associated with increases in ACR (0.79 mg/g increment, p=0.036) compared with the lowest, while association of the fourth quartile of uBPA with increased ACR remains essentially unchanged (0.94 mg/g increment, p=0.019).
Table 3.
Sensitivity Analysis of Albumin-to-Creatinine Ratio Associations with Urinary BPA.
| Triclosan quartile in lieu of BPA quartile | Albumin-to-Creatinine Ratio |
|---|---|
| First Quartile Triclosan | Reference |
| Second Quartile Triclosan | +0.11 (−0.84, +0.75) |
| Third Quartile Triclosan | +0.05 (−0.61, +1.32) |
| Fourth Quartile Triclosan | +0.01 (−0.69, +0.90) |
| Log-transformed Triclosan in lieu of BPA quartile | Albumin-to-Creatinine Ratio |
|---|---|
| Increment per Log Unit Triclosan | +0.02 (−0.14, +0.19) |
| Benzophenone-3 quartile in lieu of BPA quartile) | (Albumin-to-Creatinine Ratio |
|---|---|
| First Quartile Benzophenone-3 | Reference |
| Second Quartile Benzophenone-3 | +0.22 (−0.91, +1.63) |
| Third Quartile Benzophenone-3 | −0.27 (−0.91, +0.47) |
| Fourth Quartile Benzophenone-3 | +0.25 (−0.56, +1.21) |
| Log-transformed Benzophenone-3 in lieu of BPA quartile | Albumin-to-Creatinine Ratio |
|---|---|
| Increment per Log Unit Benzophenone- 3 | +0.03 (−0.14, +0.21) |
| All environmental phenols (BPA, Benzophenone-3 and Triclosan) | Albumin-to-Creatinine Ratio |
|---|---|
| First Quartile Triclosan | Reference |
| Second Quartile Triclosan | −0.09 (−0.87, +0.81) |
| Third Quartile Triclosan | +0.32 (−0.59, +1.40) |
| Fourth Quartile Triclosan | +0.11 (−0.59, +0.93) |
| First Quartile BPA | Reference |
| Second Quartile BPA | +0.21 (−0.81, +1.48) |
| Third Quartile BPA | +0.77 (−0.27, +2.05) |
| Fourth Quartile BPA | +0.91 (+0.26, +1.63)* |
| First Quartile Benzophenone-3 | Reference |
| Second Quartile Benzophenone-3 | +0.17 (−0.98, +1.62) |
| Third Quartile Benzophenone-3 | −0.07 (−1.04, +0.37) |
| Fourth Quartile Benzophenone-3 | +0.13 (−0.63, +1.01) |
| All environmental phenols, with log- transformed BPA in lieu of quartiled BPA | Albumin-to-Creatinine Ratio |
|---|---|
| First Quartile Triclosan | Reference |
| Second Quartile Triclosan | −0.09 (−0.87, +0.81) |
| Third Quartile Triclosan | +0.32 (−0.59, +1.40) |
| Fourth Quartile Triclosan | +0.11 (−0.59, +0.93) |
| Increment per Log Unit Urinary BPA | +0.28 (+0.02, +0.55)* |
| First Quartile Benzophenone-3 | Reference |
| Second Quartile Benzophenone-3 | +0.17 (−0.98, +1.62) |
| Third Quartile Benzophenone-3 | −0.38 (−1.04, +0.37) |
| Fourth Quartile Benzophenone-3 | +0.13 (−0.63 +1.01) |
| All environmental phenols, log- transformed | Albumin-to-Creatinine Ratio |
|---|---|
| Increment per Log Unit Triclosan | +0.04 (−0.14, +0.21) |
| Increment per Log Unit Urinary BPA | +0.27 (+0.03, +0.53)* |
| Increment per Log Unit Benzophenone- 3 | +0.01 (−0.14, +0.17) |
Each table represents a separate regression analysis. All models controls for gender, poverty-income ratio, caregiver education, serum cotinine, urinary creatinine, age, prehypertension, insulin resistance, Body Mass Index, hypercholesterolemia and race/ethnicity categories.
For all models, n=667.
p <0.05,
p <0.01
Appendix Table 1.
Linear and Logistic Regression Analysis of Albumin-to-Creatinine Ratio Outcomes Against Quartiled and Log-Transformed Urinary Bisphenol A (Imputed Insulin Resistance)
| Increment in Albumin- to-Creatinine Ratio | Odds of Micro/macroalbuminuria | |
|---|---|---|
| First Quartile | Reference | Reference |
| Second Quartile | +0.22 (−0.92, +1.62) | 0.66 (0.22, 1.97) |
| Third Quartile | +0.78 (−0.41, +2.22) | 1.22 (0.53, 2.82) |
| Fourth Quartile | +1.02 (+0.27, +1.87)* | 1.06 (0.25, 4.58) |
| Albumin-to-Creatinine Ratio | Odds of Micro/macroalbuminuria | |
|---|---|---|
| Increment per Log Unit Urinary BPA | +0.31 (+0.03, +0.61)* | 1.09 (0.76, 1.56) |
All models control for gender, poverty-income ratio, caregiver education, serum cotinine, urinary creatinine, age, prehypertension, insulin resistance, Body Mass Index, hypercholesterolemia and race/ethnicity categories.
For all models, n=667.
p <0.05,
p <0.01
Appendix Table 2.
Linear and Logistic Regression Analysis of Albumin-to-Creatinine Ratio Outcomes Against Quartiled and Log-Transformed Urinary Bisphenol A (Unweighted)
| Increment in Albumin- to-Creatinine Ratio | Odds of Micro/macroalbuminuria | |
|---|---|---|
| First Quartile | Reference | Reference |
| Second Quartile | +0.36 (−0.28, +1.09) | 0.50 (0.18, 1.42) |
| Third Quartile | +0.79 (+0.05, +1.63)* | 1.01 (0.38, 2.67) |
| Fourth Quartile | +0.94 (+0.14, +1.86)* | 0.73 (0.25, 2.17) |
| Albumin-to-Creatinine Ratio | Odds of Micro/macroalbuminuria | |
|---|---|---|
| Increment per Log | +0.29 (+0.02, +0.57)* | 1.04 (0.72, 1.52) |
| Unit Urinary BPA |
All models control for gender, poverty-income ratio, caregiver education, serum cotinine, urinary creatinine, age, prehypertension, insulin resistance, Body Mass Index, hypercholesterolemia and race/ethnicity categories.
For all models, n=667.
p <0.05,
p <0.01
DISCUSSION
We confirm and extend previous associations of uBPA with low-grade albuminuria in adults, and document these associations in a population of US children. These findings broaden the array of adverse effects associated with uBPA, for which the evidence is strongest for decrements in neurodevelopmental30,31 and fertility outcomes,32 and increases in obesity19,33 and cardiovascular disease.17,18
The consistent observation that higher levels of BPA excretion are associated with a higher risk of low grade albuminuria in children and adults implies that the mechanism of action is similar in both age groups. There was no association between uBPA and micro/macroalbuminuria in either children or adults. In view of the potential action of BPA to promote systemic complications such obesity and the metabolic syndrome,17,18,34 which are associated with oxidant stress,35 we suggest that the low grade albuminuria associated with higher levels of uBPA reflect oxidant stress and generalized endothelial dysfunction.
The finding that ACR was lower in the overweight children is consistent with other studies,36 but merits further discussion given that BPA is also associated with obesity.19,33 This presents an interesting conundrum, in that controlling for obesity should result in underestimation of associations of BPA with ACR. Given the relatively modest sample size, we did not have the capacity to examine effect stratification by BMI or interaction with overweight or obese status to interrogate this notion further. Ideally, such examination would be performed as part of longitudinal study examining the development of albuminuria in children and adolescents in association with antecedent BPA exposure. Given that endothelial dysfunction manifests as low-grade albuminuria, our study raises the concern that BPA exposure during childhood may contribute to early atherosclerotic changes in children and adolescents, similar to the development of angiographically confirmed coronary artery atherosclerosis associated with BPA exposure in adults.37
The small change in albumin excretion below the micro/macroalbuminuria threshold would not be consistent with intrinsic kidney disease or substantial alteration in glomerular barrier function. However, there is emerging evidence that microalbuminuria is an early and sensitive marker of future cardiovascular diseases including CKD even in healthy subjects.38 Moreover, in a group of healthy overweight/obese adults, levels of albumin excretion (10–29 mg/day) below the limit that is conventionally used to define microalbuminuria was associated with an adverse cardiovascular risk profile. 39 Finally, long-term follow up of 1208 patients with type 2 diabetes mellitus in the BENEDICT trial indicates that albuminuria independently predicts cardiovascular events as a continuous variable without any threshold effect; albuminuria at 1–2 μg/min was associated with a higher risk than values <1.40 The pediatric patients in our study had no demonstrable evidence of CKD; however, the low grade albuminuria associated with higher levels of BPA exposure may place them at increased lifetime risk of CKD as a manifestation of overall cardiovascular risk. The combined effect of BPA on obesity and endothelial dysfunction make it a potentially important factor that is amenable to modification in an effort to improve long term cardiovascular outcomes in the population.
Long-term observational studies will be needed to ascertain whether uBPA-associated changes in low grade albuminuria potentiate the features of the metabolic syndrome -- hypertension, hyperlipidemia, or insulin resistance -- and augment the risk of developing glomerular disease. Future studies of the relationship between uBPA and markers of vascular function such as pulse wave velocity41 and carotid intima media thickness in children42,43 would lend support to our suggestion that BPA promotes generalized endothelial dysfunction.
In a cross-sectional study, an obvious alternative is that children with low-grade albuminuria have unhealthy behaviors that otherwise lead to increases in urinary BPA. As with the previous Chinese, adult study,28 we included a relatively rich set of information about demographics, and exposure, variables, thus providing more convincing evidence that the association is not spurious. Data for diet and physical activity were not available for the present analysis, and these could be potential confounders insofar as they are related both to uBPA and ACR. While we were limited in our capacity to control for diabetes in this population due to relatively infrequent fasting insulin and glucose data, diabetes is relatively low in prevalence in children compared with adults,44,45 and multiple imputation did not significantly affect the association of uBPA with ACR. Finally, the absence of association between low-grade albuminuria and other environmental phenols argues for a specificity of the link to BPA.
The extent to which uBPA reflects current versus chronic exposure is uncertain.46,47 Microvascular processes such as those which have been identified in laboratory studies of BPA48 that lead to low-grade albuminuria may develop over time, and so the cross-sectional association of urinary BPA with increased low-grade albuminuria does not necessarily support causation, even when consistent with growing laboratory evidence.24,25 Even if earlier life exposures are biologically more plausible, recent evidence suggests that BPA may be stored in fat,49–51 increasing plausibility that current urinary BPA represents earlier, or more chronic, exposures. If current uBPA is a “noisy” index of early exposure, our estimates of association should be biased towards the null.52–54
While definitive causal evidence is likely to prove elusive, the evidence presented here suggests the need for heightened and broader urgency for efforts to limit exposure to this environmental chemical beginning in childhood. Alternatives to BPA include polyester coatings and oleoresin linings in cans as well as polyethylene plastic, glass and aluminum containers.55 FDA has recently declined to ban BPA,56 though it will continue to consider evidence on the safety of the chemical. Several US states have banned use of BPA in infant products.57 Globally, regulatory policies regarding environmental hazards vary; thus, while Canada classifies BPA as a toxic substance, the European Food Safety authority has not yet acted to ban BPA in baby bottles.58 Most recently, China outlawed BPA-containing baby bottles.59 Our findings argue in favor of more stringent standards for allowable exposure to BPA because the adverse effects we observed in pediatric patients would be leveraged over a lifetime and lead to prolonged cumulative target organ toxicity.
While there are US and international policy gaps in need of being addressed, there are also individual behaviors that can limit exposure to BPA. Daily consumption of canned soup produced 100-fold increases in urinary BPA in a small crossover trial,5 and in the absence of definitive evidence to confirm hazards of BPA, proactive and precautionary advice to limit exposure may be of benefit. Studies such as ours also highlight a possible opportunity for further research that may well transform our pathophysiological understanding of low-grade albuminuria from one that focuses on dietary risks to an approach that recognizes the role of environmental chemical factors that may independently impart risk of endothelial dysfunction and future cardiovascular disease.
METHODS
Data source and sample
NHANES is a continuous, multicomponent, nationally representative survey of the noninstitutionalized US population administered by the National Centers for Health Statistics (NCHS) of the Centers for Disease Control and Prevention (CDC). Data from the 2009–10 questionnaire, laboratory, and physical examination components were used in the present analysis. Of the 2,596 children ages 6–19 years who participated (Figure 1), our analytic sample comprised 710 nonpregnant participants with urinary BPA measurements and first morning urine samples with creatinine measurements. The New York University School of Medicine Institutional Review Board exempted this project from review on the basis of its analysis of an already collected and deidentified dataset.
Figure 1.
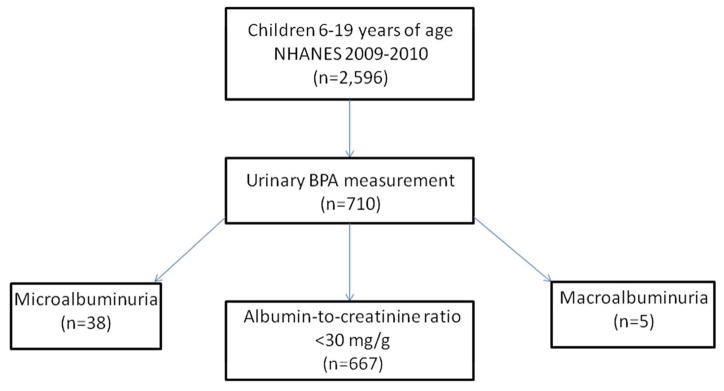
This diagram outlines the number of patients in the NHANES survey during 2009–10 with measuremens of urinary BPA. This subgroup is divided into three groups based on the albumin:creatinine ratio -- low level albuminura, microalbuminuria, and macroalbuminuria.
Measurement of Albumin-to-Creatinine Ratio (ACR)
Beginning in 2009–10, NHANES collected a first morning urine sample in a subsample of participants which enabled a standardized assessment of albuminuria without the confounding effect of orthostatic proteinuria. Urine specimens were then processed, stored and shipped to University of Minnesota, Minneapolis, MN for analysis of urinary albumin using a solid-phase fluorescent immunoassay described by Chavers et al.60 Measurement of urinary creatinine was performed on a Roche/Hitachi Modular P Chemistry Analyzer using an enzymatic method.
We calculated the albumin:creatinine ratio (ACR), and log-transformed ACR, because it had a skewed distribution. In analyses of ACR as a continuous variable, we excluded subjects with macroalbuminuria (≥300 mg/g, n=5) or microalbuminuria (30–300mg/g, n=38). In separate analyses, we modeled the probability of having either macroalbuminuria or microalbuminuria as categorical dependent variable.
Measurement of Urinary BPA
BPA was measured in one spot urine sample from each participant, and analyzed using high-performance liquid chromatography and tandem mass spectroscopy. This testing was done on a different urine sample than the first morning specimen used for determination of ACR. More extensive methodological description is provided elsewhere.61 For BPA concentrations below the level of detection (50, or 7.1%), we substituted the value of 0.3 ng/mL which is routinely assigned by NHANES. We log-transformed urinary BPA to account for skewed distribution, and also created unweighted sample quartiles for urinary BPA to allow for non-linearity in all of our tests of association, building on prior work in children and adults which has shown a non-linear relationship between urinary BPA and obesity.19,33
In order to adjust BPA levels for urinary concentration, the urinary creatinine level was determined in the spot urine sample, following usual practice.4,51
Control for Potential Confounders
Our analyses included an array of confounders that might be correlated with elevated ACR and/or BPA exposure. The first of these was hypertension. In NHANES, certified examiners assess systolic (first Korotkoff phase) and diastolic (fifth Korotkoff phase) BP three consecutive times in all children 8–19 years of age after they sit quietly for 5 minutes. A fourth attempt may be made if one or more of the initial measurements is incomplete or interrupted. We followed the common practice of averaging BP measurements for purposes of generating continuous and categorical BP variables.62 We calculated systolic/diastolic BP (BP) Z-scores from mixed-effects linear regression models derived using data from 1999–2000 CDC National Health and Nutrition Examination Survey (NHANES).63 We input height Z-scores derived from CDC norms, gender and age to compute expected systolic/diastolic BPs,64 and calculated BP Z-scores from the measured BPs using the formula , where x is the measured BP, μ is the expected BP, and σ is derived from the same NHANES data. We categorized BP outcomes into present/absent prehypertension (BP≥90th percentile for age/height Z-score/gender).
Because exposure to tobacco smoke is as a risk for metabolic syndrome in adolescence,65 we included serum cotinine in multivariable models. We categorized children and adolescents into low (<0.015 ng/mL, the limit of detection for NHANES 2003–6), medium (<2 and ≥0.015 ng/mL) and high (≥2 ng/mL) categories, following practices of previous authors.66,67
Race/ethnicity was categorized into Mexican American, Other Hispanic, Non-Hispanic White, Non-Hispanic Black and Other in the NHANES. Caregiver education was categorized as: less than 9th grade, 9th–12th grade, high school or graduate equivalency diploma, some college, college or greater. Poverty-income ratio was categorized into quartiles, within the sample for which urinary BPA was measured. Age was categorized into two groups: 6–11 and 12–19 years.
In the NHANES, trained health technicians assessed body measurements, following published, standardized measurement procedures.68 Body mass index (BMI) Z-scores were derived from 2000 Centers for Disease Control and Prevention (CDC) gender-specific norms, and overweight and obese were categorized as BMI Z-score ≥1.036 (85th percentile for age and gender) and ≥1.64 (95th percentile), respectively.64,69
Cholesterol measurement was performed using a Roche Modular P chemistry analyzer after applying an enzymatic method. A cutpoint of 170 mg/dL was applied to dichotomize participants into high and low subgroups, following guidelines of the American Academy of Pediatrics National Cholesterol Education Program.70
Fasting insulin and glucose are available in a partially overlapping subsample of participants (n=142). HOMA-IR was calculated from fasting insulin and glucose (measured only in adolescents), and we also utilized the cutpoint of 4.39 (>2 SD above mean HOMA-IR for normal-weight adolescents with normal fasting glucose) identified by Lee et al in NHANES 1999–2002).71 Recognizing our modest capacity to control for insulin resistance in the present analysis, we created a “missing” category for this and all potential confounders to maximize sample size in multivariable analysis. Serum cotinine was missing in 26.5%, 11.4% had missing cholesterol data and 17.0% had missing blood pressure data. Otherwise, <5% of values were missing for each confounding variable.
Statistical analysis
The sample was described, applying sample weights according to the National Center for Health Statistics guidelines to produce national estimates, adjusting for the oversampling of racial/ethnic minorities and young children.72 Appropriately-weighted univariable, bivariable and multivariable analyses were conducted in a fashion that reflects the complex survey sampling design, using Stata 12.0 (College Station, TX) survey (‘svy’) commands.
Our analyses of the association modeled the relationship between log-transformed uBPA and ACR specified two ways: (1) quartiles of ACR in the sample, and (2) log-transformed ACR. We performed univariate regression analyses of the association between ACR and the potential confounders named above, and regression analyses of the association between urinary BPA and potential confounders, first adjusting only for dilution. OLS regression was used in the full multivariable analysis predicating ACR, and, which adjusted for urinary creatinine; demographic and exposure characteristics (race/ethnicity, age, caregiver education, poverty-income ratio, gender, serum cotinine), as well as BMI, elevated cholesterol, prehypertension and insulin resistance categories.
Analysis for specificity of effect
Urinary levels of environmental phenols that are chemically similar to BPA and were measured in NHANES (benzophenone-3 and triclosan) were categorized into quartiles and examined for their association with ACR. Quartiles of these other phenols, and log-transformed concentrations were also added to the final multivariable models, both individually and as a group.
Other sensitivity analyses
To ensure that our results were not an artifact of statistical weighting, we reprised our analyses in unweighted modeling, which is well-known to enhance statistical efficiency while maintaining validity, especially when the analyses are intended to determine associations within a sample population rather than estimating prevalence of a condition or mean for a biological outcome (such as blood pressure or insulin).51, 52 We also utilized multiple imputation techniques,73 to generate randomly a replacement value for each missing data point for categorical insulin resistance data, based upon BMI category- and race/ethnicity-specific rates identified in the NHANES sample. We performed 20 imputations for the imputed variable following common practice,74 and reprised the full multivariable model using the ‘mi estimate’ command in Stata 12.0 to assess whether this impacted relationships of log-transformed urinary BPA or quartiled BPA with ACR.
Acknowledgments
We thank Jan Blustein of the Wagner School of Public Service for her thoughtful review and commentary on the manuscript.
Abbreviations
- ACR
Albumin-to-creatinine ratio
- BPA
Bisphenol A
- BP
Blood Pressure
- BMI
Body Mass Index
- CDC
Centers for Disease Control and Prevention
- HOMA-IR
Homeostatic model assessment of insulin resistance
- NCHS
National Centers for Health Statistics
- NHANES
National Health and Nutrition Examination Survey
- SD
standard deviation
Footnotes
DISCLOSURE STATEMENT
There are no competing financial or other interests to disclose.
References
- 1.Geens T, Apelbaum TZ, Goeyens L, Neels H, Covaci A. Intake of bisphenol A from canned beverages and foods on the Belgian market. Food additives & contaminants Part A, Chemistry, analysis, control, exposure & risk assessment. 2010;27:1627–1637. doi: 10.1080/19440049.2010.508183. [DOI] [PubMed] [Google Scholar]
- 2.Noonan GO, Ackerman LK, Begley TH. Concentration of bisphenol A in highly consumed canned foods on the U.S. market. Journal of agricultural and food chemistry. 2011;59:7178–7185. doi: 10.1021/jf201076f. [DOI] [PubMed] [Google Scholar]
- 3.Schecter A, et al. Bisphenol A (BPA) in U.S. food. Environmental science & technology. 2010;44:9425–9430. doi: 10.1021/es102785d. [DOI] [PubMed] [Google Scholar]
- 4.Calafat AM, Ye X, Wong LY, Reidy JA, Needham LL. Exposure of the U.S. population to bisphenol A and 4-tertiary-octylphenol: 2003–2004. Environmental health perspectives. 2008;116:39–44. doi: 10.1289/ehp.10753. [DOI] [PMC free article] [PubMed] [Google Scholar]
- 5.Carwile JL, Ye X, Zhou X, Calafat AM, Michels KB. Canned Soup Consumption and Urinary Bisphenol A: A Randomized Crossover Trial. JAMA: The Journal of the American Medical Association. 2011;306:2218–2220. doi: 10.1001/jama.2011.1721. [DOI] [PMC free article] [PubMed] [Google Scholar]
- 6.Fleisch AF, Sheffield PE, Chinn C, Edelstein BL, Landrigan PJ. Bisphenol A and related compounds in dental materials. Pediatrics. 2010;126:760–768. doi: 10.1542/peds.2009-2693. [DOI] [PMC free article] [PubMed] [Google Scholar]
- 7.Schwartz AW, Landrigan PJ. Bisphenol A in thermal paper receipts: an opportunity for evidence-based prevention. Environmental health perspectives. 2012;120:A14–15. doi: 10.1289/ehp.1104004. author reply A15. [DOI] [PMC free article] [PubMed] [Google Scholar]
- 8.Masuno H, et al. Bisphenol A in combination with insulin can accelerate the conversion of 3T3- L1 fibroblasts to adipocytes. Journal of lipid research. 2002;43:676–684. [PubMed] [Google Scholar]
- 9.Sakurai K, et al. Bisphenol A affects glucose transport in mouse 3T3-F442A adipocytes. British journal of pharmacology. 2004;141:209–214. doi: 10.1038/sj.bjp.0705520. [DOI] [PMC free article] [PubMed] [Google Scholar]
- 10.Hugo ER, et al. Bisphenol A at environmentally relevant doses inhibits adiponectin release from human adipose tissue explants and adipocytes. Environmental health perspectives. 2008;116:1642–1647. doi: 10.1289/ehp.11537. [DOI] [PMC free article] [PubMed] [Google Scholar]
- 11.Ben-Jonathan N, Hugo ER, Brandebourg TD. Effects of bisphenol A on adipokine release from human adipose tissue: Implications for the metabolic syndrome. Molecular and cellular endocrinology. 2009;304:49–54. doi: 10.1016/j.mce.2009.02.022. [DOI] [PMC free article] [PubMed] [Google Scholar]
- 12.Howdeshell KL, Hotchkiss AK, Thayer KA, Vandenbergh JG, vom Saal FS. Exposure to bisphenol A advances puberty. Nature. 1999;401:763–764. doi: 10.1038/44517. [DOI] [PubMed] [Google Scholar]
- 13.vom Saal FS, Hughes C. An extensive new literature concerning low-dose effects of bisphenol A shows the need for a new risk assessment. Environmental health perspectives. 2005;113:926–933. doi: 10.1289/ehp.7713. [DOI] [PMC free article] [PubMed] [Google Scholar]
- 14.Zoeller RT, Bansal R, Parris C. Bisphenol-A, an environmental contaminant that acts as a thyroid hormone receptor antagonist in vitro, increases serum thyroxine, and alters RC3/neurogranin expression in the developing rat brain. Endocrinology. 2005;146:607–612. doi: 10.1210/en.2004-1018. [DOI] [PubMed] [Google Scholar]
- 15.Alonso-Magdalena P, et al. Low doses of bisphenol A and diethylstilbestrol impair Ca2+ signals in pancreatic alpha-cells through a nonclassical membrane estrogen receptor within intact islets of Langerhans. Environmental health perspectives. 2005;113:969–977. doi: 10.1289/ehp.8002. [DOI] [PMC free article] [PubMed] [Google Scholar]
- 16.Lang IA, et al. Association of urinary bisphenol A concentration with medical disorders and laboratory abnormalities in adults. JAMA: the journal of the American Medical Association. 2008;300:1303–1310. doi: 10.1001/jama.300.11.1303. [DOI] [PubMed] [Google Scholar]
- 17.Melzer D, Rice NE, Lewis C, Henley WE, Galloway TS. Association of urinary bisphenol a concentration with heart disease: evidence from NHANES 2003/06. PloS one. 2010;5:e8673. doi: 10.1371/journal.pone.0008673. [DOI] [PMC free article] [PubMed] [Google Scholar]
- 18.Melzer D, et al. Urinary bisphenol a concentration and risk of future coronary artery disease in apparently healthy men and women. Circulation. 2012;125:1482–1490. doi: 10.1161/CIRCULATIONAHA.111.069153. [DOI] [PubMed] [Google Scholar]
- 19.Carwile JL, Michels KB. Urinary bisphenol A and obesity: NHANES 2003–2006. Environmental research. 2011;111:825–830. doi: 10.1016/j.envres.2011.05.014. [DOI] [PMC free article] [PubMed] [Google Scholar]
- 20.Wang T, et al. Urinary bisphenol A (BPA) concentration associates with obesity and insulin resistance. The Journal of clinical endocrinology and metabolism. 2012;97:E223–227. doi: 10.1210/jc.2011-1989. [DOI] [PubMed] [Google Scholar]
- 21.Trasande L, Attina TM, Blustein J. Association Between Urinary Bisphenol A Concentration and Obesity Prevalence in Children and Adolescents. JAMA: the journal of the American Medical Association. 2012;308:1113–1121. doi: 10.1001/2012.jama.11461. [DOI] [PubMed] [Google Scholar]
- 22.Hasselberg L, Meier S, Svardal A. Effects of alkylphenols on redox status in first spawning Atlantic cod (Gadus morhua) Aquatic Toxicology. 2004;69:95–105. doi: 10.1016/j.aquatox.2004.04.004. [DOI] [PubMed] [Google Scholar]
- 23.Atkinson A, Roy D. In vivo DNA adduct formation by bisphenol A. Environmental and Molecular Mutagenesis. 1995;26:60–66. doi: 10.1002/em.2850260109. [DOI] [PubMed] [Google Scholar]
- 24.Korkmaz A, Aydoğan M, Kolankaya D, Barlas N. Vitamin C coadministration augments bisphenol A, nonylphenol, and octylphenol induced oxidative damage on kidney of rats. Environmental Toxicology. 2011;26:325–337. doi: 10.1002/tox.20556. [DOI] [PubMed] [Google Scholar]
- 25.Rashid H, et al. Iron deficiency augments bisphenol A-induced oxidative stress in rats. Toxicology. 2009;256:7–12. doi: 10.1016/j.tox.2008.10.022. [DOI] [PubMed] [Google Scholar]
- 26.Danziger J. Importance of Low-Grade Albuminuria. Mayo Clinic Proceedings. 2008;83:806–812. doi: 10.4065/83.7.806. [DOI] [PubMed] [Google Scholar]
- 27.Kuo HK, Al Snih S, Kuo YF, Raji MA. Chronic inflammation, albuminuria, and functional disability in older adults with cardiovascular disease: The National Health and Nutrition Examination Survey, 1999–2008. Atherosclerosis. 2012;222:502–508. doi: 10.1016/j.atherosclerosis.2012.03.004. [DOI] [PubMed] [Google Scholar]
- 28.Li M, et al. Exposure to bisphenol A is associated with low-grade albuminuria in Chinese adults. Kidney Int. 2012;81:1131–1139. doi: 10.1038/ki.2012.6. [DOI] [PubMed] [Google Scholar]
- 29.National Research, C. Pesticides in the Diets of Infants and Children. 1993. [PubMed] [Google Scholar]
- 30.Braun JM, et al. Impact of early-life bisphenol A exposure on behavior and executive function in children. Pediatrics. 2011;128:873–882. doi: 10.1542/peds.2011-1335. [DOI] [PMC free article] [PubMed] [Google Scholar]
- 31.Sathyanarayana S, Braun JM, Yolton K, Liddy S, Lanphear BP. Case report: high prenatal bisphenol a exposure and infant neonatal neurobehavior. Environmental health perspectives. 2011;119:1170–1175. doi: 10.1289/ehp.1003064. [DOI] [PMC free article] [PubMed] [Google Scholar]
- 32.Meeker JD, Calafat AM, Hauser R. Urinary bisphenol A concentrations in relation to serum thyroid and reproductive hormone levels in men from an infertility clinic. Environmental science & technology. 2010;44:1458–1463. doi: 10.1021/es9028292. [DOI] [PMC free article] [PubMed] [Google Scholar]
- 33.Trasande L, Attina TM, Blustein J, Bisphenol A. Childhood Obesity and Economic Consequences. JAMA. 2012 submitted. [Google Scholar]
- 34.Lang IA, et al. Association of Urinary Bisphenol A Concentration With Medical Disorders and Laboratory Abnormalities in Adults. JAMA: The Journal of the American Medical Association. 2008;300:1303–1310. doi: 10.1001/jama.300.11.1303. [DOI] [PubMed] [Google Scholar]
- 35.Ceriello A, Motz E. Is Oxidative Stress the Pathogenic Mechanism Underlying Insulin Resistance, Diabetes, and Cardiovascular Disease? The Common Soil Hypothesis Revisited. Arteriosclerosis, Thrombosis, and Vascular Biology. 2004;24:816–823. doi: 10.1161/01.ATV.0000122852.22604.78. [DOI] [PubMed] [Google Scholar]
- 36.Nguyen S, McCulloch C, Brakeman P, Portale A, Hsu C-y. Being Overweight Modifies the Association Between Cardiovascular Risk Factors and Microalbuminuria in Adolescents. Pediatrics. 2008;121:37–45. doi: 10.1542/peds.2007-3594. [DOI] [PMC free article] [PubMed] [Google Scholar]
- 37.Melzer D, et al. Urinary bisphenol a concentration and angiography-defined coronary artery stenosis. PloS one. 2012;7:e43378. doi: 10.1371/journal.pone.0043378. [DOI] [PMC free article] [PubMed] [Google Scholar]
- 38.Ochodnicky P, Henning RH, van Dokkum RP, de Zeeuw D. Microalbuminuria and endothelial dysfunction: emerging targets for primary prevention of end-organ damage. Journal of cardiovascular pharmacology. 2006;47(Suppl 2):S151–162. doi: 10.1097/00005344-200606001-00009. discussion S172–156. [DOI] [PubMed] [Google Scholar]
- 39.Cubeddu LX, Alfieri AB, Hoffmann IS. Lowering the threshold for defining microalbuminuria: effects of a lifestyle-metformin intervention in obese “normoalbuminuric” non-diabetic subjects. American journal of hypertension. 2008;21:105–110. doi: 10.1038/ajh.2007.6. [DOI] [PubMed] [Google Scholar]
- 40.Sandel M, Wright RJ. When home is where the stress is: expanding the dimensions of housing that influence asthma morbidity. Arch Dis Child. 2006;91:942–948. doi: 10.1136/adc.2006.098376. [DOI] [PMC free article] [PubMed] [Google Scholar]
- 41.Urbina EM, Kimball TR, Khoury PR, Daniels SR, Dolan LM. Increased arterial stiffness is found in adolescents with obesity or obesity-related type 2 diabetes mellitus. Journal of Hypertension. 2010;28:1692–1698. doi: 10.1097/HJH.0b013e32833a6132. 1610.1097/HJH.1690b1013e32833a36132. [DOI] [PMC free article] [PubMed] [Google Scholar]
- 42.Jourdan C, et al. Normative values for intima-media thickness and distensibility of large arteries in healthy adolescents. Journal of Hypertension. 2005;23:1707–1715. doi: 10.1097/01.hjh.0000178834.26353.d5. [DOI] [PubMed] [Google Scholar]
- 43.Urbina EM, et al. Youth With Obesity and Obesity-Related Type 2 Diabetes Mellitus Demonstrate Abnormalities in Carotid Structure and Function. Circulation. 2009;119:2913–2919. doi: 10.1161/CIRCULATIONAHA.108.830380. [DOI] [PMC free article] [PubMed] [Google Scholar]
- 44.Lee JM, Okumura MJ, Freed GL, Menon RK, Davis MM. Trends in hospitalizations for diabetes among children and young adults: United States, 1993–2004. Diabetes Care. 2007;30:3035–3039. doi: 10.2337/dc07-0769. [DOI] [PubMed] [Google Scholar]
- 45.Lipton RB. Incidence of Diabetes in Children and Youth—Tracking a Moving Target. JAMA: The Journal of the American Medical Association. 2007;297:2760–2762. doi: 10.1001/jama.297.24.2760. [DOI] [PubMed] [Google Scholar]
- 46.Volkel W, Colnot T, Csanady GA, Filser JG, Dekant W. Metabolism and kinetics of bisphenol a in humans at low doses following oral administration. Chemical research in toxicology. 2002;15:1281–1287. doi: 10.1021/tx025548t. [DOI] [PubMed] [Google Scholar]
- 47.Yoo SD, et al. Pharmacokinetic disposition and tissue distribution of bisphenol A in rats after intravenous administration. Journal of toxicology and environmental health Part A. 2000;61:131–139. doi: 10.1080/00984100050120415. [DOI] [PubMed] [Google Scholar]
- 48.Andersson H, Brittebo E. Proangiogenic effects of environmentally relevant levels of bisphenol A in human primary endothelial cells. Archives of toxicology. 2012;86:465–474. doi: 10.1007/s00204-011-0766-2. [DOI] [PubMed] [Google Scholar]
- 49.Fernandez MF, et al. Bisphenol-A and chlorinated derivatives in adipose tissue of women. Reprod Toxicol. 2007;24:259–264. doi: 10.1016/j.reprotox.2007.06.007. [DOI] [PubMed] [Google Scholar]
- 50.Nunez AA, Kannan K, Giesy JP, Fang J, Clemens LG. Effects of Bisphenol A on energy balance and accumulation in brown adipose tissue in rats. Chemosphere. 2001;42:917–922. doi: 10.1016/s0045-6535(00)00196-x. [DOI] [PubMed] [Google Scholar]
- 51.Stahlhut RW, Welshons WV, Swan SH. Bisphenol A data in NHANES suggest longer than expected half-life, substantial nonfood exposure, or both. Environmental health perspectives. 2009;117:784–789. doi: 10.1289/ehp.0800376. [DOI] [PMC free article] [PubMed] [Google Scholar]
- 52.Carroll RJ. Measurement Error in Epidemiologic Studies. In: Armitage P, Colton T, editors. Encyclopedia of Biostatistics. New York (NY): John Wiley &Sons; 1998. [Google Scholar]
- 53.Fleiss JL, Shrout PE. The effects of measurement errors on some multivariate procedures. American journal of public health. 1977;67:1188–1191. doi: 10.2105/ajph.67.12.1188. [DOI] [PMC free article] [PubMed] [Google Scholar]
- 54.Fuller WA. Measurement Error Models. New York: Wiley; 1987. [Google Scholar]
- 55.Layton L. Washington Post. Feb 23, 2010. Alternatives to BPA containers not easy for U.S. foodmakers to find. [Google Scholar]
- 56.Festi D, et al. Hepatic steatosis in obese patients: clinical aspects and prognostic significance. Obes Rev. 2004;5:27–42. doi: 10.1111/j.1467-789x.2004.00126.x. [DOI] [PubMed] [Google Scholar]
- 57.Smith KR, Corvalan CF, Kjellstrom T. How Much Global Ill Health Is Attributable to Environmental Factors? Epidemiology. 1999;10:573–584. [PubMed] [Google Scholar]
- 58.Santry HP, Gillen DL, Lauderdale DS. Trends in Bariatric Surgical Procedures. Am Med Assoc. 2005;294:1909–1917. doi: 10.1001/jama.294.15.1909. [DOI] [PubMed] [Google Scholar]
- 59.Szneke P, Nielsen C, Tolentino N. Connecticut physicians’ knowledge and needs assessment of environmentally related health hazards--a survey. Conn Med. 1994;58:131–135. [PubMed] [Google Scholar]
- 60.Chavers BM, Simonson J, Michael AF. A solid phase fluorescent immunoassay for the measurement of human urinary albumin. Kidney Int. 1984;25:576–578. doi: 10.1038/ki.1984.57. [DOI] [PubMed] [Google Scholar]
- 61.Balk SJ. The environmental history: asking the right questions. Contemp Pediatr. 1996;13:19–36. [Google Scholar]
- 62.Ostchega Y, et al. Trends of Elevated Blood Pressure Among Children and Adolescents: Data From the National Health and Nutrition Examination Survey 1988–2006. Am J Hypertens. 2008;22:59– 67. doi: 10.1038/ajh.2008.312. [DOI] [PubMed] [Google Scholar]
- 63.National High Blood Pressure Education Program Working Group on High Blood Pressure in C & Adolescents. The Fourth Report on the Diagnosis, Evaluation, and Treatment of High Blood Pressure in Children and Adolescents. Pediatrics. 2004;114:555–576. [PubMed] [Google Scholar]
- 64.Ogden CL, et al. Centers for Disease Control and Prevention 2000 growth charts for the United States: improvements to the 1977 National Center for Health Statistics version. Pediatrics. 2002;109:45–60. doi: 10.1542/peds.109.1.45. [DOI] [PubMed] [Google Scholar]
- 65.Weitzman M, et al. Tobacco smoke exposure is associated with the metabolic syndrome in adolescents. Circulation. 2005;112:862–869. doi: 10.1161/CIRCULATIONAHA.104.520650. [DOI] [PubMed] [Google Scholar]
- 66.Strauss RS. Environmental tobacco smoke and serum vitamin C levels in children. Pediatrics. 2001;107:540–542. doi: 10.1542/peds.107.3.540. [DOI] [PubMed] [Google Scholar]
- 67.Wilson KM, Finkelstein JN, Blumkin AK, Best D, Klein JD. Micronutrient levels in children exposed to secondhand tobacco smoke. Nicotine & tobacco research: official journal of the Society for Research on Nicotine and Tobacco. 2011;13:800–808. doi: 10.1093/ntr/ntr076. [DOI] [PubMed] [Google Scholar]
- 68.Lohman T, Roche A, Martore R. Anthropometric Standardization Reference Manual. Champaign, Illinois: Human Kinetics Books; 1998. [Google Scholar]
- 69.Grummer-Strawn LM, Reinold C, Krebs NF. Use of World Health Organization and CDC growth charts for children aged 0–59 months in the United States. MMWR. Recommendations and reports: Morbidity and mortality weekly report. Recommendations and reports/Centers for Disease Control. 2010;59:1–15. [PubMed] [Google Scholar]
- 70.American Academy of Pediatrics. National Cholesterol Education Program: report of the expert panel on blood cholesterol levels in children and adolescents. Pediatrics. 1992;89:525–527. [PubMed] [Google Scholar]
- 71.Lee JM, Okumura MJ, Davis MM, Herman WH, Gurney JG. Prevalence and Determinants of Insulin Resistance Among U.S. Adolescents. Diabetes Care. 2006;29:2427–2432. doi: 10.2337/dc06-0709. [DOI] [PubMed] [Google Scholar]
- 72.US Centers for Disease Control and Prevention. [Accessed 4 April 2012];Overview of NHANES Survey Design and Weights. 2012 Available at http://www.cdc.gov/nchs/tutorials/dietary/SurveyOrientation/SurveyDesign/intro.htm.
- 73.Rubin DB. Multiple Imputation for Nonresponse in Surveys. John Wiley & Sons, Inc; New York: 1987. [Google Scholar]
- 74.Graham J, Olchowski A, Gilreath T. How Many Imputations are Really Needed? Some Practical Clarifications of Multiple Imputation Theory. Prevention Science. 2007;8:206–213. doi: 10.1007/s11121-007-0070-9. [DOI] [PubMed] [Google Scholar]