Abstract
Peroxisome proliferator-activated receptor gamma coactivator 1α (PGC-1α) co-activates a number of transcription factors critical for mitochondrial biogenesis. Previously, we found that the expression of PGC-1α is governed by neuronal activity, but the signaling mechanism was poorly understood. The present study aimed at testing our hypothesis that depolarizing activation of PGC-1α in neurons is mediated by p38 mitogen-activated protein kinase (MAPK) and calcium channels. Cultured primary neurons and N2a cells were depolarized with 20 mM KCl for varying times, and increases in PGC-1α mRNA and protein levels were found after 0.5 and 1 hour of stimulation, respectively. These levels returned to those of controls after the withdrawal of KCl. Significantly, 15 min of KCl stimulation induced an up-regulation of both p38 MAPK and phosphorylated p38 MAPK that were suppressed by 30 minutes of pretreatment with SB203580, a blocker of p38 MAPK that also blocked the up-regulation of PGC-1α by KCl. Likewise, 30 minutes of pretreatment with nifedipine, a calcium channel blocker, also prevented the up-regulation of PGC-1α mRNA and proteins by KCl. Furthermore, a knockdown of p38 MAPK with small interference hairpin RNA significantly suppressed both PGC-1α mRNA and protein levels. Our results indicate that both p38 MAPK and calcium play important roles in mediating signaling in depolarization-induced activation of PGC-1α at the protein and message levels in neurons.
Keywords: PGC-1α, p38 MAPK, p38 shRNA, potassium chloride depolarization, SB203580
INTRODUCTION
Peroxisome proliferator-activated receptor-gamma coactivator 1 alpha (PGC-1α) is a coactivator that plays a key role in regulating mitochondrial biogenesis, thermogenesis, and responses to environmental stressors (Knutti and Kralli, 2001; Lin et al., 2005; Wright et al., 2007a; Scarpulla, 2008). PGC-1α is induced by endurance exercise, fasting, and cold exposure in skeletal muscle, hepatocytes, and adipocytes, respectively (Puigserver et al., 1998; Baar et al., 2002; Irrcher et al., 2003; Rhee et al., 2003; Norrbom et al., 2004; Arany, 2008). It binds to and/or co-activates with a number of transcription factors, notably PPARγ, nuclear respiratory factors 1 and 2 (NRF-1 and NRF-2), as well as several hormone receptors in regulating energy metabolism and other mitochondrial functions in a variety of cell types (Lin et al., 2002; Scarpulla 2002; Kelly and Scarpulla 2004; Mootha et al., 2004; Schreiber et al., 2004; Scarpulla, 2008). Stimulation of PGC-1α gene expression during increased muscular activity or in response to cardiac metabolic stressor is thought to involve the p38 mitogen-activated protein kinase (MAPK) pathway (Barger et al., 2001; Akimoto et al., 2005; Wright et al., 2007a), which, in turn, is regulated by a calcium/calmodulin-dependent protein kinase cascade (Enslen et al., 1996). Very little was known about the functional significance of PGC-1α in neurons, and virtually nothing was known about the signaling pathways involved in its response to increased neuronal activity.
Previously, we have shown that PGC-1α was expressed in rat visual cortical neurons, and functional inactivation induced a down-regulation of its mRNAs and proteins both in vivo and in vitro (Liang and Wong-Riley 2006). Depolarization with potassium chloride increased PGC-1α proteins in cultured neurons (Meng et al., 2007). However, it was not known if the regulation is at the transcriptional level and if it requires specific signaling pathways. The goal of the present study was to test our hypothesis that p38 MAPK and calcium channels mediate signaling in depolarization-induced activation of PGC-1α in neurons. Primary cultures of neurons were subjected to 20 mM potassium chloride, a proven agent of mild depolarizing activation, to determine changes in message and protein levels of PGC-1α. The essential roles of p38 MAPK and calcium channels in such an activation were tested by means of specific inhibitors of p38 MAPK and calcium channels, as well as RNA interference against p38 MAPK. Our results are consistent with and strongly supportive of our hypothesis that p38 MAPK and calcium channels mediate PGC-1α activation in depolarization-stimulated neurons.
MATERIALS AND METHODS
Primary cortical neuronal cultures
All experiments were carried out in accordance with the National Institutes of Health Guide for the Care and Use of Laboratory Animals (NIH Publications No. 80–23, revised 1978), and all animal protocols were approved by the institutional animal care committee of the Medical College of Wisconsin. All efforts were made to minimize the number of animals and their suffering.
Primary visual cortical neurons were prepared from 1–2 day old Sprague–Dawley rat pups as described previously (Liang and Wong-Riley 2006). Neurons were plated in poly-L-lysine-coated dishes or coverslips at a density of 1–5 × 10⁶ cells/ml (depending on the experimental demand). Cells were maintained in Neurobasal-A media supplemented with B27 (Invitrogen, Carlsbad, CA). Ara-C (Sigma, St. Louis, MO) was added to the media on the second day of plating to inhibit the proliferation of non-neuronal cells. Neuronal cultures were maintained by replacing half of the medium every 5 days.
Murine Neuro-2a neuroblastoma (N2a) cell culture
N2a cells (ATCC, CCL-131) were grown in Dulbecco’s modified Eagle’s medium supplemented with 10% fetal bovine serum (Invitrogen).
Potassium chloride depolarization of cultured neurons
Potassium chloride (Sigma) at a final concentration of 20 mM was added to the culture media from the 7th day after plating. Cultures of N2a cells or primary neurons were depolarized for 0.25, 0.5, 1, 3, 5, 7 or 10 h. For KCl withdrawal studies, primary neurons were maintained in Neurobasal medium with 20 mM KCl for 5 h, then washed with serum-free medium, and grown in normal Neurobasal medium for 0, 0.5, 1, 3, and 5 h.
RNA isolation and cDNA synthesis
Total RNA was isolated by RNAeasy Kits (Qiagen Inc, Valencia, CA) according to the manufacturer’s instructions. Two μg total RNA was treated with DNase I and purified by phenol-chloroform. cDNA was synthesized using random hexamer primers and SuperScript™ II RNase H-Reverse Transcriptase (Invitrogen) according to the manufacturer’s instructions.
Real-time quantitative PCR (RTqPCR)
Real-time quantitative PCRs were carried out in a Cepheid Smart Cycler Detection system (Cepheid, Sunnyvale, CA). SyBr Green (Biowhittaker Molecular Application) and EX Taq RTqPCR hot-start polymerase were used following the manufacturer’s protocols and as described previously (Liang and Wong-Riley 2006). PGC-1α primer sequences are as fellows: forward: 5′caatgaatgcagcggtctta 3′, reverse: 5′acgtctttgtggcttttgct 3′; 18S: forward: 5′ cgcggttctattttgttggt 3′, reverse: 5′ agtcggcatcgtttatggtc3′. PCR runs: hot start 2 min at 95°C, denaturation 10 sec at 95°C, annealing 15 sec according to the Tm of each primer, and extension 10 sec at 72°C for 15–30 cycles. Melt curve analyses verified the formation of a single, desired PCR product. Ribosomal 18S RNA was the internal control and the 2-ΔΔCT method (Livak and Schmittgen 2001) was used for the relative amount of transcripts. The group means were then analyzed for overall statistical significance.
Western blot assay
Control and experimental samples were loaded onto 7.5% or 10% SDS-PAGE gel and electrophoretically transferred onto polyvinylidene difluoride (PVDF) membranes (Bio-Rad). Subsequent to blocking, blots were incubated in primary antibodies against PGC-1α (Biotechnology, Inc. Santa Cruz, CA) at 1:1000; p38 MAPK, phospho-p38 MAPK and SAPK/JNK (Cell Signaling Technology, Inc. Danevers, MA) at 1:1000; GAPDH (Chemicon, Temecula, CA) at 1:2,000; β-actin (Sigma) at 1:3,000; and secondary goat-anti-rabbit or goat –anti-mouse antibodies (Bio-Rad) at 1:5,000. Blots were then reacted with ECL and exposed to autoradiographic film (Amersham, Piscataway, NJ). Quantitative analyses of relative changes were done with an Alpha Imager (Alpha Innotech, San Leandro, CA).
SB203580 and JNKI-1 pretreatment in cultured primary neurons and N2a cells
p38 MAPK inhibitor, SB203580 (AG Scientific, San Diego, CA) at a final concentration of 2.5 μM or 5 μM, or JNK inhibitor, JNKI-1 (AXXORA, San Diego, CA) at a final concentration of 1 μM was added to the primary neuronal and N2a cell culture medium 30 min before KCl treatment and for 1 h in the presence of 20 mM KCl. Since N2a cells and primary neurons gave almost identical results, only N2a cells were used for repeated JNK inhibitor studies.
Nifedipine treatment of cultured primary neurons
Nifedipine (Sigma) at a concentration of 10, 50, or 100 μM was added to the culture medium 30 min before KCl depolarization and for 5 h in the presence of 20 mM KCl.
Knockdown of p38 MAPK by means of small hairpin interference RNA (p38 shRNA)
p38 shRNA plasmid for mouse were obtained from Santa Cruz Biotechnology (Santa Cruz Biotechnology, sc-29434-SH) as a pool of 3 target-specific lentiviral vectors with H1 promoter, green fluorescent protein reporter, and puromycin resistance. Each vector encompassed 19–25 nt (plus hairpin) shRNAs designed to knock down gene expression of p38 MAPK. Control shRNA plasmid-A (Santa Cruz Biotechnology, sc-108062) or scrambled shRNA served as negative controls. N2a cells were plated in 60-mm dishes at a density of 5 to 8 × 10⁵ cells/dish. They were co-transfected 3 days post-plating with p38 shRNA at 1 μg (for N2a cells) or 0.5 μg (for primary neurons) per dish via Lipofectamine 2000. Empty vectors or scrambled shRNA vectors alone were used at the same concentrations as vectors with shRNA against p38 MAPK. Puromycin at a final concentration of 0.5 μg/ml was added to the culture medium on the second day after transfection to select for purely transfected cells. Green fluorescence was observed to monitor transfection efficiency. Transfection efficiency for N2a cells ranged from 40% to 75%, and for primary neurons was from 20% to 40%. However, puromycin selection effectively yielded 100% of transfected cells. Cells were harvested after 48 h of silencing and lysed for either protein or for total RNA preparations.
ATP Content with Bioluminescence Assays
ATP content in primary neurons and N2a cells were tested in control and experimental groups that were treated with KCl for 0.5 h, 1 h, and 5 h. The protocol was as described previously (Wong-Riley et al., 2005), using components of the bioluminescent somatic cell assay kit (Sigma). Briefly, cultured cells were rinsed with cold phosphate-buffered saline, incubated in cold somatic cell ATP releasing reagent for 5 min on ice, and harvested by a cell scraper. They were mixed with the luciferase ATP assay mix and assayed with a luminometer (Berthold Detection Systems, Oak Ridge, TN). Values were expressed as nanomolar ATP content per mg of protein.
Statistics
All experiments were repeated at least three times. ANOVA and two-tailed Student’s t-test were used for group differences and for paired comparisons between treated and untreated samples. A P value of 0.05 or less was considered significant.
RESULTS
Changes in PGC-1α expression in response to KCl depolarization
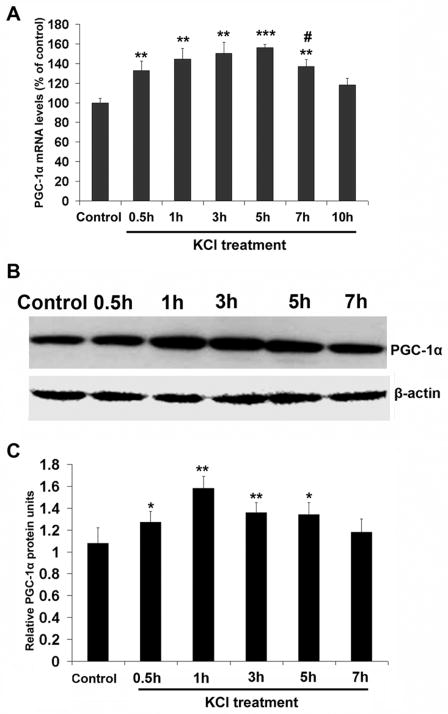
Quantitative real time PCR indicated that PGC-1α mRNA levels were significantly increased by depolarizing stimulation with KCl. The increases relative to controls were 33%, 44.7%, 50.3%, 56%, and 37% after 0.5, 1, 3, 5, and 7 hours of KCl, respectively (P < 0.01–0.001) (Fig. 1A). The value at 7 hours was significantly lower than that at 5 hours (P < 0.05), and it returned to control levels after 10 hours of KCl treatment (Fig. 1A).
Fig. 1.
A. Real-time quantitative PCR (RTqPCR) analysis of changes in PGC-1α mRNA levels in primary neurons in response to KCl depolarization. The message level was significantly increased by KCl after 0.5 h, peaked at 5 h, and decreased significantly after 7 h, returning to control levels after 10 h. B. Western blots of PGC-1α proteins after 0.5, 1, 3, 5, and 7 h of KCl depolarization. β-actin was the loading control. C. Quantitative analysis of changes in PGC-1α proteins as shown in B. The increase was evident at 0.5 h, peaked at 1 h, remained high at 3 h and 5 h, and returning to control levels after 7 h. * P < 0.05, ** P < 0.01, *** P < 0.001, as compared to controls. # P < 0.05, as compared to 5 h of KCl depolarization.
Western blots indicated that PGC-1α protein levels were increased significantly after 0.5 hour of depolarizing stimulation (P < 0.05) and reached a significant peak value after 1 hour (P < 0.01). They remained high at 3 and 5 hours (P < 0.01 and P < 0.05, respectively), and returned to control levels at 7 hours (Fig. 1B, C).
KCl depolarization increased cellular ATP content in neurons
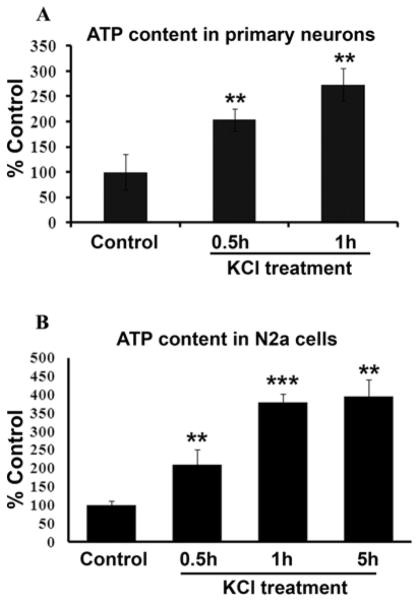
Cellular ATP content was significantly increased in both primary neurons and N2a cells after exposure to 20 mM KCl for 0.5 h, 1 h or 5 h (P < 0.01 – 0.001; Fig. 2A, B). For primary neurons, the increase was 103% and 173.7% after 0.5 and 1 h of KCl, respectively, as compared to controls (P < 0.01 for both) (Fig. 2A). For N2a cells, the increase was 109.82%, 278.79%, and 296.45% after 0.5 h, 1 h, and 5 h of KCl, respectively, as compared to controls (P < 0.01–0.001) (Fig. 2B).
Fig. 2.
Cellular ATP content in primary neurons (A) and N2a cells (B). KCl depolarization significantly increased cellular ATP levels after 0.5, 1, and 5 h of KCl stimulation. ** P < 0.01, *** P < 0.001, as compared to controls.
Changes in PGC-1α mRNA and protein levels after KCl withdrawal
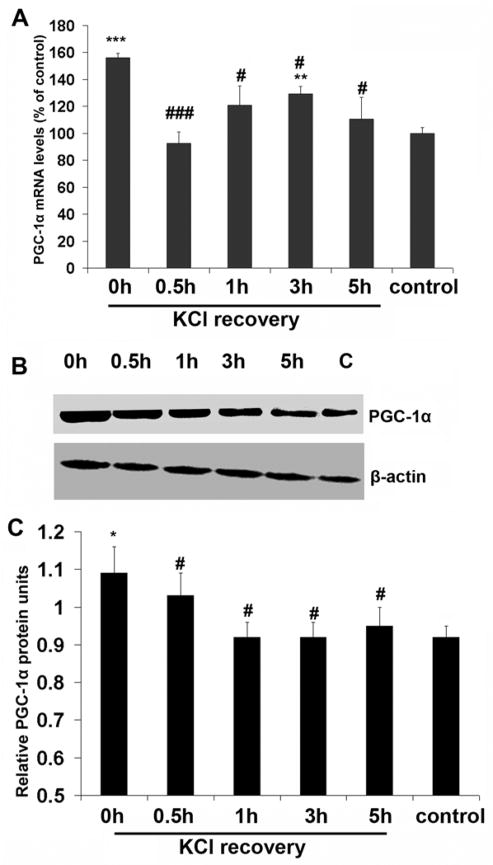
To determine if the withdrawal of KCl would lead to a down-regulation of PGC-1α expression, neurons were exposed to 20 mM KCl for 5 hours (at which time there was a significant increase in PGC-1α expression as compared to controls; P < 0.05) before switching to the normal medium for 0.5, 1, 3, and 5 hours. The removal of KCl resulted in a significant reduction in PGC-1α mRNA to control levels after only 0.5 hour (P < 0.001). However, there appeared to be a compensatory increase at 3 hours (P < 0.01 compared to controls) before returning to control levels again at 5 hours (Fig. 3A). PGC-1α protein levels were also significantly reduced after 0.5 hour of KCl withdrawal (P < 0.05), and returned to control levels after 1 hour, remaining low through 5 hours of recovery (Fig. 3B and C).
Fig. 3.
A. RTqPCR analysis of changes in PGC-1α mRNA levels in primary neurons in response to KCl withdrawal. At 0 h, the neurons had been subjected to 5 h of KCl stimulation, at which point the level of PGC-1α was significantly higher than that of controls (P < 0.001). At 0.5 h after KCl withdrawal, the message was drastically reduced. It remained low through 5 h of recovery. B. Western blots of PGC-1α proteins after KCl withdrawal. β-actin was the loading control. C. Quantitative analysis of changes in PGC-1α proteins as shown in B. * P < 0.05, ** P < 0.01, *** P < 0.001 as compared to controls. # P < 0.05, ### P < 0.001, as compared to the starting point (0 h), which is equivalent to 5 h of KCl depolarization.
Depolarization induced p38 MAPK activation
To determine the signaling pathway involved in the activation of PGC-1α in primary neurons, the levels of both p38 MAPK and phospho-p38 MAPK proteins were monitored by western blots. KCl depolarization significantly up-regulated both p38 MAPK and phospho-p38 MAPK protein as early as 15 minutes after treatment (P < 0.01) and remained high through 1 hour of stimulation (P < 0.001) (Fig. 4A–D).
Fig. 4.
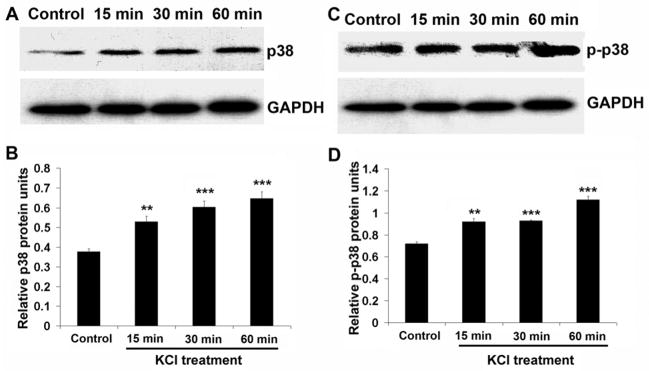
Western blots of p38 MAPK (A) and phospho-p38 MAPK (C) proteins in primary neurons after 15, 30, and 60 min of KCl depolarization. B and D. Quantitative analysis of relative changes in p38 MAPK and phospho-p38 MAPK proteins as shown in A and C. Both p38 MAPK and phospho-p38 MAPK levels were significantly increased after 15 min of KCl depolarization and remained high through 1 h of stimulation. ** P < 0.01, *** P < 0.001 as compared to controls.
SB203580 pretreatment prevented the up-regulation of both p38 MAPK and phosphorylated p38 MAPK by KCl depolarization in primary neurons and N2a cells
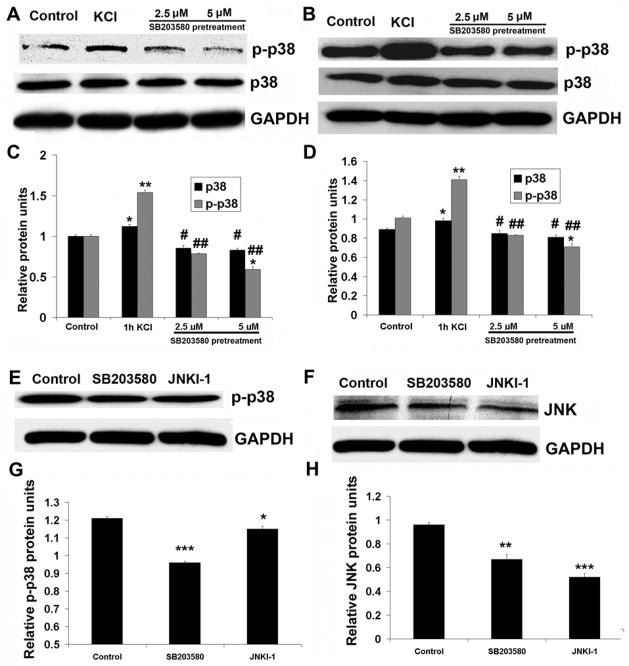
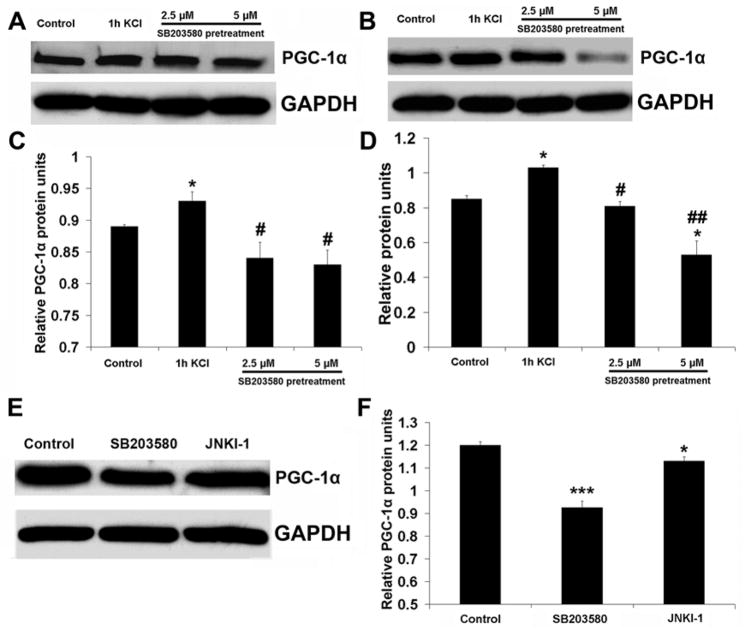
To determine if KCl directly activates p38 MAPK in neurons, both primary neurons and N2a cells were pretreated with 2.5 or 5 μM of SB203580, an inhibitor of p38 MAPK, before being stimulated for 1 hour with KCl. As shown in Fig. 3, 1 hour of KCl significantly increased p38 MAPK and phospho-p38 MAPK levels above those of controls (P < 0.001). However, 30 minutes of pretreatment with either concentration of SB203580 prevented such an up-regulation by KCl. Moreover, 5 μM of SB203580 brought the level of phospho-p38 MAPK even below that of controls (P < 0.05) (Fig. 5A–D). To test for the specificity of SB203580 in inhibiting p38 MAPK, an inhibitor of JNK (JNKI-1) was used for comparison. After 30 minutes of SB203580 pretreatment, phospho-p38 MAPK protein level was dramatically reduced as compared to non-treated controls (P < 0.001) (Fig. 5E, G). However, the JNK inhibitor JNKI-1 could only decrease phospho-p38 MAPK protein level slightly (P < 0.05) (Fig. 5E, G). Surprisingly, the total JNK protein level was also reduced by SB203580 (P < 0.01), but the reduction was much greater with 30 minutes of pretreatment with the JNK inhibitor JNKI-1 (P < 0.001) (Fig. 5F, H).
Fig. 5.
Western blots of p38 MAPK and phospho-p38 MAPK proteins in N2a cells (A) and primary neurons (B) after 30 min of pretreatment with 2.5 μM or 5 μM of SB203580 followed by 1 h of KCl depolarization. C and D. Quantitative analysis of relative changes in p38 MAPK and phospho-p38 MAPK proteins as shown in A and B. Whereas 1 h of KCl stimulation induced a significant rise in both p38 MAPK and phospho-p38 MAPK protein expression, pretreatment with either 2.5 μM or 5 μM of SB203580 prevented the up-regulation of both p38 MAPK and phospho-p38 MAPK induced by 1 h of KCl. Five μM of SB203580 significantly reduced phospho-38 MAPK to below control levels. E and F. Western blots of phospho-p38 MAPK and JNK proteins, respectively, in N2a cells after 30 min of 5 μM SB203580 or 1 μM of JNKI-1 treatment. G and H. Quantitative analysis of relative changes in phospho-p38 MAPK and JNK, respectively, as shown in E and F. Both phospho-p38 MAPK and JNK proteins were significantly decreased by either SB203580 or JNKI-1, but phospho-p38 MAPK was reduced more by SB203580, and total JNK was greatly reduced by JNKI-1. * P < 0.05, ** P < 0.01, *** P < 0.001 as compared to controls. # P < 0.05, ## P < 0.01 as compared to KCl treatment alone.
SB203580 pretreatment blocked PGC-1α up-regulation induced by KCl depolarization
To determine if the inhibition of p38 MAPK would prevent KCl-induced up-regulation of PGC-1α, primary neurons and N2a cells were pretreated with 2.5 or 5 μM of SB203580 for 30 minutes before stimulation for 1 hour with KCl. As shown in Fig. 6, both doses of SB203580 averted the increase of PGC-1α protein by KCl (Fig. 6A–D). In the absence of KCl, PGC-1α protein level was significantly reduced by SB203580 (P < 0.001), but only slightly reduced by JNKI-1 (P < 0.05) (Fig. 6E, F).
Fig. 6.
Western blots of PGC-1α proteins in N2a cells (A) and primary neurons (B) after 1 h of KCl or 30 min of SB203580 (2.5 μM and 5 μM) pretreatment prior to 1 h of KCl treatment. E. Western blots of PGC-1α proteins in N2a cells after 30 min of 5 μM SB203580 or 1 μM JNKI-1 treatment. C, D, F. Quantitative analysis of changes in PGC-1α proteins as shown in A, B, and E, respectively. PGC-1α protein levels were significantly increased by 1 h of KCl depolarization, but this increase was suppressed by 2.5 μM or 5 μM of SB203580 pretreatment. PGC-1α protein was slightly reduced by JNKI-1, but it was greatly reduced by SB203580. * P < 0.05, ***, P < 0.001 as compared to controls. # P < 0.05, ## P < 0.01 as compared to KCl treatment alone.
Nifedipine pretreatment blocked PGC-1α up-regulation induced by KCl depolarization
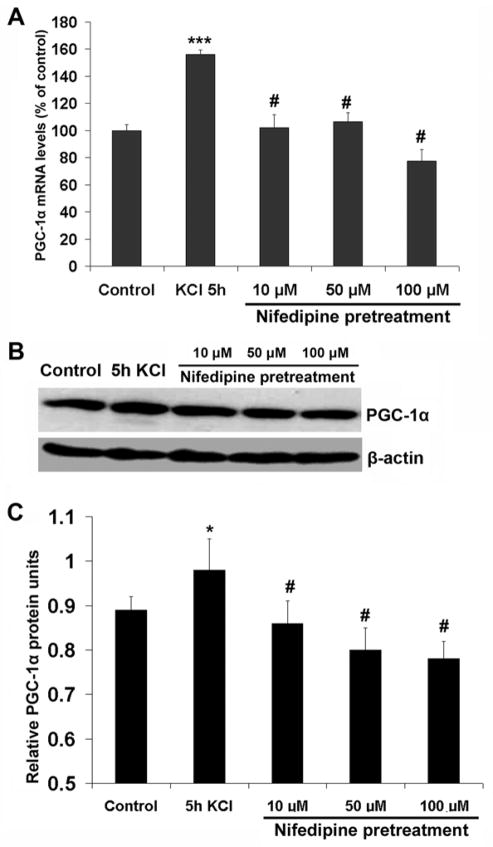
To determine the role of calcium channels in the activation of PGC-1α expression, primary neurons were pretreated with 10, 50, and 100 μM of nifedipine, a calcium channel blocker, for 30 minutes and then exposed to 20 mM KCl for 5 hours (at which time the PGC-1 mRNA level had reached its peak; see Fig. 1A). As shown in Fig. 7, nifedipine at all concentrations effectively suppressed the up-regulation of PGC-1α message (Fig. 7A) and proteins (Fig. 7B, C) induced by 5 hours of KCl stimulation.
Fig. 7.
A. RTqPCR analysis of PGC-1α mRNA levels in control, KCl-stimulated for 5 h, and nifedipine-pretreated for 30 min before 5 h of KCl depolarization in primary neurons. Note that PGC-1α mRNA levels were significantly increased by 5 h of KCl, but the increase was blocked by 10, 50, or 100 μM of nifedipine pretreatment. B. Western blots of PGC-1α proteins in neurons after 5 h of KCl depolarization and after pretreatment with various concentrations of nifedipine before 5 h of KCl. C. Quantitative analysis of changes in PGC-1α proteins as shown in B. Nifedipine at all concentrations tested blocked the up-regulation of PGC-1α proteins in the presence of KCl for 5 h. * P < 0.05, *** P < 0.001 as compared to controls. # P < 0.05 as compared to KCl treatment alone.
Effect of p38 MAPK knockdown on PGC-1α expression
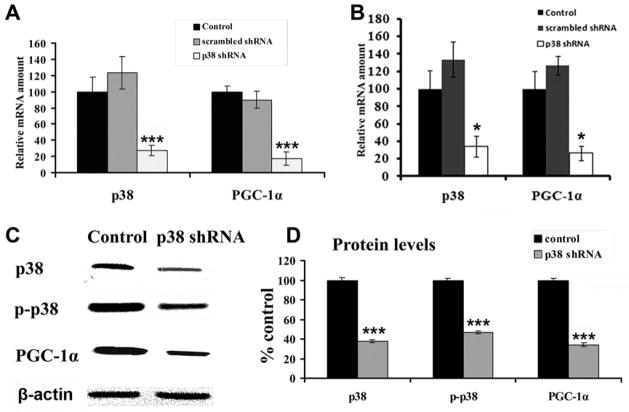
To determine if p38 MAPK knockdown directly reduces PGC-1α (a downstream target of MAPK pathway), p38 shRNA plasmids were used in N2a cells and primary neurons. shRNA against p38 MAPK significantly decreased the mRNA levels of p38 MAPK and PGC-1α, as monitored by real time quantitative PCR (P < 0.001) (Fig. 8A, B). The reduction was by 73% and 82 %, respectively, in N2a cells and by 76% and 84%, respectively, in primary neurons, as compared to empty vector controls. Scrambled shRNA yielded results comparable to those of empty vector controls (Fig. 8A, B). On the other hand, protein levels of total p38, phospho-p38 MAPK, as well as PGC-1α as revealed by western blots were significantly reduced by the silencing of p38 MAPK (P < 0.001, Fig. 8C, D).
Fig. 8.
RTqPCR analysis of p38 MAPK and PGC-1α mRNA levels in N2a cells (A) and primary neurons (B) in response to p38 MAPK silencing with RNA interference. Both p38 MAPK and PGC-1α mRNAs were significantly decreased by p38 shRNA. C. Western blots of total p38 MAPK, phosho-p38 MAPK, and PGC-1α proteins after p38 silencing in N2a cells. β-actin was the loading control. D. Quantitative analysis of total p38 MAPK, phospho-p38 MAPK, and PGC-1α proteins indicated that all three were significantly reduced after 48 h of p38 MAPK silencing. *** P < 0.001, as compared to controls.
DISCUSSION
The present study documents that p38 MAPK and calcium channels mediate the signaling mechanism in activating PGC-1α in neurons. The close correlation between message and protein levels indicates that the regulation of PGC-1α expression in neurons is primarily at the transcriptional levels.
As an inducible transcription co-activator, PGC-1α is involved in the regulation of oxidative metabolism associated with mitochondrial biogenesis (Baar et al., 2002; Knutti and Kralli 2001; Wright et al., 2007a; Scarpulla 2008). Previous studies on PGC-1α expression focused mainly on skeletal muscles and other non-neuronal tissues. Our current data suggest that KCl depolarization rapidly induces PGC-1α up-regulation in neurons at both the message and protein levels. The early response in PGC-1α mRNA and proteins strongly suggests that PGC-1α participates in sensing an increase in energy demand associated with a rise in neuronal activity. NRF-1, NRF-2, and cytochrome c oxidase (COX) are down-stream targets of PGC-1α in neurons (reviewed in Wong-Riley et al., 2008), and depolarization induces an up-regulation of these targets as well (Zhang and Wong-Riley 2000; Bai and Wong-Riley 2003; Liang et al., 2006; Yang et al., 2004; 2006). When depolarizing stimulation is withdrawn, PGC-1α expression returns to normal (present study). Thus, the expression of PGC-1α is activity-dependent in neurons.
In non-neural tissues, PGC-1α is reportedly activated either directly by p38 MAPK through phosphorylation (Knutti et al., 2001; Puigserver et al., 2001; Puigserver and Spiegelman 2003) or indirectly via its binding to cAMP-response element, which may be activated by p38 MAPK (Cao et al., 2004; Akimoto et al., 2005). The signaling pathway in neurons was entirely unknown. The current study documents for the first time that depolarizing stimulation initially induces p38 and phosphorylated p38 MAPK activation, followed by an up-regulation of PGC-1α expression in neurons. SB203580 selectively inhibits the catalytic activity of p38 MAPK by competitively binding to the ATP pocket and prevents the phosphorylation of downstream targets (Raingeaud et al., 1995; Young et al., 1997). Pretreatment with this p38 MAPK inhibitor prevents the up-regulation of PGC-1α by KCl stimulation. SB203580 most likely inhibits both p38 MAPK and its phosphorylated form, resulting in the blockade of PGC-1α activation. Although p38 MAPK was not completely inhibited by SB203580 at the current dosage (a dosage that kept the neurons viable), it was inhibited to a much greater extent than by an inhibitor of JNK (JNKI-1). Furthermore, a knockdown of p38 MAPK with shRNA significantly reduced the expression of PGC-1α. Thus, p38 MAPK is a vital upstream regulator in signaling the activation of PGC-1α in neurons.
Another mediator of PGC-1α activation in neurons is Ca2+ channels. Nifedipine pretreatment in the present study completely blocked the up-regulation of PGC-1α induced by KCl depolarization. This is consistent with depolarization-induced influx of Ca2+ via L-type voltage-sensitive Ca2+ channels (Hirota et al., 2003; Striessnig et al., 2006), a necessary step for increased neuronal activity before the up-regulation of PGC-1α transcripts and proteins in neurons. Our results are also consistent with previous reports that depolarization-induced calcium ions influx activates a number of transcription factors in neurons and other cell types (Rosen et al., 1994; Ghosh and Greenberg 1995; Ojuka et al., 2003; Li et al., 2004). This is a major mechanism that couples neuronal activity and intracellular biochemical processes to culminate in increased gene expression by the activation of an intricate signaling network (Rosen et al., 1994; Impey et al., 1998; Baldassa et al., 2003). In non-neuronal cells, cytosolic increase in Ca2+ triggers a calcium/calmodulin dependent protein kinase signaling pathway that may or may not involve p38 MAPK (Knutti et al., 2001; Puigserver et al., 2001; Irrcher et al., 2003; Akimoto et al., 2005; Wright, 2007; Wright et al., 2007b). Increases in Ca2+ concentration induce mitochondrial biogenesis (Ojuka et al., 2003). Thus, the activation of Ca2+ channels plays an important role in increasing PGC-1α expression either in parallel or through p38 MAPK phosphorylation in neurons. Furthermore, PGC-1α represents a molecular target that directly links cytokines to the stimulation of energy expenditure and cellular respiration through NRF-1, NRF-2, and/or other nuclear receptors (Puigserver et al., 2001; Arany, 2008). Thus, decreased ATP/ADP ratio induced by membrane depolarization may be an additional stimulator in inducing PGC-1α activation through the activation of p38 MAPK (Puigserver et al., 2001; Arany et al., 2005; Wright et al., 2007a and b).
Conclusion
The present study demonstrates that depolarization-induced up-regulation of PGC-1α in neurons is mediated by both p38 MAPK and calcium channel activation. Withdrawal of depolarization, calcium channel blocker, silencing of p38 MAPK, and p38 MAPK inhibitors all suppressed PGC-1α expression. These are all tightly regulated by neuronal activity in response to functional demands.
Acknowledgments
This work was supported by NIH R01 EY018441.
References
- Akimoto T, Pohnert SC, Li P, Zhang M, Gumbs C, Rosenberg PB, Williams RS, Yan Z. Exercise stimulates Pgc-1alpha transcription in skeletal muscle through activation of the p38 MAPK pathway. J Biol Chem. 2005;280:19587–19593. doi: 10.1074/jbc.M408862200. [DOI] [PubMed] [Google Scholar]
- Akimoto T, Li P, Yan Z. Functional interaction of regulatory factors with the Pgc-1alpha promoter in response to exercise by in vivo imaging. Am J Physiol Cell Physiol. 2008;295:C288–292. doi: 10.1152/ajpcell.00104.2008. [DOI] [PMC free article] [PubMed] [Google Scholar]
- Arany Z. PGC-1 coactivators and skeletal muscle adaptations in health and disease. Curr Opin Genet Dev. 2008;18:1–9. doi: 10.1016/j.gde.2008.07.018. [DOI] [PMC free article] [PubMed] [Google Scholar]
- Arany Z, He H, Lin J, Hoyer K, Handschin C, Toka O, Ahmad F, Matsui T, Chin S, Wu PH, Rybkin II, Shelton JM, Manieri M, Cinti S, Schoen FJ, Bassel-Duby R, Rosenzweig A, Ingwall JS, Spiegelman BM. Transcriptional coactivator PGC-1 alpha controls the energy state and contractile function of cardiac muscle. Cell Metab. 2005;1:259–271. doi: 10.1016/j.cmet.2005.03.002. [DOI] [PubMed] [Google Scholar]
- Baar K, Wende AR, Jones TE, Marison M, Nolte LA, Chen M, Kelly DP, Holloszy JO. Adaptations of skeletal muscle to exercise: rapid increase in the transcriptional coactivator PGC-1. FASEB J. 2002;16:1879–1886. doi: 10.1096/fj.02-0367com. [DOI] [PubMed] [Google Scholar]
- Bai X, Wong-Riley MT. Neuronal activity regulates protein and gene expressions of GluR2 in postnatal rat visual cortical neurons in culture. J Neurocytol. 2003;32:71–78. doi: 10.1023/a:1027380315902. [DOI] [PubMed] [Google Scholar]
- Baldassa S, Zippel R, Sturani E. Depolarization-induced signaling to Ras, Rap1 and MAPKs in cortical neurons. Brain Res Mol Brain Res. 2003;119:111–122. doi: 10.1016/j.molbrainres.2003.08.020. [DOI] [PubMed] [Google Scholar]
- Barger PM, Browning AC, Garner AN, Kelly D. p38 mitogen-activated protein kinase activates peroxisome proliferator-activated receptor alpha: a potential role in the cardiac metabolic stress response. J Biol Chem. 2001;276:44495–44501. doi: 10.1074/jbc.M105945200. [DOI] [PubMed] [Google Scholar]
- Cao W, Daniel KW, Robidoux J, Puigserver P, Medvedev AV, Bai X, Floering LM, Spiegelman BM, Collins S. p38 mitogen-activated protein kinase is the central regulator of cyclic AMP-dependent transcription of the brown fat uncoupling protein 1 gene. Mol Cell Biol. 2004;24:3057–3067. doi: 10.1128/MCB.24.7.3057-3067.2004. [DOI] [PMC free article] [PubMed] [Google Scholar]
- Enslen H, Tokumitsu H, Stork PJ, Davis RJ, Soderling TR. Regulation of mitogen-activated protein kinases by a calcium/calmodulin-dependent protein kinase cascade. Proc Natl Acad Sci U S A. 1996;93:10803–10808. doi: 10.1073/pnas.93.20.10803. [DOI] [PMC free article] [PubMed] [Google Scholar]
- Ghosh A, Greenberg ME. Calcium signaling in neurons: molecular mechanisms and cellular consequences. Science. 1995;268:239–247. doi: 10.1126/science.7716515. [DOI] [PubMed] [Google Scholar]
- Gilde AJ, Van Bilsen M. Acta Physiol. Scand. 2003;178:425–434. doi: 10.1046/j.1365-201X.2003.01161.x. [DOI] [PubMed] [Google Scholar]
- Hirota K, Hashiba E, Yoshioka H, Kabara S, Matsuki A. Effects of three different L-type Ca2+ entry blockers on airway constriction induced by muscarinic receptor stimulation. Br J Anaesth. 2003;90:671–675. doi: 10.1093/bja/aeg118. [DOI] [PubMed] [Google Scholar]
- Impey S, Obrietan K, Wong ST, Poser S, Yano S, Wayman G, Deloulme JC, Chan G, Storm DR. Cross talk between ERK and PKA is required for Ca2+ stimulation of CREB-dependent transcription and ERK nuclear translocation. Neuron. 1998;21:869–883. doi: 10.1016/s0896-6273(00)80602-9. [DOI] [PubMed] [Google Scholar]
- Irrcher I, Adhihetty PJ, Sheehan T, Joseph AM, Hood DA. PPARgamma coactivator-1alpha expression during thyroid hormone- and contractile activity-induced mitochondrial adaptations. Am J Physiol Cell Physiol. 2003;284:1669–1677. doi: 10.1152/ajpcell.00409.2002. [DOI] [PubMed] [Google Scholar]
- Kelly DP, Scarpulla RC. Transcriptional regulatory circuits controlling mitochondrial biogenesis and function. Genes Dev. 2004;18:357–368. doi: 10.1101/gad.1177604. [DOI] [PubMed] [Google Scholar]
- Knutti D, Kralli A. PGC-1, a versatile coactivator. Trends Endocrinol Metab. 2001;12:360–365. doi: 10.1016/s1043-2760(01)00457-x. [DOI] [PubMed] [Google Scholar]
- Knutti D, Kressler D, Kralli A. Regulation of the transcriptional coactivator PGC-1 via MAPK-sensitive interaction with a repressor. Proc Natl Acad Sci USA. 2001;98:9713–9718. doi: 10.1073/pnas.171184698. [DOI] [PMC free article] [PubMed] [Google Scholar]
- Li H, Gu X, Dawson VL, Dawson TM. Identification of calcium- and nitric oxide-regulated genes by differential analysis of library expression (DAzLE) Proc Natl Acad Sci USA. 2004;101:647–652. doi: 10.1073/pnas.0305145101. [DOI] [PMC free article] [PubMed] [Google Scholar]
- Liang HL, Wong-Riley MTT. Activity-dependent regulation of nuclear respiratory factor-1, nuclear respiratory factor-2, and peroxisome proliferator-activated receptor gamma coactivator-1 in neurons. Neuroreport. 2006;17:401–405. doi: 10.1097/01.wnr.0000204980.98876.11. [DOI] [PubMed] [Google Scholar]
- Liang HL, Ongwijitwat S, Wong-Riley MTT. Bigenomic functional regulation of all 13 cytochrome c oxidase subunit transcripts in rat neurons in vitro and in vivo. Neurosci. 2006;140:177–190. doi: 10.1016/j.neuroscience.2006.01.056. [DOI] [PubMed] [Google Scholar]
- Lin J, Wu H, Tarr PT, Zhang CY, Wu Z, Boss O, Michael LF, Puigserver P, Isotani E, Olson EN, Lowell BB, Bassel-Duby R, Spiegelman BM. Transcriptional co-activator PGC-1 alpha drives the formation of slow-twitch muscle fibres. Nature. 2002;418:797–801. doi: 10.1038/nature00904. [DOI] [PubMed] [Google Scholar]
- Lin J, Handschin C, Spiegelman BM. Metabolic control through the PGC-1 family of transcription coactivators. Cell Metab. 2005;1:361–70. doi: 10.1016/j.cmet.2005.05.004. [DOI] [PubMed] [Google Scholar]
- Livak KJ, Schmittgen TD. Analysis of relative gene expression data using real-time quantitative PCR and the 2(−Delta Delta C(T)) Methods. 2001;25:402–408. doi: 10.1006/meth.2001.1262. [DOI] [PubMed] [Google Scholar]
- Meng H, Liang HL, Wong-Riley M. Quantitative immuno-electron microscopic analysis of depolarization-induced expression of PGC-1alpha in cultured rat visual cortical neurons. Brain Res. 2007;1175:10–16. doi: 10.1016/j.brainres.2007.07.063. [DOI] [PubMed] [Google Scholar]
- Mootha VK, Handschin C, Arlow D, Xie X, St Pierre J, Sihag S, Yang W, Altshuler D, Puigserver P, Patterson N, Willy PJ, Schulman IG, Heyman RA, Lander ES, Spiegelman BM. Erralpha and Gabpa/b specify PGC-1alpha-dependent oxidative phosphorylation gene expression that is altered in diabetic muscle. Proc Natl Acad Sci USA. 2004;101:6570–6575. doi: 10.1073/pnas.0401401101. [DOI] [PMC free article] [PubMed] [Google Scholar]
- Norrbom J, Sundberg CJ, Ameln H, Kraus WE, Jansson E, Gustafsson T. PGC-1alpha mRNA expression is influenced by metabolic perturbation in exercising human skeletal muscle. J Appl Physiol. 2004;96:189–194. doi: 10.1152/japplphysiol.00765.2003. [DOI] [PubMed] [Google Scholar]
- Ojuka EO, Jones TE, Han DH, Chen M, Holloszy JO. Raising Ca2+ in L6 myotubes mimics effects of exercise on mitochondrial biogenesis in muscle. FASEB J. 2003;17:675–681. doi: 10.1096/fj.02-0951com. [DOI] [PubMed] [Google Scholar]
- Puigserver P, Spiegelman BM. Peroxisome proliferator-activated receptor-gamma coactivator 1 alpha (PGC-1 alpha): transcriptional coactivator and metabolic regulator. Endocr Rev. 2003;24:78–90. doi: 10.1210/er.2002-0012. [DOI] [PubMed] [Google Scholar]
- Puigserver P, Wu Z, Park CW, Graves R, Wright M, Spiegelman BM. A cold-inducible coactivator of nuclear receptors linked to adaptive thermogenesis. Cell. 1998;92:829–839. doi: 10.1016/s0092-8674(00)81410-5. [DOI] [PubMed] [Google Scholar]
- Puigserver P, Rhee J, Lin J, Wu Z, Yoon JC, Zhang CY, Krauss S, Mootha VK, Lowell BB, Spiegelman BM. Cytokine stimulation of energy expenditure through p38 MAP kinase activation of PPARgamma coactivator-1. Mol Cell. 2001;8:971–982. doi: 10.1016/s1097-2765(01)00390-2. [DOI] [PubMed] [Google Scholar]
- Raingeaud J, Gupta S, Rogers JS, Dickens M, Han J, Ulevitch RJ, Davis RJ. Pro-inflammatory cytokines and environmental stress cause p38 mitogen-activated protein kinase activation by dual phosphorylation on tyrosine and threonine. J Biol Chem. 1995;270:7420–7426. doi: 10.1074/jbc.270.13.7420. [DOI] [PubMed] [Google Scholar]
- Rhee J, Inoue Y, Yoon JC, Puigserver P, Fan M, Gonzalez FJ, Spiegelman BM. Regulation of hepatic fasting response by PPARgamma coactivator-1alpha (PGC-1): requirement for hepatocyte nuclear factor 4alpha in gluconeogenesis. Proc Natl Acad Sci USA. 2003;100:4012–4017. doi: 10.1073/pnas.0730870100. [DOI] [PMC free article] [PubMed] [Google Scholar]
- Rosen LB, Ginty DD, Weber MJ, Greenberg ME. Membrane depolarization and calcium influx stimulate MEK and MAP kinase via activation of Ras. Neuron. 1994;12:1207–1221. doi: 10.1016/0896-6273(94)90438-3. [DOI] [PubMed] [Google Scholar]
- Scarpulla RC. Nuclear activators and coactivators in mammalian mitochondrial biogenesis. Biochim Biophys Acta. 2002;1576:1–14. doi: 10.1016/s0167-4781(02)00343-3. [DOI] [PubMed] [Google Scholar]
- Scarpulla RC. Transcriptional paradigms in mammalian mitochondrial biogenesis and function. Physiol Rev. 2008;88:611–638. doi: 10.1152/physrev.00025.2007. [DOI] [PubMed] [Google Scholar]
- Schreiber SN, Emter R, Hock MB, Knutti D, Cardenas J, Podvinec M, Oakeley EJ, Kralli A. The estrogen-related receptor alpha (ERRalpha) functions in PPARgamma coactivator 1alpha (PGC-1alpha)-induced mitochondrial biogenesis. Proc Natl Acad Sci USA. 2004;101:6472–6477. doi: 10.1073/pnas.0308686101. [DOI] [PMC free article] [PubMed] [Google Scholar]
- Striessnig J, Koschak A, Sinnegger-Brauns MJ, Hetzenauer A, Nguyen NK, Busquet P, Pelster G, Singewald N. Role of voltage-gated L-type Ca2+ channel isoforms for brain function. Biochem Soc Trans. 2006;34:903–909. doi: 10.1042/BST0340903. [DOI] [PubMed] [Google Scholar]
- Wong-Riley MTT, Liang HL, Eells JT, Chance B, Henry MM, Buchmann E, Kane M, Whelan HT. Photobiomodulation directly benefits primary neurons functionally inactivated by toxins: Role of cytochrome c oxidase. J Biol Chem. 2005;280:4761–4771. doi: 10.1074/jbc.M409650200. [DOI] [PubMed] [Google Scholar]
- Wong-Riley MTT, Liang HL, Ongwijitwat S. Activity-dependent bigenomic transcriptional regulation of cytochrome c oxidase in neurons. In: Dudek SM, editor. Understanding Transcriptional Regulation by Neuronal Activity: To the Nucleus and Back. New York: Springer Science; 2008. pp. 209–228. [Google Scholar]
- Wright DC. Mechanisms of calcium-induced mitochondrial biogenesis and GLUT4 synthesis. Appl Physiol Nutr Metab. 2007;32:840–845. doi: 10.1139/H07-062. [DOI] [PubMed] [Google Scholar]
- Wright DC, Han DH, Garcia-Roves PM, Geiger PC, Jones TE, Holloszy JO. Exercise-induced mitochondrial biogenesis begins before the increase in muscle PGC-1alpha expression. J Biol Chem. 2007a;282:194–199. doi: 10.1074/jbc.M606116200. [DOI] [PubMed] [Google Scholar]
- Wright DC, Geiger PC, Han DH, Jones TE, Holloszy JO. Calcium induces increases in peroxisome proliferator-activated receptor gamma coactivator-1alpha and mitochondrial biogenesis by a pathway leading to p38 mitogen-activated protein kinase activation. J Biol Chem. 2007b;282:18793–19799. doi: 10.1074/jbc.M611252200. [DOI] [PubMed] [Google Scholar]
- Yang SJ, Liang HL, Ning G, Wong-Riley MT. Ultrastructural study of depolarization-induced translocation of NRF-2 transcription factor in cultured rat visual cortical neurons. Eur J Neurosci. 2004;19:1153–1162. doi: 10.1111/j.1460-9568.2004.03250.x. [DOI] [PubMed] [Google Scholar]
- Yang SJ, Liang HL, Wong-Riley MT. Activity-dependent transcriptional regulation of nuclear respiratory factor-1 in cultured rat visual cortical neurons. Neuroscience. 2006;141:1181–1192. doi: 10.1016/j.neuroscience.2006.04.063. [DOI] [PubMed] [Google Scholar]
- Young PR, McLaughlin MM, Kumar S, Kassis S, Doyle ML, McNulty D, Gallagher TF, Fisher S, McDonnell PC, Carr SA, Huddleston MJ, Seibel G, Porter TG, Livi GP, Adams JL, Lee JC. Pyridinyl imidazole inhibitors of p38 mitogen-activated protein kinase bind in the ATP site. J Biol Chem. 1997;272:12116–12121. doi: 10.1074/jbc.272.18.12116. [DOI] [PubMed] [Google Scholar]
- Zhang C, Wong-Riley MT. Depolarizing stimulation upregulates GA-binding protein in neurons: a transcription factor involved in the bigenomic expression of cytochrome oxidase subunits. Eur J Neurosci. 2000;12:1013–1023. doi: 10.1046/j.1460-9568.2000.00997.x. [DOI] [PubMed] [Google Scholar]


