

Abstract
Disease susceptibility can arise as a consequence of adaptation to infectious disease. Recent findings have suggested that higher rates of chronic kidney disease (CKD) in individuals with recent African ancestry might be attributed to two risk alleles (G1 and G2) at the serum-resistance-associated (SRA)-interacting-domain-encoding region of APOL1. These two alleles appear to have arisen adaptively, possibly as a result of their protective effects against human African trypanosomiasis (HAT), or African sleeping sickness. In order to explore the distribution of potential functional variation at APOL1, we studied nucleotide variation in 187 individuals across ten geographically and genetically diverse African ethnic groups with exposure to two Trypanosoma brucei subspecies that cause HAT. We observed unusually high levels of nonsynonymous polymorphism in the regions encoding the functional domains that are required for lysing parasites. Whereas allele frequencies of G2 were similar across all populations (3%–8%), the G1 allele was only common in the Yoruba (39%). Additionally, we identified a haplotype (termed G3) that contains a nonsynonymous change at the membrane-addressing-domain-encoding region of APOL1 and is present in all populations except for the Yoruba. Analyses of long-range patterns of linkage disequilibrium indicate evidence of recent selection acting on the G3 haplotype in Fulani from Cameroon. Our results indicate that the G1 and G2 variants in APOL1 are geographically restricted and that there might be other functional variants that could play a role in HAT resistance and CKD risk in African populations.
Introduction
Infectious disease is a major force of natural selection in humans, often resulting in a high frequency of genetic variants that are protective against infection but that might also cause disease.1 J.B.S. Haldane phrased evolutionary adaptation of this kind as “temporarily successful acquisitions of immunity” owing to its cost to carriers’ health.2 A classic example is the high prevalence of hemoglobinopathies in regions where malaria is or was endemic as a result of their protective effects against infection.3–7 For this reason, characterization of signatures of natural selection can be informative for identifying functionally important genetic variation that might play a role in disease susceptibility.8,9
More recently, genetic variation in APOL1 (MIM 603743) has been demonstrated to be associated with resistance to human African trypanosomiasis (HAT) and with susceptibility to chronic kidney disease (CKD) in African Americans. CKD is a progressive loss of renal function over time and affects over 14% of adults in the United States. Severe forms of CKD are typically characterized on the basis of clinical phenotypes such as diabetic nephropathy, hypertensive nephrosclerosis, lupus nephritis, focal segmental glomerulosclerosis (FSGS), and end-stage renal disease (ESRD). Many of these symptoms occur at disproportionally high rates among individuals of African descent. For example, African Americans suffer from ESRD rates that are four times higher than those in European Americans.10–18 Initial studies indicated that ESRD and FSGS are strongly associated with MYH9 (nonmuscle myosin heavy chain 9 [MIM 160775]) in chromosomal region 22–q12 in African Americans. MYH9 was considered a strong candidate for disease risk because of its expression in podocyte cells of the Bowman’s capsule, which wraps around the capillaries of the renal glomerulus,19–22 although a causative variant was not identified.23 Using sequence data from the 1000 Genomes Project to identify MYH9-proximal variants that differ in frequency between the Nigerian Yoruba and European populations, Genovese et al.24 and Tzur et al.25 identified two risk alleles (termed G1 and G2) at APOL1, located 14 kb from MYH9, and these alleles accounted for most of the statistical association previously attributed to the MYH9 variants.
Apolipoprotein L1, encoded by APOL1, is a serum apolipoprotein bound to high-density-lipoprotein (HDL) particles. APOL1 belongs to the apolipoprotein L gene family, which is composed of six genes spanning over 619 kb on human chromosome 22. In human blood, APOL1 is one of the major components of trypanosome lytic factor (TLF), which lyses pathogenic Trypanosoma brucei, a parasitic protozoa transmitted by the tsetse fly. HAT occurs in a large geographic region including 36 sub-Saharan countries and is caused by two different T. b. subspecies, T. b. rhodesiense and T. b. gambiense, which cause the eastern and western forms of HAT, respectively.26 On the basis of the lytic properties of APOL1 and the observation that both risk alleles exist on unusually long haplotypes, a pattern consistent with recent positive selection, Genovese et al.24 speculated that the risk alleles associated with CKD might have increased in allele frequency rapidly because of their potential protective effects against HAT.
Prior studies have focused on analyzing genetic signatures of selection at APOL1 in the Yoruba population from Nigeria in western Africa.24 However, in vitro assays of trypanolytic activity have shown that the two renal risk alleles are resistant only to T. b. rhodesiense, which causes the eastern form of HAT. No variants have been found to confer resistance to T. b gambiense, which is currently endemic in western Africa.24 Because African populations are genetically highly substructured, it is possible that patterns of genetic variation in APOL1 might differ in other populations.27 In this study, we sequenced a 1.4 kb APOL1 region that encompasses the last exon, which carries the G1 and G2 alleles, in 187 individuals from ten geographically and ethnically diverse African populations (Figure 1). We observed unusually high levels of nonsynonymous genetic variation with differing allele frequencies and linkage-disequilibrium (LD) patterns across sub-Saharan Africa. We analyzed patterns of nucleotide variation and detected signatures of adaptive evolution on the basis of long-range haplotype homozygosity. We further identified several variants that appear to be targets of selection, suggesting that these variants are candidates for HAT resistance, as well as potential candidates contributing to CKD susceptibility in Africans.
Figure 1.
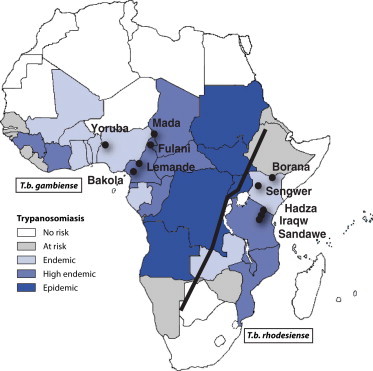
Geographic Distribution of the Endemicity of HAT and Sampled Populations in Sub-Saharan Africa
The map of the endemicity of HAT was adapted from the World Health Organization Report on Global Surveillance of Epidemic-Prone Infectious Diseases.28 The endemicity distribution is marked by a black line separating HAT into the West African form, which is caused by Trypanosoma brucei gambiense, and the East African form, which is caused by T. b. rhodesiense.
Material and Methods
Ethnic Groups and DNA Samples
Human DNA samples were collected from 187 unrelated individuals from ten different African ethnic groups, including the Yoruba from Nigeria; the Bakola pygmy, Fulani, Lemande, and Mada from Cameroon; the Borana and Sengwer from Kenya; and the Hadza, Datog, Iraqw, and Sandawe from Tanzania. Approval of the institutional review boards for our research project was received from both the University of Maryland and the University of Pennsylvania. Prior to sample collection, research-ethics permits and approval were also obtained from the Commission for Science and Technology and the National Institute for Medical Research in Dar es Salaam, Tanzania; the Kenya Medical Research Institute in Nairobi, Kenya; the Nigerian Institute for Research and Pharmacological Development in Abuja, Nigeria; and the Ministry of Health and National Committee of Ethics in Cameroon. Written informed consent was received from all participants. Subject identity was anonymized.
PCR and DNA Resequencing
We resequenced the last exon (883 bp) of APOL1 and its adjacent intron for a total of 1.4 kb of sequence (Figure 2). This genetic region was chosen because it encodes the pore-forming, membrane-addressing, and serum-resistance-associated (SRA)-interacting domains, which are involved in APOL1-associated trypanolysis, and because variants in this region have been found to be associated with CKD risk.24,25,29 The targeted region was amplified with the use of several gene-specific primer pairs. PCR experiments were performed under the condition of 200 μM of dNTP (Promega), 0.2 μM of each primer, and 1.5–2.5 mM of MgSO4 with the use of Platinum Taq DNA Polymerase High Fidelity (Invitrogen). PCR cycles consisted of one cycle of preincubation (94°C for 1 min), 35 cycles of amplification (95°C for 30 s, 60°C–64°C for 30 s, and 72°C for 45 s), and one cycle of extension (72°C for 7 min). The MgSO4 concentration and PCR annealing temperature varied among different primer sets (see Table S1, available online, for information on primer pairs and MgSO4 concentrations). Alkaline phosphatase and exonuclease I (United States Biochemicals) were applied for PCR purification, and sequencing reactions were subsequently performed with an automated ABI 3730xl High-Throughput DNA Sequencer (Applied Biosystems). The sequence contigs were assembled and heterozygous sites were identified with the Sequencher 5.0 application (Gene Codes Corporation). Sequences obtained for this study were submitted to the GenBank sequence database with the accession numbers KC339295–KC339481.
Figure 2.
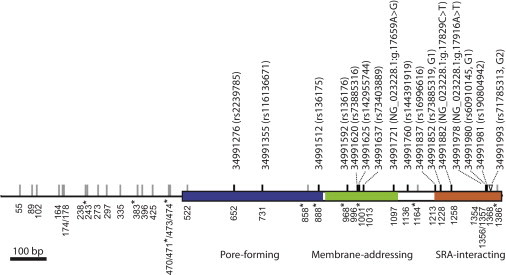
Spatial Distribution of Genetic Variants at the Functional-Domain-Encoding Region of APOL1
The APOL1 genetic region, which codes for the pore-forming (blue), membrane-addressing (green), and SRA-interacting (orange) domains, and the adjacent intron are marked by genetic variants identified in this study. Each synonymous and intronic SNP is labeled by a gray line. Each nonsynonymous SNP is labeled by a black line with its genomic position (based on NCBI Genome browser build 36.1) and reference SNP ID if it is described in dbSNP. For those nonsynonymous SNPs that are not present in dbSNP (build 137), the changes of nucleotide state are given according to RefSeq NG_023228.1. The indel variant (i.e., G2 allele) is labeled by an inverted triangle. The nucleotide site of each variant at our sequence alignment is labeled at the bottom of the gene. The nucleotide sites that define the G3 haplotype are labeled with asterisks.
Estimating Genetic Diversity, Frequency Spectra of SNPs, and LD
All DNA sequences from 187 individuals were aligned with the CLUSTAL W algorithm implemented in the MegAlign application (DNASTAR software package) and examined by eye. The haplotype sequences were inferred with PHASE version 2.1.30,31 Watterson’s estimate of nucleotide heterozygosity (θw) was computed for estimating nucleotide diversity for a given population.32 We also computed Tajima’s D statistic to characterize allele-frequency spectra of SNPs and to test for deviation from a neutral equilibrium model by contrasting the difference between π (average pairwise nucleotide differences) and θw (). The significance levels were determined by a null distribution generated by a coalescent-based simulation assuming constant population sizes over generations and no recombination for a given observed number of segregating sites (S) and number of sampled chromosomes. For a given variant present in more than half of the ten populations, FST was calculated for quantifying the levels of difference in allele frequency across populations.33 For any given pair of SNPs, LD was estimated by the squared correlation coefficient, , where pij is the frequency of one of the four possible gametic types for a given pair of SNPs i and j and where pi and pj are the allele frequencies of SNPs i and j, respectively.34 The two-tailed Fisher’s exact test was applied for computing the probability of the observed numbers of four gametic types under the null hypothesis of linkage equilibrium for determining the statistical significance of association between two given polymorphic sites. The LD maps were plotted with the LD heatmap package written in R.35 A list of all phased haplotypes and their frequencies is provided in Table S2.
SNP Genotyping and Detecting Signatures of Recent Darwinian Selection
Genovese et al.24 have shown that the G1 and G2 alleles at APOL1 are candidates for recent Darwinian selection in the Yoruba population. In this study, we were also interested in the detection of recent adaptive selection for other APOL1 variants identified in these ten populations. Under the scenario of recent positive selection, a selection-favored variant is expected to increase its frequency in a population much faster than a neutral mutation in a considerably short period of evolutionary time. Therefore, recombination does not occur sufficiently to break down the haplotype that carries the selected variant and subsequently results in an unusual long-range LD haplotype in comparison with other haplotypes that contain only neutral variants. In order to characterize long-range LD patterns of haplotypes, we analyzed a subset of our sampled individuals for whom we had whole-genome SNP genotyping data. Our analyzed data were a subset of the whole-genome SNP genotyping data generated with the Illumina Human 1M-Duo DNA Analysis BeadChip (data not shown). We combined all the APOL1 variants identified from our resequencing efforts in this study with the SNP genotyping data that include 1,083,730 SNPs for the entire genome (excluding sex chromosomes) after quality control for SNP calls. Overall, 145 out of 187 individuals were included in this data set for the long-range-haplotype LD analyses.
We first characterized the long-range LD patterns for the ancestral and derived alleles by calculating the extended haplotype homozygosity (EHH) for a given polymorphic site.36 We then computed the integrated haplotype score (iHS), which summarizes the differences in the observed decay of EHH between the ancestral and derived alleles for each polymorphic site, and compared the iHS for a given SNP of interest to the empirical iHS distribution estimated across the genome.36,37 We first performed fastPHASE (version 1.4) to phase the Illumina 1M SNPs for each chromosome separately after adding the SNPs identified from our resequencing effort into the SNP data for chromosome 22.38 The combined SNP data set resulted in a high density of SNPs at APOL1’s last exon, which was our genetic region of interest. We then measured decay of LD by calculating the EHH for a given core SNP and the surrounding SNPs in the order of increasing distances: starting with the core SNP (EHH = 1) and continuing with the next closest neighboring SNPs to the core SNP at both proximal and distal sides. EHH statistics were calculated for all possible surrounding SNPs until the value fell under 0.05. The EHH is calculated as , where t is the core haplotype tested, c is the number of samples of a particular core haplotype, e is the number of samples for a particular extended haplotype, and s is the number of unique extended haplotypes according to Sabeti et al.39 The EHH was calculated for all possible SNPs that had at least two minor allele copies in the sample (minor allele frequency > 0.05) for a given population. The estimated EHH values of the core and neighboring SNPs were plotted against their genetic distances for the derived and ancestral alleles for a given core site. An allele was determined to be ancestral or derived with the use of gorilla and orangutan as outgroups (APOL1 is absent from the chimpanzee genome40). In a few cases, the rhesus macaque sequence was used as an outgroup if the data were missing from the two great apes.
The genetic map used for calculating the iHS was taken from Jarvis et al.41 This fine-scale genetic map was generated from a SNP data set including a total of 100 unrelated individuals from the Yoruba in Ibadan, Nigeria, and the Luhya in Webuye, Kenya, in HapMap3 Release 2 (January 2009). A composite-likelihood method was performed for estimating the population recombination parameters (4Ner, where Ne is effective population size and r is recombination rate per generation) between consecutive markers with the use of LDhat as detailed in Jarvis et al.41 The area under the EHH curves for derived and ancestral alleles can be integrated separately, and the test statistic, iHS (unstandardized), is calculated as ln(iHHA / iHHD), where iHHA and iHHD are integrated EHH values for ancestral and derived alleles, respectively. The iHS test statistic reflects the differences in the long-range LD patterns between the haplotypes carrying the ancestral and derived alleles. The iHS estimate can be normalized on the basis of an empirical distribution obtained from all possible SNPs whose derived allele frequency matches the frequency at the core SNP of interest, as described by Voight et al.37
In addition to EHH and iHS analyses, the r2 estimates of LD were also plotted against their physical distances between all possible pairs of polymorphic sites (with minor allele frequency ≥ 3% according to Verrelli et al.42) in each population for illustrating the decay of LD in a 30 kb region surrounding our resequenced region. A fitted regression line was determined on the basis of nonlinear least-squares estimates of the parameters of a nonlinear model, , where ρ is 4Ner, according to Hudson.43
Results
High Levels of Nonsynonymous Variation in APOL1 across Diverse Ethnic Groups
We resequenced a 1.4 kb region that includes APOL1’s last exon (883 bp), which codes for three APOL1 functional domains—the pore-forming, membrane-addressing, and SRA-interacting domains—that are required for lysing trypanosomes, and a portion (518 bp) of the adjacent intron across 187 ethnically diverse African individuals originating from ten populations (see Figures 1 and 2). Overall, we identified 38 variants across the ten populations. These variants included 15 nonsynonymous SNPs and a 6 bp indel (i.e., the G2 variant [rs71785313]), which removed two amino acids (i.e., p.Asn388_Tyr389del based on RefSeq accession number NM_003661.3). Of the 15 nonsynonymous SNPs and one indel variant, eight were common variants observed in at least six out of the ten populations, and the FST estimates were highest among Africans (0.21) at sites 1,228 and 1,356, which are in complete LD (i.e., the G1 allele; see Figure 2 and Table 1). Three of the 16 variants occurred at the pore-forming domain, five occurred at the membrane-addressing domain, and six, including the G1 and G2 variants, occurred at the SRA-interacting domain. Three nonsynonymous SNPs at sites 1,097, 1,258, and 1,354 were not present in dbSNP (build 137; see Figure 2). Although this exon has been previously sequenced in the Yoruba population,24 only 5 out of the 16 nonsynonymous variants identified in the current study were observed in this population. Nucleotide diversity estimated by Watterson’s θw ranges from 0.0019 to 0.0035 in these ten populations (Table 2), which makes it >4-fold higher than the average θw estimated in exons across the entire genome.44 In addition, 18 SNPs were identified in the 518 bp intron region, and none were present in dbSNP.
Table 1.
Minor Allele Frequencies of Nonsynonymous Variants at the Last Exon of APOL1 in African Human Populations
| Site | Protein Alteration |
Cameroon |
Kenya |
Nigeria |
Tanzania |
|||||||
|---|---|---|---|---|---|---|---|---|---|---|---|---|
| Fulani | Lemande | Mada | Bakola | Borana | Sengwer | Yoruba | Hadza | Iraqw | Sandawe | FST | ||
| 652 | p.Gly150Lys | 39% | 44% | 39% | 13% | 44% | 45% | 14% | 16% | 37% | 47% | 0.10 |
| 731 | p.Asn176Ser | - | 6% | 11% | 5% | - | - | 11% | - | 3% | - | - |
| 888G3 | p.Met228Ile | 26% | 3% | 3% | 32% | 14% | 16% | - | 5% | 16% | 5% | 0.098 |
| 968G3 | p.Lys255Arg | 26% | 3% | 3% | 13% | 8% | 16% | - | 5% | 13% | 3% | 0.073 |
| 996 | p.Asn264Lys | - | 6% | 5% | - | 8% | 8% | - | 34% | 5% | - | 0.15 |
| 1,001 | p.Leu266Arg | - | - | - | - | - | 3% | - | - | - | 3% | - |
| 1,013 | p.Gly270Asp | - | - | - | 5% | 8% | - | - | - | 11% | 8% | - |
| 1,097 | p.His298Arg | - | - | - | - | - | - | - | - | - | 3% | - |
| 1,136 | p.Ser311Leu | - | - | - | - | 3% | - | - | - | - | - | - |
| 1,213 | p.Asp337Asn | 8% | 14% | - | 18% | 14% | 8% | 14% | 21% | 21% | 37% | 0.046 |
| 1,228G1 | p.Ser342Gly | - | - | 3% | 5% | - | - | 39% | 5% | 5% | 5% | 0.21 |
| 1,258 | p.Leu352Phe | - | - | - | - | - | 5% | - | - | - | - | - |
| 1,354 | p.Ile384Phe | - | - | - | - | - | - | - | - | 3% | 5% | - |
| 1,356G1 | p.Ile384Met | - | - | 3% | 5% | - | - | 39% | 5% | 5% | 5% | 0.21 |
| 1,357 | p.Leu385Phe | - | - | - | - | - | - | - | - | - | 3% | - |
| 1,368G2 | p.Asn388_Tyr389del | 8% | 3% | 3% | 5% | 3% | 3% | 6% | - | 3% | - | 0.017 |
“Site” represents the nucleotide position of each variant in our sequence alignment (also see Figure 2). The G1, G2, and G3 variants are labeled as superscripts at their positions. The amino acid positions are based on RefSeq NM_003661.3. FST estimates are shown only for the common variants that were observed in more than half of the ten populations.
Table 2.
Genetic Diversity of APOL1 in Human African Populations
| Ethnic Groups | n | S | Sint | Ssyn | Sa | θw | Dint | Dexon | Dtotal |
|---|---|---|---|---|---|---|---|---|---|
| Cameroon | |||||||||
| Fulani | 38 | 17 | 10 | 2 | 5 | 0.0029 | 0.41 | 0.80 | 0.66 |
| Lemande | 36 | 19 | 11 | 2 | 6 | 0.0033 | −1.21 | −1.01 | −1.24 |
| Mada | 38 | 15 | 5 | 2 | 8 | 0.0026 | −0.05 | −1.44 | −1.07 |
| Bakola | 38 | 17 | 7 | 2 | 8 | 0.0029 | 0.17 | 0.04 | 0.11 |
| Kenya | |||||||||
| Borana | 36 | 21 | 11 | 3 | 7 | 0.0036 | −0.59 | −0.50 | −0.60 |
| Sengwer | 38 | 18 | 9 | 2 | 7 | 0.0031 | 0.37 | −0.35 | −0.01 |
| Nigeria | |||||||||
| Yoruba | 36 | 11 | 4 | 2 | 5 | 0.0019 | 0.12 | −0.06 | 0.01 |
| Tanzania | |||||||||
| Hadza | 38 | 15 | 6 | 2 | 7 | 0.0026 | 0.04 | −0.62 | −0.39 |
| Iraqw | 38 | 22 | 10 | 2 | 10 | 0.0038 | 0.19 | −0.50 | −0.21 |
| Sandawe | 38 | 22 | 9 | 2 | 11 | 0.0038 | −0.47 | −1.10 | −0.92 |
| Total | 374 | 38 | 18 | 4 | 15 | 0.0041 | −0.73 | −0.71 | −0.79 |
Abbreviations are as follows: n, number of chromosomes; Sint, number of segregating sites with intronic SNPs; Ssyn, number of segregating sites with synonymous SNPs; Sa, number of segregating sites with amino-acid-changing SNPs; θw, Watterson’s estimate of heterozygosity; and Dint, Tajima’s D for introns; Dexon, Tajima’s D for exons; and Dtotal, Tajima’s D for the total sequenced region.
The G1 risk allele, which carries two derived nonsynonymous variants (rs73885319 and rs60910145), was observed in six out of ten populations: Bakola Pygmies and Mada from Cameroon, Hadza, Iraqw, and Sandawe from Tanzania, and Yoruba from Nigeria. The allele frequency of G1 was highest in the Yoruba population (39%), consistent with Genovese et al.,24 but was ≤5% in each of the other five populations (Table 1). The G2 indel, another risk allele associated with CKD, was observed in most populations except for the Hadza and Sandawe hunter-gatherers from Tanzania and had allele frequencies ranging from 3% to 8% (Table 1). We also identified three additional nonsynonymous SNPs that occurred at the same SRA-interacting domain as G1 and G2 (i.e., sites 1,258, 1,354, and 1,357; see Figure 2). The SNP at site 1,354 occurred at the same codon (but different nucleotide sites) that codes for one of the two amino acid changes in allele G1 but caused a different amino acid change (p.Ile384Phe, RefSeq NM_003661.3). This variant was observed only in the Iraqw and Sandawe from Tanzania with allele frequencies of 3% and 5%, respectively. Allele frequencies for the intron and synonymous SNPs in each population are given in Table S3.
LD Patterns between Genetic Variants at APOL1
Patterns of LD were characterized by r2 estimates for all pairwise comparisons for the polymorphic sites with minor allele frequency ≥ 3% in each of the ten populations. The two G1 nonsynonymous SNPs that were 128 bp apart from each other were in complete LD in each of the six populations in which they were observed (Figure 3A). No other variants were found in significant LD with these two G1 SNPs at our resequenced region. No SNPs were found significantly associated with the G2 allele either.
Figure 3.
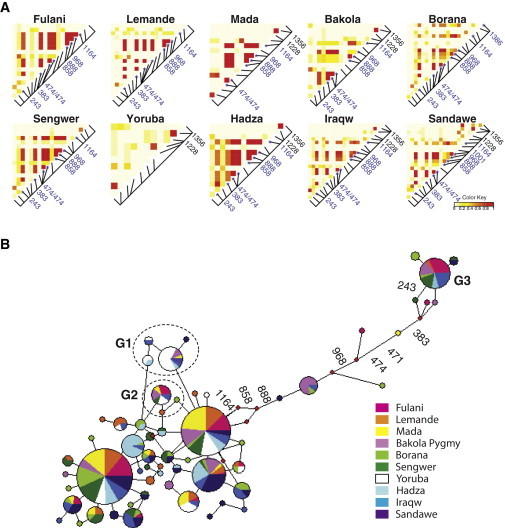
Heatmap of Pairwise LD and Haplotype Network for the APOL1 Variants in African Populations
(A) Pairwise estimates of r2 between the APOL1 variants. Each pixel represents a pairwise LD measurement using the squared correlation coefficient (r2). r2 was measured for all possible pairs of polymorphic sites. Levels of LD ranging from 0 to 1 are illustrated according to a white-to-red color gradient. The sequence position of each variant is marked by a black line segment on a diagonal line, and the positions for the G3 SNPs marked by asterisks are labeled in blue. The sequence positions (i.e., sites 1,228 and 1,356) of G1 SNPs are labeled in black.
(B) Network analysis of the APOL1 haplotypes. Each node represents a haplotype, and the nodes representing the G1, G2, and G3 haplotypes are labeled. The size for a given node is proportional to its haplotype frequency. The sequence positions of the eight SNPs that define the G3 haplotype (G3) are labeled.
We further observed eight polymorphic sites in strong LD in most populations except for the Yoruba (average r2 estimates ranged from 0.6 to 1.0; also see Figure 3A); they form a haplotype that we hereafter refer to as the “G3” haplotype. Haplotype-network analysis indicated that the G3 haplotype occurs on a branch that is highly divergent from all other common haplotypes at APOL1 (Figure 3B). The eight polymorphic sites that distinguish this haplotype are distributed across the 1.4 kb region and include two synonymous SNPs (sites 858 and 1,164), two nonsynonymous SNPs at sites 888 (rs136175) and 968 (rs136176) located at the pore-forming domain and membrane-addressing domain, respectively, and four intronic SNPs (sites 243, 383, 471, and 474). In addition, one population-specific synonymous SNP at site 1,386 was found to be strongly linked with five of the G3 SNPs (r2 = 0.65 and p = 0.005 for each pairwise comparison) in the Borana from Kenya (Figure 3A). An additional nonsynonymous SNP at site 1,001 (rs142955744) was found in complete LD with five of the G3 SNPs in the Sandawe population (r2 = 1 and p < 0.001 for each pairwise comparison). We found the G3 haplotype to be most common in the Fulani (21% in haplotype frequency), Bakola (11%), Sengwer (11%), and Iraqw (13%) populations compared to other populations (0%–5%). The detailed results of r2 estimates for all pairwise comparisons between SNPs in each population are provided in Table S4.
Identifying Signatures of Recent Adaptive Evolution
We first used Tajima’s D statistic, a summary statistic based on the allele-frequency spectrum, to test for deviation from neutral expectation. Our results showed no significant departure from neutrality in the intron, exon, or full sequence (Table 2). We further performed EHH and iHS analyses to detect signatures of recent selection by characterizing long-range patterns of LD for a subset of our sampled individuals for whom we had Illumina 1M SNP genotyping data from the entire genome. The iHS and EHH statistics were computed only for SNPs with a minor allele frequency > 5%.37 As a result, the sample size for each population was reduced (see Figure 4). Because of the small sample size, the G2 risk allele was excluded from the EHH and iHS analyses.
Figure 4.
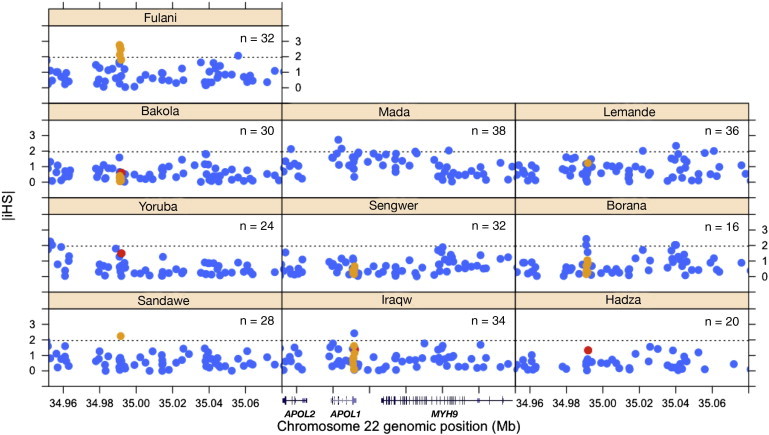
Plots of iHS Values for SNPs of APOL1 and the Adjacent Chromosomal Regions in African Populations
The absolute values of standardized iHS (|iHS|) are plotted against the genomic positions (NCBI Genome browser build 36.1) of SNPs at APOL1 and the neighboring genetic regions on chromosome 22 for a subset of our samples in each population. The number of chromosomes (n) is given for each population. The estimates of |iHS| are colored in red for the G1 SNPs and in orange for the G3 SNPs. The 95% cutoff value (1.96) of the empirical distribution of standardized iHS is given in each plot (dashed line).
We identified outliers of iHS for SNPs within the 1.4 kb resequenced region of APOL1 by comparing them to the empirical iHS distributions estimated from the genome for different frequency classes with a 95% cutoff threshold. The plots of |iHS| statistics for SNPs located at APOL1 and for flanking SNPs across an ∼120 kb chromosomal region encompassing APOL2 (MIM 607252), APOL1, and MHY9 are shown in Figure 4. Our results showed evidence of adaptive selection on the G3 haplotype in the Fulani population, in which allele frequencies of all G3 SNPs were larger than 20%. The |iHS| estimates fell outside the 95% cutoff thresholds for most of the G3 variants, and the highest |iHS| (2.67) was at site 243 (Figure 4, also see Figure S1). The EHH plots show that among the eight G3 SNPs, three have EHH on chromosomes containing their derived alleles; site 968 (rs136176) is a nonsynonymous SNP located at the membrane-addressing domain, and sites 383 and 1,164 are intronic and synonymous SNPs, respectively (Figure 5A). For the other populations, we did not observe any of the G3 SNPs outside of the 95% empirical-distribution thresholds. However, it is worth noting that allele frequencies of these G3 SNPs were lower than 20% in most populations except for the Fulani (Table 1 and Table S3), reducing our power to detect signatures of selection by using iHS or EHH analyses.37
Figure 5.
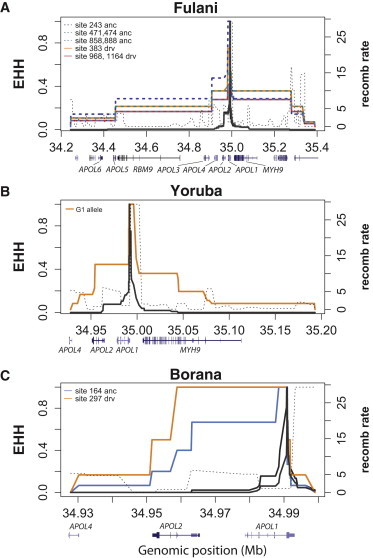
Decay of EHH for APOL1 Variants in Three African Populations
The decay of EHH for the eight SNPs of the G3 haplotype in the Fulani in Cameroon (A), for the G1 allele in the Yoruba in Nigeria (B), and for the two intron SNPs identified as outliers in the iHS analysis in the Borana in Kenya (C). The ancestral (anc) and derived (drv) alleles that show unusual long-range haplotype homozygosity are labeled by their positions in our sequenced region (see Figure 2). The sex-averaged standardized recombination rates (labeled as “recomb rate” on the right y axis) in 10 kb bins are plotted (in dashed line) against the chromosomal positions according to Kong et al.45
For the G1 haplotype in the Yoruba population, the EHH plot shows that the derived allele has a longer extended LD haplotype than the ancestral allele (Figure 5B). However, the iHS of G1 (−1.49) fell inside the 95% cutoff threshold (Figure 4), showing some discrepancies between our result and that of Genovese et al.24 For the other populations (i.e., Bakola, Iraqw, and Sandawe), the allele frequencies of G1 SNPs were ≤5% (Table 1). Finally, we identified two adjacent intronic SNPs that were in strong LD (r2 = 0.663, p < 0.001) and that were outliers in the iHS analysis in the Borana population from Kenya (|iHS| = 2.0 and 2.4 for sites 164 and 297, respectively; see Figure 4). We observed long-range LD extending only to the left side of the two SNPs at positions 164 and 297. Fast LD decay was observed on the right site of the EHH curve, correlating with the location of a recombination hotspot according to the recombination map of Kong et al.45 (Figure 5C). The plots of EHH against genetic distance are given in Figure S2. We also performed the McDonald-Kreitman and dN/dS ratio tests for detecting signatures of natural selection that might have occurred prior to the divergence of human populations. We observed no significant deviation from neutral expectation (Tables S5 and S6 and Figure S3).
Patterns of LD Decay at Low-Frequency Candidate Variants
Whereas EHH and iHS analyses are usually sensitive for detecting positive-selection signatures for intermediate-frequency variants, we found the allele frequencies of the G3 variants to be low (<20%) in many African populations (Table 1 and Table S3). In order to further characterize LD decay of the G3 haplotype in these populations, we plotted r2 estimates between all SNPs (with allele frequency ≥ 3%) against their physical distances across a 30 kb region flanking the last exon of APOL1 for those individuals who had resequencing and Illumina 1M SNP data. We then looked at how far LD extended for the SNPs composing the G3 haplotype in comparison with the r2 distribution estimated from the remaining SNPs. Figure 6 illustrates the plots of LD decay for the six populations containing two or more G3-associated SNPs in each population, and pairwise r2 is highlighted for each of the G3-associated SNPs. In the Fulani population, more than 90% of r2 values within the G3-associated SNPs showed higher LD than expected across a 15 kb region on the basis of the 95% prediction interval. This pattern is consistent with the results of the EHH analysis, which also showed unusual extended long-range haplotype homozygosity for the G3 SNPs (Figure 5A). Similarly, extended LD was also observed in the Borana, Hadza, and Iraqw populations, in which >90%, 100%, and 100% of r2 values, respectively, within the G3-associated SNPs showed higher levels of LD than expected on the basis of the 95% prediction interval in each of the three populations. In contrast, we observed no distinct LD patterns between the G3-associated SNPs and the remaining SNPs in the Bakola and Sengwer populations. The LD-decay plots for the other four populations (i.e., Lemande, Mada, Yoruba, and Sandawe) are given in Figure S4.
Figure 6.
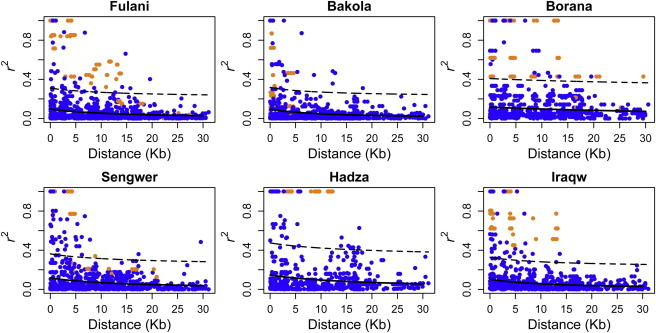
Decay of LD for the APOL1 Variants in African Populations
Plots of r2 estimates between polymorphic sites against the physical distance across a 30 kb region flanking the last exon of APOL1 in the six African populations. The r2 estimates are colored in orange for all pairwise estimates within the G3-associated SNPs. In each plot, the fitted nonlinear regression line (solid line) and its 95% prediction interval (dashed line) were plotted on the basis of all r2 estimates except for the orange dots.
Discussion
Geographic Distribution of G1 and G2 CKD Risk Alleles
Although the G1 allele of APOL1 has been identified as a risk allele contributing to CKD susceptibility for individuals of recent African descent, several studies have shown that the G1 allele is common only in western Africa and has the highest frequency (>40%) in the Yoruba from Nigeria.46–48 In our study, we also found that the allele frequency of G1 differs greatly between the Yoruba (38%) and other populations (≤5.3%, Table 1), consistent with previous findings. The high incidence of the G1 risk allele in African Americans is in agreement with the finding of Tishkoff et al.27 and Bryc et al.,49 who showed high levels of West African ancestry in African Americans. In contrast, although the G2 risk allele is present in most African populations, allele frequencies are low (≤8%).
Evidence of Recent Darwinian Selection on APOL1 Variants
In this study, we identified an additional haplotype (termed G3) that is highly divergent from the major haplotype groups at APOL1 in nine of the ten populations investigated (Figure 3B). Interestingly, none of the SNPs on the G3 haplotype were found in the Yoruba. In the Fulani population, long-range-LD analysis based on EHH and iHS statistics showed that most G3 SNPs fall outside the 95% or even 99% thresholds of the empirical distributions estimated from the entire genome. These results suggest that the G3 haplotype, or flanking region, might contain an adaptive mutation (or mutations) that was favored by selection, rapidly rose in frequency in the population, and thus resulted in strong and locus-specific LD, a signature of recent adaptive selection. The Fulani are predominantly pastoralists (who practice cattle herding), making them likely to have been subjected to severe HAT infections in the past. Indeed, it has been suggested that HAT impacted the migration history of the Fulani in the middle ages.50
We also identified two intronic SNPs (at sites 164 and 297 in strong LD) as outliers of iHS analysis in the Borana population from Kenya, although the unusual EHH was only observed for the upstream region flanking these two sites (Figure 5C). In fact, most of the EHH plots showed fast drops in EHH values at our resequenced region (Figure 5). It is notable that our resequenced region is less than 1 kb from a recombination hotspot inferred to be 29-fold higher than the average rate across the genome on the basis of the recombination map of Kong et al.,45 who measured recombination rates from directly observed recombination events by using the SNP data of parent-offspring pairs (see Figure 5C). This hotspot, however, was not identified in the recombination map used in our analysis and was therefore not taken into account during iHS computation (the recombination map of Kong et al.45 could not be used for computing the iHS for our analysis because of its low SNP density at the region surrounding APOL1). Whereas the actual boundary of this recombination hotspot remains to be determined at a finer scale, the observed drastic drops in the EHH plots imply that our resequenced region overlaps the recombination hotspot. In other words, the genetic distance might be greatly underestimated at this region, and consequently, the iHS statistics might be underestimated for these APOL1 SNPs of interest. Therefore, our inference of recent selection on the G3 haplotype in Fulani appears to be conservative.
Additionally, our analysis showed a lower iHS for the G1 allele in the Yoruba population than did Genovese et al.,24 who observed no drastic drop in EHH at either side flanking the G1 allele. This discrepancy can be at least partly explained by the effects of this closely flanking or overlapping recombination hotspot. Their data did not contain many SNPs adjacent to the G1 SNPs, and consequently, the recombination events were less likely to be detected at this region. This is because two remote variants can be in complete LD given that multiple recombination events have occurred if the number of crossover events is even. In such a case, we would expect no drop in EHH values between the two remote variants, similar to the EHH plot shown in Genovese et al.24 The recombination events can be better detected if the number of markers is increased and can consequently cause drops in EHH, as observed in our EHH plot for G1 in the Yoruba population (Figure 5B). To test for this possible interpretation, we repeated the EHH and iHS analyses by removing the intronic SNPs at our resequenced region (see Figure 2). Subsequently, we no longer observed a drastic drop in EHH near the G1 SNPs, and the |iHS| (1.92) became higher than the former estimate (1.42) (see Figure S5 for the EHH plot of G1 after exclusion of intronic SNPs).
Selection Signatures for the Low-Frequency G3 Haplotype in the Borana, Hadza, and Iraqw Populations
It has been shown that iHS analysis has limited statistical power for positive selection influencing alleles at low frequency (<20%).37 In our study, only the Fulani population had sufficiently high frequency for the G3 haplotype (>20%) to obtain power to detect selection with the use of iHS analysis. Frequencies of the G3 haplotype in the other populations were less than 20%, making it difficult to detect selection signatures with iHS or other statistical tests based on the allele frequency spectrum, such as Tajima’s D.37,51,52 To examine the pattern of LD decay at a fine scale for the G3 haplotype, we plotted r2 estimates for the pairwise comparison between SNPs against their physical distances for a 30 kb region flanking the last exon of APOL1. In addition to observing extended LD in the Fulani, we also observed extended LD for the G3-associated SNPs in the Borana, Hadza, and Iraqw populations relative to the background level of LD (Figure 6).
Several possible evolutionary mechanisms can cause elevated LD for a low-frequency haplotype in a population. First, gene conversion is a common mechanism in a multigene family and results in genetic exchange between duplicated genes that share high sequence homology. Gene conversion occurs by transferring a segment of DNA sequence from a donor to a recipient gene, and it can thus cause local elevation of LD. For this reason, we tested for gene conversion between APOL1 and its closest homolog, APOL2, but found no evidence of gene-conversion events (see the detailed results in Figure S6). Second, recent population admixture can also create LD between loci regardless of their physical distances if allele frequencies differ considerably between populations.53 Additionally, migration events could introduce novel haplotypes into a population, resulting in strong LD. Under such demographic scenarios, patterns of elevated LD are expected to be genome-wide. However, our results of iHS analysis have shown that the pattern of extended LD among the G3 SNPs is a locus-specific rather than a genome-wide pattern in the Fulani population. Similar patterns of extended LD of the G3-associated SNPs were observed across a 30 kb region in several ethnically and geographically diverse populations. These results are less likely to be caused by multiple local-admixture events that introduced the same haplotype. Finally, elevated LD can also be observed for a young haplotype that arose recently in a population under neutral evolutionary processes. However, we would not expect this young haplotype to be found in many ethnically diverse populations across eastern and western Africa. Together, the patterns of extended LD of the G3 haplotype in these populations cannot be easily explained by any of the neutral evolutionary mechanisms without the invocation of recent action of Darwinian selection.
Molecular Mechanisms of the Evolutionary Arms Race between Humans and Trypanosomes
HAT is a devastating infectious disease in sub-Saharan Africa and has a record of wiping out two-thirds of the population in Uganda during the period from 1900 to 1920.26 Human blood contains TLF, which belongs to one group of HDL particles and is composed of haptoglobin-related protein (Hpr) and APOL1. The current model of APOL1-associated trypanolysis begins with TLF uptake mediated by Hp-Hb receptors expressed by the bloodstream form of trypanosomes. During the progress of the endocytic pathway from endosome to lysosome, the pH environment in the endosome changes from neutral to acidic and causes the membrane-addressing domain of APOL1 to adopt a conformational change that results in the discharge of HDL. Subsequently, this APOL1 domain binds to the endosome membranes, where the pore-forming domain of APOL1 forms a pore in the membrane and triggers an irreversible influx of chloride ions (Cl−) and H2O from the cytoplasm into the lysosome, causing osmotic swelling of this compartment and eventually leading to parasite death.29,54,55
Although TLF can effectively lyse trypanosomes, resistance has been observed in two Trypanosoma subspecies, T. b. rhodesiense and T. b gambiense, which cause eastern and western forms of HAT, respectively.26,29 Expression of SRA in T. b. rhodesiense, however, allows neutralization of APOL1 via interaction with APOL1’s C-terminal α-helix (encoded by the SRA-interacting domain) in the endosome and results in the loss of trypanolytic activity.29 By contrast, human serum samples that contain the G1 and G2 genetic variants, which occur at the APOL1 region encoding the SRA-interacting domain of APOL1, regain the trypanolytic activity of APOL1 to lyse SRA-positive T. b. rhodesiense.24 In this study, we also identified three additional nonsynonymous changes at the SRA-interacting domain of APOL1 (Figure 2). One change (p.Ile384Phe) occurred at the same codon that codes for one of the two amino acid changes of allele G1 (p.Ile384Met). All three variants were only observed in East African populations that are exposed to T. b. rhodesiense (Table 1). Each of the three amino acid changes segregated in only one or two populations with an allele frequency < 5%, suggesting that these changes might be quite recent (Table 1). Because of their low frequency, we did not have power to detect whether selection is acting on these variants. However, it would be of great interest to detect their functional consequences on lysing the SRA-positive T. b. rhodesiense strains.
Despite the lack of SRA in T. b gambiense, this subspecies also shows resistance to trypanolytic activity in human blood, suggesting a resistance mechanism differing from the SRA-mediated mechanism in T. b. rhodesiense.29 Although the resistance mechanism in T. b gambiense remains elusive, we have identified candidate variants targeted by recent adaptive selection on the G3 haplotype in the Cameroonian Fulani population that is currently exposed to T. b. gambiense infection. Selection signatures at G3 were also observed in three eastern populations, including Borana, Hadza, and Iraqw. The G3 haplotype contains three derived SNPs; two derived SNPs are intronic and synonymous at sites 383 and 1,164, and one occurs at the membrane-addressing domain and causes an amino acid change (p.Lys255Arg) in APOL1. Thus, this nonsynonymous variant is a candidate for future studies of a potential functional role in the mechanism of resistance against T. b. gambiense and T. b. rhodesiense infection. Adaptation could also occur as a result of gene-expression changes caused by a noncoding variant.56 Indeed, Keift et al.57 proposed that a decrease in expression of the Hp-Hb-receptor gene (TbgHpHbR) in trypanosomes might contribute to parasite evasion of human TLF. Future studies on the expression levels of APOL1 in G3-haplotype carriers could be informative for elucidating potential influence on gene-expression regulation. However, it should be noted that whereas genetic signatures of selection often reflect a selection scheme that occurred in the past,58 functional assays only allow detection of resistance against parasite strains at the present time. The selection scheme is subject to change over time under the model of an evolutionary arms race between host and parasites.59 Additionally, Smith and Malik40 have reported signatures of positive selection at other APOL genes in primates and hypothesized their possible antagonistic role against pathogen infection. Natural selection could target functional variants at other APOL genes, and these variants could be in strong LD with the G3 haplotype or with other selected haplotypes at APOL1.
Selection-Targeted Haplotypes as Potential Risk Alleles Contributing to CKD Susceptibility
Whereas G1 and G2 have been identified as risk alleles contributing to CKD susceptibility, the fact that the two alleles appear to have evolved adaptively in the Yoruba24,25 suggests that selective pressure of HAT might allow deleterious or mildly deleterious mutations to increase in frequency if they can confer some protection.2,4,60 However, we did not see a strong signature of selection of these loci in other African populations that have low to moderate allele frequencies. Furthermore, the T. rhodensiense parasite is not currently common in Nigeria. These observations raise the possibility that there might be differential levels or patterns of selection across ethnically diverse Africans spatially and temporally (e.g., the geographic distribution of these parasite subspecies might have differed in the past). Alternatively, additional selective pressures other than resistance to T. rhodensiense might be influencing allele-frequency distributions. In this study, we also identified adaptive-evolution signatures impacting several other APOL1 variants, such as the G3 haplotype in the Fulani population and the haplotype that carries two intronic SNPs at sites 164 and 297 in the Borana population. Whereas the actual functional variant(s) targeted by selection might be located elsewhere, these identified haplotypes are candidates for future studies of association between risk of CKD susceptibility and infectious disease resistance in Africans.
It has been shown that African Americans have high levels of ancestry from western Africa (particularly from the Yoruba, in which the G3 haplotype is absent) but that they have little Fulani ancestry.27,49 Therefore, the G3 haplotype might not play a major role contributing to CKD susceptibility in the majority of African Americans. However, it could play a role in the susceptibility to CKD in some African populations that harbor this haplotype. For a better understanding of the genetic basis that underlies CKD susceptibility in African Americans, it would be important to identify additional common variants of APOL1 in other West African populations that are likely to be source populations for African Americans.
Acknowledgments
We thank Joseph Lachance and two anonymous reviewers for their valuable comments on the manuscript. We are grateful to Charla Lambert for her assistance with the analyses of extended haplotype homozygosity and integrated haplotype scores. We thank Bill Beggs for his technical assistance. This research was funded by National Science Foundation grants BCS-0196183 and BCS-0827436 and National Institutes of Health (NIH) grants 5-R01-GM076637-05 and 8DP1ES022577-04 to S.A.T. This project was funded in part with Federal funds from the Frederick National Laboratory for Cancer Research, NIH, under contract HHSN261200800001E. The content of this publication does not necessarily reflect the views or policies of the Department of Health and Human Services, nor does mention of trade names, commercial products, or organizations imply endorsement by the United States Government. This research was supported (in part) by the Intramural Research Program of the NIH, Frederick National Lab, Center for Cancer Research.
Supplemental Data
Web Resources
The URLs for data presented herein are as follows:
National Center for Biotechnology Information, http://www.ncbi.nlm.nih.gov/
Online Mendelian Inheritance in Man (OMIM), http://www.omim.org
Accession Numbers
The GenBank accession numbers for the APOL1 sequences reported in this paper are KC339295–KC339481.
References
- 1.Barreiro L.B., Quintana-Murci L. From evolutionary genetics to human immunology: how selection shapes host defence genes. Nat. Rev. Genet. 2010;11:17–30. doi: 10.1038/nrg2698. [DOI] [PubMed] [Google Scholar]
- 2.Haldane J.B.S. Longmans, Green & Co.; London: 1932. The Causes of Evolution. [Google Scholar]
- 3.Pauling L., Itano H.A., Wells I. Sickle cell anemia a molecular disease. Science. 1949;110:543–548. doi: 10.1126/science.110.2865.543. [DOI] [PubMed] [Google Scholar]
- 4.Haldane, J.B.S. (1949). The Rate of Mutations of Human Genes. Proceedings of the Eighth International Congress of Genetics, 267–273.
- 5.Allison A.C. Protection afforded by sickle-cell trait against subtertian malareal infection. BMJ. 1954;1:290–294. doi: 10.1136/bmj.1.4857.290. [DOI] [PMC free article] [PubMed] [Google Scholar]
- 6.Gilles H.M., Fletcher K.A., Hendrickse R.G., Lindner R., Reddy S., Allan N. Glucose-6-phosphate-dehydrogenase deficiency, sickling, and malaria in African children in South Western Nigeria. Lancet. 1967;1:138–140. doi: 10.1016/s0140-6736(67)91037-9. [DOI] [PubMed] [Google Scholar]
- 7.Luzzatto L., Usanga F.A., Reddy S. Glucose-6-phosphate dehydrogenase deficient red cells: resistance to infection by malarial parasites. Science. 1969;164:839–842. doi: 10.1126/science.164.3881.839. [DOI] [PubMed] [Google Scholar]
- 8.Akey J.M., Eberle M.A., Rieder M.J., Carlson C.S., Shriver M.D., Nickerson D.A., Kruglyak L. Population history and natural selection shape patterns of genetic variation in 132 genes. PLoS Biol. 2004;2:e286. doi: 10.1371/journal.pbio.0020286. [DOI] [PMC free article] [PubMed] [Google Scholar]
- 9.Cagliani R., Pozzoli U., Forni D., Cassinotti A., Fumagalli M., Giani M., Fichera M., Lombardini M., Ardizzone S., Asselta R. Crohn’s disease Loci are common targets of protozoa-driven selection. Mol. Biol. Evol. 2013;30:1077–1087. doi: 10.1093/molbev/mst020. [DOI] [PubMed] [Google Scholar]
- 10.Cowie C.C., Port F.K., Wolfe R.A., Savage P.J., Moll P.P., Hawthorne V.M. Disparities in incidence of diabetic end-stage renal disease according to race and type of diabetes. N. Engl. J. Med. 1989;321:1074–1079. doi: 10.1056/NEJM198910193211603. [DOI] [PubMed] [Google Scholar]
- 11.Kiberd B.A., Clase C.M. Cumulative risk for developing end-stage renal disease in the US population. J. Am. Soc. Nephrol. 2002;13:1635–1644. doi: 10.1097/01.asn.0000014251.87778.01. [DOI] [PubMed] [Google Scholar]
- 12.Kopp J.B., Winkler C. HIV-associated nephropathy in African Americans. Kidney Int. Suppl. 2003;63:S43–S49. doi: 10.1046/j.1523-1755.63.s83.10.x. [DOI] [PubMed] [Google Scholar]
- 13.Kitiyakara C., Eggers P., Kopp J.B. Twenty-one-year trend in ESRD due to focal segmental glomerulosclerosis in the United States. Am. J. Kidney Dis. 2004;44:815–825. [PubMed] [Google Scholar]
- 14.Toto R.D. Proteinuria and hypertensive nephrosclerosis in African Americans. Kidney Int. Suppl. 2004;66:S102–S104. doi: 10.1111/j.1523-1755.2004.09224.x. [DOI] [PubMed] [Google Scholar]
- 15.Tareen N., Zadshir A., Martins D., Pan D., Nicholas S., Norris K. Chronic kidney disease in African American and Mexican American populations. Kidney Int. Suppl. 2005;68:S137–S140. doi: 10.1111/j.1523-1755.2005.09723.x. [DOI] [PubMed] [Google Scholar]
- 16.Coresh J., Selvin E., Stevens L.A., Manzi J., Kusek J.W., Eggers P., Van Lente F., Levey A.S. Prevalence of chronic kidney disease in the United States. JAMA. 2007;298:2038–2047. doi: 10.1001/jama.298.17.2038. [DOI] [PubMed] [Google Scholar]
- 17.Fernández M., Alarcón G.S., Calvo-Alén J., Andrade R., McGwin G., Jr., Vilá L.M., Reveille J.D., LUMINA Study Group A multiethnic, multicenter cohort of patients with systemic lupus erythematosus (SLE) as a model for the study of ethnic disparities in SLE. Arthritis Rheum. 2007;57:576–584. doi: 10.1002/art.22672. [DOI] [PubMed] [Google Scholar]
- 18.United State Renal Data System USRD . National Institutes of Health, National Institute of Diabetes and Digestive and Kidney Diseases; Bethesda: 2011. Annual Data Report: Atlas of Chronic Kidney Disease and End-Stage Renal Disease in the United States. [Google Scholar]
- 19.Cambien F. Heritability, weak effects, and rare variants in genomewide association studies. Clin. Chem. 2011;57:1263–1266. doi: 10.1373/clinchem.2010.155655. [DOI] [PubMed] [Google Scholar]
- 20.Chapman S.J., Hill A.V.S. Human genetic susceptibility to infectious disease. Nat. Rev. Genet. 2012;13:175–188. doi: 10.1038/nrg3114. [DOI] [PubMed] [Google Scholar]
- 21.Hardy J., Singleton A. Genomewide association studies and human disease. N. Engl. J. Med. 2009;360:1759–1768. doi: 10.1056/NEJMra0808700. [DOI] [PMC free article] [PubMed] [Google Scholar]
- 22.Juran B.D., Lazaridis K.N. Genomics in the post-GWAS era. Semin. Liver Dis. 2011;31:215–222. doi: 10.1055/s-0031-1276641. [DOI] [PMC free article] [PubMed] [Google Scholar]
- 23.Nelson G.W., Freedman B.I., Bowden D.W., Langefeld C.D., An P., Hicks P.J., Bostrom M.A., Johnson R.C., Kopp J.B., Winkler C.A. Dense mapping of MYH9 localizes the strongest kidney disease associations to the region of introns 13 to 15. Hum. Mol. Genet. 2010;19:1805–1815. doi: 10.1093/hmg/ddq039. [DOI] [PMC free article] [PubMed] [Google Scholar]
- 24.Genovese G., Friedman D.J., Ross M.D., Lecordier L., Uzureau P., Freedman B.I., Bowden D.W., Langefeld C.D., Oleksyk T.K., Uscinski Knob A.L. Association of trypanolytic ApoL1 variants with kidney disease in African Americans. Science. 2010;329:841–845. doi: 10.1126/science.1193032. [DOI] [PMC free article] [PubMed] [Google Scholar]
- 25.Tzur S., Rosset S., Shemer R., Yudkovsky G., Selig S., Tarekegn A., Bekele E., Bradman N., Wasser W.G., Behar D.M., Skorecki K. Missense mutations in the APOL1 gene are highly associated with end stage kidney disease risk previously attributed to the MYH9 gene. Hum. Genet. 2010;128:345–350. doi: 10.1007/s00439-010-0861-0. [DOI] [PMC free article] [PubMed] [Google Scholar]
- 26.Lundkvist G.B., Kristensson K., Bentivoglio M. Why trypanosomes cause sleeping sickness. Physiology (Bethesda) 2004;19:198–206. doi: 10.1152/physiol.00006.2004. [DOI] [PubMed] [Google Scholar]
- 27.Tishkoff S.A., Reed F.A., Friedlaender F.R., Ehret C., Ranciaro A., Froment A., Hirbo J.B., Awomoyi A.A., Bodo J.M., Doumbo O. The genetic structure and history of Africans and African Americans. Science. 2009;324:1035–1044. doi: 10.1126/science.1172257. [DOI] [PMC free article] [PubMed] [Google Scholar]
- 28.World Health Organization. (2000). WHO Report on Global Surveillance of Epidemic-prone Infectious Diseases. http://www.who.int/csr/resources/publications/surveillance/a_tryps.pdf.
- 29.Pays E., Vanhollebeke B., Vanhamme L., Paturiaux-Hanocq F., Nolan D.P., Pérez-Morga D. The trypanolytic factor of human serum. Nat. Rev. Microbiol. 2006;4:477–486. doi: 10.1038/nrmicro1428. [DOI] [PubMed] [Google Scholar]
- 30.Stephens M., Donnelly P. A comparison of bayesian methods for haplotype reconstruction from population genotype data. Am. J. Hum. Genet. 2003;73:1162–1169. doi: 10.1086/379378. [DOI] [PMC free article] [PubMed] [Google Scholar]
- 31.Stephens M., Smith N.J., Donnelly P. A new statistical method for haplotype reconstruction from population data. Am. J. Hum. Genet. 2001;68:978–989. doi: 10.1086/319501. [DOI] [PMC free article] [PubMed] [Google Scholar]
- 32.Watterson G.A. On the number of segregating sites in genetical models without recombination. Theor. Popul. Biol. 1975;7:256–276. doi: 10.1016/0040-5809(75)90020-9. [DOI] [PubMed] [Google Scholar]
- 33.Hartl D.L., Clark A.G. Sinauer Associates; Sunderland: 1997. Principles of population genetics. [Google Scholar]
- 34.Hill W.G., Robertson A. Linkage disequilibrium in finite populations. Theor. Appl. Genet. 1968;38:226–231. doi: 10.1007/BF01245622. [DOI] [PubMed] [Google Scholar]
- 35.Shin J., Blay S., McNeney B., Graham J. LDheatmap: An R Function for Graphical Display of Pairwise Linkage Disequilibria between Single Nucleotide Polymorphisms. J. Stat. Softw. 2006;16 Code Snippet 3. [Google Scholar]
- 36.Sabeti P.C., Reich D.E., Higgins J.M., Levine H.Z.P., Richter D.J., Schaffner S.F., Gabriel S.B., Platko J.V., Patterson N.J., McDonald G.J. Detecting recent positive selection in the human genome from haplotype structure. Nature. 2002;419:832–837. doi: 10.1038/nature01140. [DOI] [PubMed] [Google Scholar]
- 37.Voight B.F., Kudaravalli S., Wen X.Q., Pritchard J.K. A map of recent positive selection in the human genome. PLoS Biol. 2006;4:e72. doi: 10.1371/journal.pbio.0040072. [DOI] [PMC free article] [PubMed] [Google Scholar]
- 38.Scheet P., Stephens M. A fast and flexible statistical model for large-scale population genotype data: applications to inferring missing genotypes and haplotypic phase. Am. J. Hum. Genet. 2006;78:629–644. doi: 10.1086/502802. [DOI] [PMC free article] [PubMed] [Google Scholar]
- 39.Sabeti P.C., Walsh E., Schaffner S.F., Varilly P., Fry B., Hutcheson H.B., Cullen M., Mikkelsen T.S., Roy J., Patterson N. The case for selection at CCR5-Delta32. PLoS Biol. 2005;3:e378. doi: 10.1371/journal.pbio.0030378. [DOI] [PMC free article] [PubMed] [Google Scholar]
- 40.Smith E.E., Malik H.S. The apolipoprotein L family of programmed cell death and immunity genes rapidly evolved in primates at discrete sites of host-pathogen interactions. Genome Res. 2009;19:850–858. doi: 10.1101/gr.085647.108. [DOI] [PMC free article] [PubMed] [Google Scholar]
- 41.Jarvis J.P., Scheinfeldt L.B., Soi S., Lambert C., Omberg L., Ferwerda B., Froment A., Bodo J.M., Beggs W., Hoffman G. Patterns of ancestry, signatures of natural selection, and genetic association with stature in Western African pygmies. PLoS Genet. 2012;8:e1002641. doi: 10.1371/journal.pgen.1002641. [DOI] [PMC free article] [PubMed] [Google Scholar]
- 42.Verrelli B.C., McDonald J.H., Argyropoulos G., Destro-Bisol G., Froment A., Drousiotou A., Lefranc G., Helal A.N., Loiselet J., Tishkoff S.A. Evidence for balancing selection from nucleotide sequence analyses of human G6PD. Am. J. Hum. Genet. 2002;71:1112–1128. doi: 10.1086/344345. [DOI] [PMC free article] [PubMed] [Google Scholar]
- 43.Hudson R.R. Linkage disequilibrium and recombination. In: Balding D., Bishop M., Cannings C., editors. Handbook of statistical genetics. John Wiley & Sons; New York: 2001. pp. 309–324. [Google Scholar]
- 44.Lachance J., Vernot B., Elbers C.C., Ferwerda B., Froment A., Bodo J.M., Lema G., Fu W., Nyambo T.B., Rebbeck T.R. Evolutionary history and adaptation from high-coverage whole-genome sequences of diverse African hunter-gatherers. Cell. 2012;150:457–469. doi: 10.1016/j.cell.2012.07.009. [DOI] [PMC free article] [PubMed] [Google Scholar]
- 45.Kong A., Thorleifsson G., Gudbjartsson D.F., Masson G., Sigurdsson A., Jonasdottir A., Walters G.B., Jonasdottir A., Gylfason A., Kristinsson K.T. Fine-scale recombination rate differences between sexes, populations and individuals. Nature. 2010;467:1099–1103. doi: 10.1038/nature09525. [DOI] [PubMed] [Google Scholar]
- 46.Behar D.M., Kedem E., Rosset S., Haileselassie Y., Tzur S., Kra-Oz Z., Wasser W.G., Shenhar Y., Shahar E., Hassoun G. Absence of APOL1 risk variants protects against HIV-associated nephropathy in the Ethiopian population. Am. J. Nephrol. 2011;34:452–459. doi: 10.1159/000332378. [DOI] [PubMed] [Google Scholar]
- 47.Kopp J.B., Nelson G.W., Sampath K., Johnson R.C., Genovese G., An P., Friedman D., Briggs W., Dart R., Korbet S. APOL1 genetic variants in focal segmental glomerulosclerosis and HIV-associated nephropathy. J. Am. Soc. Nephrol. 2011;22:2129–2137. doi: 10.1681/ASN.2011040388. [DOI] [PMC free article] [PubMed] [Google Scholar]
- 48.Wasser W.G., Tzur S., Wolday D., Adu D., Baumstein D., Rosset S., Skorecki K. Population genetics of chronic kidney disease: the evolving story of APOL1. J. Nephrol. 2012;25:603–618. doi: 10.5301/jn.5000179. [DOI] [PubMed] [Google Scholar]
- 49.Bryc K., Velez C., Karafet T., Moreno-Estrada A., Reynolds A., Auton A., Hammer M., Bustamante C.D., Ostrer H. Colloquium paper: genome-wide patterns of population structure and admixture among Hispanic/Latino populations. Proc. Natl. Acad. Sci. USA. 2010;107(Suppl 2):8954–8961. doi: 10.1073/pnas.0914618107. [DOI] [PMC free article] [PubMed] [Google Scholar]
- 50.Steverding D. The history of African trypanosomiasis. Parasit Vectors. 2008;1:3. doi: 10.1186/1756-3305-1-3. [DOI] [PMC free article] [PubMed] [Google Scholar]
- 51.Akashi H. Inferring the fitness effects of DNA mutations from polymorphism and divergence data: statistical power to detect directional selection under stationarity and free recombination. Genetics. 1999;151:221–238. doi: 10.1093/genetics/151.1.221. [DOI] [PMC free article] [PubMed] [Google Scholar]
- 52.Grossman S.R., Shlyakhter I., Karlsson E.K., Byrne E.H., Morales S., Frieden G., Hostetter E., Angelino E., Garber M., Zuk O. A composite of multiple signals distinguishes causal variants in regions of positive selection. Science. 2010;327:883–886. doi: 10.1126/science.1183863. [DOI] [PubMed] [Google Scholar]
- 53.Hartl D.L., Clark A.G. Sinauer Associates; Sunderland: 2007. Principles of population genetics. [Google Scholar]
- 54.Vanhollebeke B., Pays E. The trypanolytic factor of human serum: many ways to enter the parasite, a single way to kill. Mol. Microbiol. 2010;76:806–814. doi: 10.1111/j.1365-2958.2010.07156.x. [DOI] [PubMed] [Google Scholar]
- 55.Wheeler R.J. The trypanolytic factor-mechanism, impacts and applications. Trends Parasitol. 2010;26:457–464. doi: 10.1016/j.pt.2010.05.005. [DOI] [PubMed] [Google Scholar]
- 56.Tishkoff S.A., Reed F.A., Ranciaro A., Voight B.F., Babbitt C.C., Silverman J.S., Powell K., Mortensen H.M., Hirbo J.B., Osman M. Convergent adaptation of human lactase persistence in Africa and Europe. Nat. Genet. 2007;39:31–40. doi: 10.1038/ng1946. [DOI] [PMC free article] [PubMed] [Google Scholar]
- 57.Kieft R., Capewell P., Turner C.M., Veitch N.J., MacLeod A., Hajduk S. Mechanism of Trypanosoma brucei gambiense (group 1) resistance to human trypanosome lytic factor. Proc. Natl. Acad. Sci. USA. 2010;107:16137–16141. doi: 10.1073/pnas.1007074107. [DOI] [PMC free article] [PubMed] [Google Scholar]
- 58.Sabeti P.C., Schaffner S.F., Fry B., Lohmueller J., Varilly P., Shamovsky O., Palma A., Mikkelsen T.S., Altshuler D., Lander E.S. Positive natural selection in the human lineage. Science. 2006;312:1614–1620. doi: 10.1126/science.1124309. [DOI] [PubMed] [Google Scholar]
- 59.Woolhouse M.E., Webster J.P., Domingo E., Charlesworth B., Levin B.R. Biological and biomedical implications of the co-evolution of pathogens and their hosts. Nat. Genet. 2002;32:569–577. doi: 10.1038/ng1202-569. [DOI] [PubMed] [Google Scholar]
- 60.Ko W.-Y., Gomez F., Tishkoff S.A. Evolution of human erythrocyte-specific genes involved in malaria susceptibility. In: Singh R.S., Xu J., Kulathinal R.J., editors. Rapidly Evolving Genes and Genetic Systems. Oxford University Press; Oxford: 2012. pp. 223–234. [Google Scholar]
Associated Data
This section collects any data citations, data availability statements, or supplementary materials included in this article.