

Abstract
The CA 19-9 antigen is currently the best individual marker for the detection of pancreatic cancer. In order to optimize the CA 19-9 assay and to develop approaches to further improve cancer detection, it is important to understand the specificity differences between CA 19-9 antibodies and the consequential affect on biomarker performance. Antibody arrays enabled multiplexed comparisons between five different CA 19-9 antibodies used in the analysis of plasma samples from pancreatic cancer patients and controls. Major differences were observed between antibodies in their detection of particular patient samples. Glycan array analysis revealed that certain antibodies were highly specific for the canonical CA 19-9 epitope, sialyl-Lewis A, while others bound sialyl-Lewis A in addition to a related structure called sialyl-Lewis C and modification with Nue5Gc. In a much larger patient cohort we confirmed the binding of Sialyl-Lewis C glycan by one of the antibodies and showed that the broader specificity led to the detection of an increased number of cancer patients without increasing detection of pancreatitis patient samples. This work demonstrates that variation between antibody specificity for cancer-associated glycans can have significant implications for biomarker performance and highlights the value of characterizing and detecting the range of glycan structures that are elevated in cancer.
Introduction
The CA 19-9 antigen is the current best marker and the only FDA-approved test for pancreatic cancer. CA 19-9 is elevated in the peripheral blood of the majority of pancreatic cancer patients but does not achieve the performance required for either early detection or diagnosis, due to both false positive and false negative readings [1, 2]. Patients with biliary obstruction, liver diseases, and pancreatitis may have elevations in CA 19-9, so its elevation is not exclusively specific for malignancy. In addition, some patients with cancer do not show elevation [3], reducing its usefulness for confirming cancer in suspect cases. The information from CA 19-9 is useful, in coordination with other clinical factors, for monitoring disease progression in patients receiving therapy [2, 4–8]. Methods to improve detection of the patients who are low in CA 19-9, or to reduce false detection of patients with non-malignant elevations in CA 19-9, would be useful for developing effective pancreatic cancer biomarkers.
Many monoclonal antibodies have been developed against the CA 19-9 antigen, which is a carbohydrate structure called sialyl-Lewis A (part of the Lewis family of blood group antigens) with the sequence Neu5Acα2,3Galβ1,3(Fucα1,4)GlcNAc. Sialyl Lewis A is synthesized by glycosyltransferases that sequentially link the monosaccharide precursors onto both N-linked and O-linked glycans [9]. Sialyl Lewis A is not found at a high level in normal tissues, but it is found in embryonic tissue [10] and overexpressed in certain epithelial cancers and inflammatory conditions [1]. It is attached to many different proteins, including mucins, carcinoembryonic antigen [11, 12], and circulating apolipoproteins [13]. In the standard CA 19-9 clinical assay, a monoclonal antibody captures and detects the CA 19-9 antigen in a sandwich ELISA format, which measures the CA 19-9 antigen on many different carrier proteins [12, 14].
Although many different antibodies have been developed, it is not clear whether these antibodies are all highly specific for the canonical CA 19-9 epitope, sialyl-Lewis A, and whether specificity differences have an effect on biomarker performance. A previous analysis of the binding specificities of glycan-binding antibodies suggested that off-target binding was relatively common [15]. Since cancer patients can have elevated levels of a variety of glycans in addition to sialyl-Lewis A [16–18], each of which can be more or less specific for cancer, variation in the binding specificity of detection antibodies could have a profound effect on biomarker performance. A better understanding of antibody binding specificity could enable the optimization of the CA 19-9 assay to improve cancer detection.
In order to determine how the binding specificities of CA 19-9 antibodies relate to their performance as biomarkers, we used a low-volume, high-throughput antibody array method [19] to examine the performance of multiple pairs of antibodies for detecting the CA 19-9 antigen in the plasma of pancreatic cancer patients and controls. We compared signal intensities relative to negative controls, reproducibility, and accuracy for discriminating cancer from control samples. Furthermore, glycan array data [20, 21] provided detailed insights into the specificities of the antibodies and revealed important differences in reactivity toward glycans that are closely related to the CA 19-9 antigen and that occur in a significant proportion of the population. We found that the differences in the glycan specificities of the antibodies resulted in significant differences in which patients were detected to have cancer, ultimately leading to improved biomarker performance for the antibody that had a broader binding specificity. These results highlight the need for detailed characterization of the binding specificities of anti-glycan antibodies and also suggest strategies for further improving cancer detection.
Materials and Methods
Plasma samples
Plasma samples from pancreatic cancer and pancreatitis patients were collected at the University Of Pittsburgh School Of Medicine. The samples were collected using a standard operating procedure based on the serum and plasma protocols from the Early Detection Research Network of the National Cancer Institute. All samples were stored at −80°C, and each aliquot had been thawed no more than three times before use. All sample collections were performed under protocols approved by the local Institutional Review Boards, and written informed consent was obtained from all participants.
Antibodies
The antibodies were obtained from various sources (Table 1). All antibodies were dialyzed (Slide-A-Lyzer Mini Dialysis Units, Pierce Biotechnology) against pH 7.2 PBS at 4 degrees for 2 hours and ultracentrifuged at 47,000 x g at 4 °C for 1 hour. The antibodies were prepared at 250 μg/mL in 1X PBS with 0.1% Tween-20 prior to printing. Antibodies that were used for detection were biotinylated (EZ-link Sulfo-NHS-LC-Biotin, Pierce Biotechnology). The negative control antibodies were a mouse monoclonal antibody against anthrax lethal toxin and a mouse monoclonal antibody against anthrax protective antigen (chosen because they have no specificity to human epitopes). The positive control antibody was a mouse monoclonal that was labeled with biotin. The control antibodies were a kind gift of Dr. Brian Cao (VARI).
Table 1.
Antibodies targeting the CA 19-9 antigen used in this study
| Number | Clone ID | Source | Cat # | Immunogen |
|---|---|---|---|---|
| AB1 | 1B.844 | USBiological | C0075-07 | Purified CA19-9 mucin antigen |
| AB2 | 9L426 | USBiological | C0075-03A | Sialylated Lewis A (CA19-9 Cancer Antigen) |
| AB3 | 2M1 | USBiological | C0075-27 | Purified human pancreatic tumor antigen (CA19-9) |
| AB4 | SPM110 | AbCam | ab15146 | Purified CA19-9 |
| AB5 | 121SLE | AbCam | ab3982 | Immunoprecipitate obtained after immunodiffusion of mAb 19-9 and mucins isolated from an ovarian cyst of an Lewis (a+b−) patient |
Antibody microarray assays
Forty-eight identical antibody arrays were printed onto glass microscope slides coated with ultra-thin nitrocellulose (PATH Slides, GenTel Biosciences) using a contact printer (Aushon 2470; Aushon BioSystems). Each of the five CA 19-9 antibodies and three control antibodies was printed in triplicate and randomized within each array, for a total of 24 spots per array. The individual arrays were spaced by 4.5 mm in a 4 × 12 arrangement [19, 22]. After printing, hydrophobic boarders were imprinted onto the slides (SlideImprinter, The Gel Company, San Francisco, CA) to segregate the arrays and allow for individual incubations on each array.
The arrays were blocked using 1% bovine serum albumin (BSA) in phosphate buffered saline (PBS) plus 0.5% Tween-20 for one hour at room temperature. The plasma samples were diluted two-fold into PBS containing 0.1% Tween-20, 0.1% Brij-35, an IgG blocking cocktail (200 μg/mL mouse and rabbit IgG and 100 μg/mL goat and sheep IgG (Jackson ImmunoResearch Inc.)) and protease inhibitor (Complete Mini EDTA-free Tablet, Roche Applied Science). After briefly rinsing the arrays in PBS/0.1% Tween-20, the samples were incubated on the arrays overnight at 4 °C. The arrays were washed in three changes of PBS/0.1% Tween-20 for three minutes each and dried by centrifugation (Eppendorf 5810R, rotor A-4-62, 1500 x g for three minutes), and a biotinylated CA 19-9 detection antibody or Dupan-2 antibody (3 μg/mL in PBS with 0.1% BSA and 0.1% Tween-20) were incubated for one hour at room temperature. After washing and drying the arrays as above, phycoerythrin-conjugated streptavidin (Roche Applied Science) prepared at 2 μg/mL in PBS with 0.1% BSA and 0.1% Tween-20 was incubated for one hour at room temperature, followed by a final wash and dry. The arrays were scanned for fluorescence (LS Reloaded, Tecan) at 532 nm excitation, and the resulting images were analyzed using GenePix Pro 5.1 (Molecular Devices, Sunnyvale, CA). The data analysis and preparation was performed using Microsoft Excel, MultiExperiment Viewer, and Canvas X.
Glycan microarray analysis
Aliquots of three of the monoclonal antibodies were sent to the glycan microarray core facility (part of the Consortium for Functional Glycomics) at Emory University. Each biotinylated antibody was incubated at three concentrations (20 μg/mL, 2 μg/mL, and 0.2 μg/mL) on version 5.0 of the glycan microarray and probed for binding using fluorophore-conjugated streptavidin. The arrays were processed using the published methods [21].
Results
Antibody arrays were generated containing five different monoclonal antibodies raised against the CA 19-9 antigen (Table 1), along with negative and positive control antibodies (see Materials and Methods), each printed in triplicate. Plasma samples from patients with pancreatic cancer (n = 11) and patients with pancreatitis (n = 11) were each incubated on five separate arrays, and each array was probed with one of the CA 19-9 antibodies. The whole set of arrays was repeated three times. These experiments allowed multiplexed comparisons of all combinations of capture and detection antibodies (Fig. 1). We compared various performance characteristics between all the capture-detection combinations, including average signal (averaged over all samples), average signal relative to negative controls, and discrimination between the cancer and control samples (using either accuracy at a defined threshold or p value by t test) (Fig. 2).
Figure 1.

Antibody arrays for comparing capture-detection combinations of antibodies. Three arrays are depicted, each with three different, immobilized antibodies. After incubation of each array with the identical sample, proteins are captured by each antibody. Each array is probed with a different detection antibody, so that all possible combinations of capture and detection antibodies may be efficiently compared.
Figure 2.

Performance comparison of the capture-detection combinations. A) Signal comparisons. Each combination of capture and detection antibody was compared by net signal and net signal relative to the negative control array or the negative control antibodies. Net signal refers to the background-subtracted intensity, and the value indicated by each square is the average net signal over all 14 samples. The scale is given by the color bar. To calculate the ratio relative to the negative control array (Net Signal:PBS Ratio), the average net signal was divided by the signal measured in an equivalent array incubated with PBS instead of plasma. To calculate the ratio relative to the negative control antibodies (Net Signal: Negative Control Antibody Ratio), the net signal was divided by the average net signal measured at the negative control antibody (a non-specific monoclonal antibody) for a given detection antibody. B) Biomarker performance comparisons. For each of the nine capture-detection combinations of AB1, AB2, and AB5, the –logged p value (left) and the accuracy (right) for discriminating the 11 cancer patient samples from the 11 pancreatitis patient samples is given. The p value (by students t test) was logged (base 10) and multiplied by −1 for ease of comparison. The dashed line at 1.3 indicates a p value of 0.05. The accuracy was calculated by the number of samples correctly classified (at a threshold giving two false positive elevations of pancreatitis patient samples) divided by the total number of samples. The error bars indicate the standard deviation over three independent measurements.
Antibodies 1 and 5 (AB1 and AB5) gave the best signal, both as capture and detection antibodies, and combinations with AB2 also gave signals at high levels relative to combinations with AB3 or AB4 (Fig. 2A). Non-specific binding was low, shown by high signals relative to the negative controls (Fig. 2A). These analyses show significant differences between the five antibodies in the amount of signal generated, probably due to affinity differences between the antibodies.
The main consideration in the evaluation of antibodies against cancer antigens is how well each antibody discriminates between cancer and control samples. We focused on the three antibodies that showed highest signals (AB1, AB2, and AB5) and evaluated each capture-detection pair (Fig. 2B). Most pairs gave statistically significant (p < 0.05) discrimination between the groups, except two pairs using AB5 where the detection antibody did not function as well as the others. Overall accuracy was similar between all pairs, indicating general similarity between the antibody pairs for distinguishing cancer from control samples.
A cluster of the data from all capture-detection combinations provided a sample-by-sample comparison of performance (Fig. 3). The various pairs generally shared the same pattern across the samples, indicating that the antibodies detect essentially the same epitope. However, some differences between the antibodies emerged. For example, pairs involving AB5 did not detect elevations in samples 3758 and 3612; whereas all other pairs did. Therefore, while all pairs generally showed elevations in the same cancer samples, differences were observed between some antibodies in their binding to certain individual patient samples.
Figure 3.
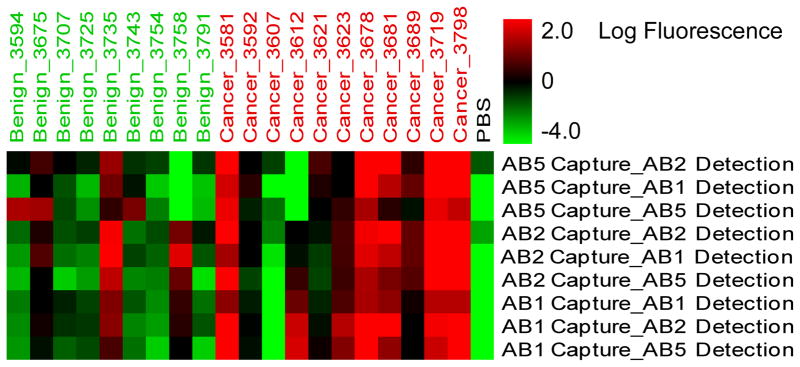
Patient-specific variation in capture-detection pairs. The row labels indicate a particular capture-detection combination, and the column labels indicate each patient sample. The color of each square indicates the value of the measurement according to the color bar. The PBS sample refers to the negative control array that was incubated with PBS instead of plasma.
In order to obtain more information about the source of the differences between the antibodies, the binding specificities of AB1, AB2, AB5 were analyzed by glycan arrays. The Consortium for Functional Glycomics provides glycan arrays containing hundreds of biologically-relevant glycans [21]. The arrays contain several glycans that display the primary epitope of the CA 19-9 antibodies, sialyl-Lewis A, in addition to glycans with minor alterations to sialyl-Lewis A. Therefore the relative binding of an antibody to the various glycans on the array should indicate the preference of the antibody for specific structural features [23]. We found that the three oligosaccharides which contained the sialyl-Lewis A antigen showed the highest binding by the CA 19-9 antibodies, as expected (Fig. 4). AB2 was highly specific for sialy-Lewis A, indicated by very low binding to all other glycans not displaying CA 19-9. AB1 and AB5 showed elevated binding to additional glycans, such as a version of sialy-Lewis A that contained the sialic acid N-glycoylneuraminic acid (Neu5Gc) instead of 5-acetyl neuraminic acid (Neu5Ac). Of the multiple forms of sialic acid, Neu5Ac is the most common and is represented most on the glycan array. Neu5Gc, which is not synthesized in humans but incorporated from food sources [24], may be displayed at elevated levels in certain cancer patients [25] and induce specific anti-Neu5Gc antibodies [26]. AB1 and AB5 also were able to bind in the absence of fucose on sialyl-Lewis A to give the sialyl-Lewis C structure (Neu5Acα2,3Galβ1,3GlcNAc) (Fig. 4B). AB1 and AB5 bound sialyl-Lewis C at levels below sialyl-Lewis A but well above any other glycans on the array. This analysis indicates that AB1 and AB5 are able to bind structures highly related to sialyl-Lewis A, the canonical CA 19-9 antigen, and that AB2 is very specific for sialyl-Lewis A.
Figure 4.

Glycan array analysis of antibody specificity. A) Antibody binding to particular glycans. Each graph represents the amount of binding of each antibody to specific glycan spots on a glycan array. The top six glycans are shown for each antibody (the structures of the glycans are given in panel B) The lower right graph compares all three antibodies at the 2 μg/mL concentration. Each antibody was incubated on the glycan arrays at three different concentrations. B) Structures of the top-bound glycans. The linear sequence of each glycan is given along with symbol representation, and a box is placed around the sialyl-Lewis A structure (the canonical CA 19-9 antigen). Diamonds indicate sialic acid (abbreviated Neu5Ac or Neu5Gc), circles indicate galactose (abbreviated Gal), squares indicate N-acetylglucosamine (abbreviated GlcNAc), and diamonds indicate fucose (abbreviated Fuc). CFG, Consortium for Functional Glycomics.
The differences between the antibodies in detecting specific patient samples (Fig. 3) might result from the occasional elevation of the sialyl-Lewis C structure in patients that are negative for sialyl-Lewis A, resulting in relatively higher binding by CA 19-9 antibodies that also bind sialyl-Lewis C. Such a switch from sialyl-Lewis A to sialyl-Lewis C could be genotypically driven. The primary enzyme that attaches fucose to the 4′ carbon of type 1 lactosamine (Galβ1,2GlcNAc) to form sialyl-Lewis A is fucosyltransferase 3 (FUT3). Genotypic variants which reduce activity or inactivate FUT3 occur heterozygously in about 30% and homozygously in about 10% of the American population [27]. Weakened FUT3 activity is known to associated with lower levels of the CA 19-9 antigen [28, 29].
To gain more insight into the role of genotypic variation in differences between CA 19-9 antibodies, we used the Dupan-2 antibody, which is specific for the sialyl-Lewis C structure [30, 31], as a detection antibody to determine the level of sialyl-Lewis C captured by AB2 or AB5 in each sample. To achieve a broader analysis, we acquired measurements from 124 cancer patient samples and 40 samples from pancreatitis patients. Capture by AB5 but not AB2 showed high signal in many cancer patients when detected by Dupan-2 (Fig. 5A). Both antibodies captured a high level of the CA 19-9 antigen, as indicated by detection with AB2 (Fig. 5B). This result demonstrates that AB5 captures both the sialyl-Lewis C and the sialyl-Lewis A glycans and that AB2 captures primarily sialyl-Lewis A. Furthermore, the result shows that the broader specificity of AB5 improves its performance for cancer detection, since many cancer patients have elevated levels of the sialyl-Lewis C glycan.
Figure 5.

Epitope differences and performance variation over a population. A) A comparison of binding of sialyl-Lewis C between AB2 and AB5. After incubation of antibody arrays with 124 cancer patient samples, the arrays were probed with the Dupan-2 antibody (which binds sialyl-Lewis C). Signal was quantified at both AB2 (values on the y-axis) and AB5 (values on the x-axis). Each symbol represents measurements from a patient sample, showing near exclusive binding of sialyl-Lewis C by AB5. B) A comparison of biomarker performance between AB2 and AB5. 40 samples from pancreatitis patients and 124 samples from pancreatic cancer patients were assayed by both AB2-AB2 (values on the y-axis) and AB5-AB2 (values on the x-axis). The dashed lines represent a threshold giving elevations of two pancreatitis patient samples along each axis. The right panel shows a detailed view of the samples with a signal below 10,000 relative fluorescence units (RFU). The samples detected only by AB5-AB2 are in the lower right quadrant (above the AB5-AB2 threshold but below the AB2-AB2 threshold).
We next further investigated the implications of these findings for overall performance in analyzing patient samples. A comparison of the AB5-AB2 sandwich (indicating capture with AB5 and detection with AB2) to the AB2-AB2 sandwich showed improved performance using AB5 as the capture antibody (Fig. 5B). Using a threshold at which two pancreatitis patient samples are elevated (two false-positives, or a specificity of 38/40 = 95%), the AB2-AB2 sandwich detected 77 of the 124 cancer patients (sensitivity = 62%), and the AB5-AB2 sandwich detected 85 of the 124 cancer patients (sensitivity = 68.5%). Ten cancer samples were uniquely detected by AB5-AB2, and two were uniquely detected by AB2-AB2, for net increase of eight samples by AB5-AB2. The 10 samples that were uniquely detected by AB5-AB2 were well above the threshold for that assay (Fig. 5B). Since the signal strengths are similar between these two assays (Fig. 2), the ability of AB5-AB2 to detect additional samples is probably due to the display of either sialyl-Lewis C or Neu5Gc, so that they are captured by AB5 but not by AB2. The pancreatitis patient samples do not show increased signal using the AB5-AB2 sandwich, suggesting that the elevations in sialyl-Lewis C and Neu5Gc are highly specific for cancer. Thus it appears that the broader specificity of the AB5 antibody is useful for the detection of an increased number of cancer patients without increasing detection of the control subjects. This feature may be valuable for clinical assays and also suggests the value of detecting multiple, complementary glycans to improve overall accuracy of cancer detection [32].
Discussion
The CA 19-9 antigen is the only FDA-approved test for pancreatic cancer and is the currently the most accurate single marker for pancreatic cancer. Considering its importance in ongoing biomarker research for pancreatic cancer, it was important to optimize the detection of CA 19-9, which involves comparing between some of the many antibodies that have been developed. We performed a thorough comparison of the various CA 19-9 antibodies, looking at signal strength, accuracy for discriminating between cancer and control subjects, and the specificity for binding particular glycan structures. We found that the various antibodies generally gave good detection of elevations of glycan markers in plasma from pancreatic cancer patients relative to control subjects. However, differences between the antibodies were evident in the specific patients that were detected (Fig. 3 and Fig. 5). Certain antibodies have a broader specificity beyond sialyl-Lewis A, the canonical CA 19-9 antigen. The related antigen, sialyl-Lewis C, was found to be elevated in a subset of cancer patients (Fig. 5A), leading to overall improved biomarker performance for antibody with the broader specificity. This analysis will be useful for optimizing detection of cancer patients using the CA 19-9 assay but also for understanding the factors that may further improve upon the assay.
This work highlights the value of cancer-associated glycans for cancer detection and the need for expanding the repertoire of cancer-associated glycans used as biomarkers. The elevation of the CA 19-9 antigen was highly specific for cancer, as observed in other studies [2]. The fact that cancer detection was improved using the antibody with broader specificity beyond the sialyl-Lewis A antigen indicates that the additional glycans were also elevated in a cancer-specific manner. Indeed, sialyl-Lewis C, which can be detected using the Dupan-2 antibody, previously was found to be elevated in pancreatic cancer [31, 33], and the Neu5Gc modification was shown to accumulate in various carcinomas [34]. The sialyl-Lewis C structure is likely to be made in individuals that do not have active fucosyltransferase-3 (FUT3), which is required for converting sialyl-Lewis C to sialyl-Lewis A. The complementary elevation of either sialyl-Lewis C or sialyl-Lewis A means that the detection of both antigens in a biomarker panel should give improved performance over either individually, as previously demonstrated [29–31]. In the case of AB5, both antigens can be detected in one assay, obviating the separate detection using Dupan-2. Important questions that remain involve the identification of additional cancer-associated structures and developing the ability to detect more patients using a broader range of glycans. In addition, it will be valuable to assess the value of cancer associated glycans in a broader range of uses for biomarkers, such as treatment prediction and monitoring. These issues are discussed below.
An additional provocative finding was that AB5 but not AB2 bound sialyl-Lewis A that was modified with Neu5Gc instead of Neu5Ac, which raises the question of the value of detecting Neu5Gc in cancer-associated glycans. We were not able to assess which patients incorporated the Neu5Gc modification into their sialyl-Lewis A structures, since we did not have an assay specific for that modification. As assessment of which patients display the Neu5Gc modification would allow us to determine the importance for detecting cancer of using antibodies that are permissive to this variant. It is possible that other structures besides sialyl-Lewis A incorporate Neu5Gc at an elevated level in cancer and could be useful as cancer markers [25].
This study shows the importance of genotype in the detection of cancer-associated glycans. Many glycan structures are greatly affected by the genotype of the enzymes that are involved in their biosynthesis. Certain naturally-occurring genotypic variants of glycosyltransferases are inactive or have altered specificity. The most prominent example is the ABO blood type, which is determined by specific point mutations in the ABO transferase gene [35]. Likewise, the Lewis family of glycan structures is affected by genotype, primarily in the fucosyltransferase-2 (FUT2) and fucosyltransferase-3 (FUT3) genes. The activity of FUT2, also known as the secretor gene, favors the formation of Lewis Y and Lewis B, whereas FUT2 inactivity favors Lewis X and Lewis A. Two naturally-occurring point mutations lead to inactivity of FUT2, which correlate with increased CA 19-9 detection [29], as expected. In contrast, the genotypic inactivity of FUT3 leads to lower CA 19-9 formation [28, 29, 36]. Point mutations affecting enzymatic activity would be expected to have the most pronounced effects when redundancy of other enzymes is low, that is, in cases where other enzymes would not make up for the genotypic loss.
A more detailed understanding of the range of glycan structures that are made by individuals with specific genotypes could lead to overall improved detection of cancer. Such an analysis could be valuable for enhancing the detection of patients that are not optimally detected by CA 19-9. Although CA 19-9 is the current best marker for pancreatic cancer, a significant number of patients (about 20%) do not elevate this antigen due to genotypic inactivity or other causes. A characterization of the glycan structures that are made instead of the CA 19-9 antigen would allow the development of a panel of assays that together could detect a higher percentage of patients. It is known that the Dupan-2 assay can detect some patients that do not make CA 19-9 [30, 31], but Dupan-2 does not cover all CA 19-9-low patients. An important goal will be to match each patient genotype (for example in the FUT2 and FUT3 genes) with the glycan structures that are elevated and the assays that optimally detect those structures. The combination of glycan array and antibody array methods demonstrated here are powerful for pursuing that goal. The array-based methods should be combined with the discovery capabilities of mass-spectrometry-based glycoproteomic methods [37–39].
In summary, we have found that distinct CA 19-9 monoclonal antibodies have varying specificities for structures that are related to sialyl-Lewis A, and that this variation has implications for detecting specific patient samples. Since cancer patients display elevations in a range of glycan structures, with variation between patients, the antibody with broader specificity showed better overall performance in a biomarker assay. The detection of additional cancer-associated structures, combined with genotype information to predict the glycan structures that should be elevated in each individual patient, could lead to further improved cancer detection. It will be valuable to more precisely characterize the glycan structures that are made by cancer patients in additional to the CA 19-9 antigen and to develop assays for their detection. In addition, the application of these strategies to other cancer types besides pancreatic cancer holds promise for the development of effective biomarkers.
Acknowledgments
We thank Dr. David Smith and the members of Core H of the Consortium for Functional Glycomics for the glycan array analysis. We gratefully acknowledge funding of this research by the Early Detection Research Network and the Innovative Molecular Analysis Technologies programs of the National Cancer Institute (1U01CA152653 and R33 CA122890) and the Van Andel Research Institute.
References
- 1.Goonetilleke KS, Siriwardena AK. Systematic review of carbohydrate antigen (CA 19-9) as a biochemical marker in the diagnosis of pancreatic cancer. Eur J Surg Oncol. 2007;33:266–270. doi: 10.1016/j.ejso.2006.10.004. [DOI] [PubMed] [Google Scholar]
- 2.Molina V, Visa L, Conill C, Navarro S, et al. CA 19-9 in pancreatic cancer: retrospective evaluation of patients with suspicion of pancreatic cancer. Tumour Biol. 2011 doi: 10.1007/s13277-011-0297-8. [DOI] [PubMed] [Google Scholar]
- 3.Tempero MA, Uchida E, Takasaki H, Burnett DA, et al. Relationship of carbohydrate antigen 19-9 and Lewis antigens in pancreatic cancer. Cancer research. 1987;47:5501–5503. [PubMed] [Google Scholar]
- 4.Barton JG, Bois JP, Sarr MG, Wood CM, et al. Predictive and prognostic value of CA 19-9 in resected pancreatic adenocarcinoma. J Gastrointest Surg. 2009;13:2050–2058. doi: 10.1007/s11605-009-0849-z. [DOI] [PubMed] [Google Scholar]
- 5.Ishii H, Okada S, Sato T, Wakasugi H, et al. CA 19-9 in evaluating the response to chemotherapy in advanced pancreatic cancer. Hepato-gastroenterology. 1997;44:279–283. [PubMed] [Google Scholar]
- 6.Micke O, Bruns F, Schafer U, Kurowski R, et al. CA 19-9 in the therapy monitoring and follow-up of locally advanced cancer of the exocrine pancreas treated with radiochemotherapy. Anticancer research. 2003;23:835–840. [PubMed] [Google Scholar]
- 7.Hess V, Glimelius B, Grawe P, Dietrich D, et al. CA 19-9 tumour-marker response to chemotherapy in patients with advanced pancreatic cancer enrolled in a randomised controlled trial. The lancet oncology. 2008;9:132–138. doi: 10.1016/S1470-2045(08)70001-9. [DOI] [PubMed] [Google Scholar]
- 8.Boeck S, Haas M, Laubender RP, Kullmann F, et al. Application of a time-varying covariate model to the analysis of CA 19-9 as serum biomarker in patients with advanced pancreatic cancer. Clin Cancer Res. 2010;16:986–994. doi: 10.1158/1078-0432.CCR-09-2205. [DOI] [PubMed] [Google Scholar]
- 9.Varki A, Cummings R, Esko J, Freeze H, et al. Essentials of Glycobiology. Cold Spring Harbor Laboratory Press; Cold Spring Harbor, NY: 2009. [PubMed] [Google Scholar]
- 10.Lahdenne P, Pitkanen S, Rajantie J, Kuusela P, et al. Tumor markers CA 125 and CA 19-9 in cord blood during infancy: developmental changes and use in pediatric germ cell tumors. Pediatr Res. 1995;38:797–801. doi: 10.1203/00006450-199511000-00026. [DOI] [PubMed] [Google Scholar]
- 11.Magnani JL, Steplewski Z, Koprowski H, Ginsburg V. Identification of the gastrointestinal and pancreatic cancer-associated antigen detected by monoclonal antibody 19-9 in the sera of patients as a mucin. Cancer research. 1983;43:5489–5492. [PubMed] [Google Scholar]
- 12.Kalthoff H, Kreiker C, Schmiegel WH, Greten H, Thiele HG. Characterization of CA 19-9 bearing mucins as physiological exocrine pancreatic secretion products. Cancer research. 1986;46:3605– 3607. [PubMed] [Google Scholar]
- 13.Yue T, Partyka K, Maupin KA, Hurley M, et al. Identification of blood-protein carriers of the CA 19-9 antigen and characterization of prevalence in pancreatic diseases. Proteomics. 2011 doi: 10.1002/pmic.201000827. [DOI] [PMC free article] [PubMed] [Google Scholar]
- 14.Yue T, Goldstein IJ, Hollingsworth MA, Kaul K, et al. The prevalence and nature of glycan alterations on specific proteins in pancreatic cancer patients revealed using antibody-lectin sandwich arrays. Mol Cell Proteomics. 2009;8:1697–1707. doi: 10.1074/mcp.M900135-MCP200. [DOI] [PMC free article] [PubMed] [Google Scholar]
- 15.Manimala JC, Roach TA, Li Z, Gildersleeve JC. High-throughput carbohydrate microarray profiling of 27 antibodies demonstrates widespread specificity problems. Glycobiology. 2007;17:17C– 23C. doi: 10.1093/glycob/cwm047. [DOI] [PubMed] [Google Scholar]
- 16.Alper J. Glycobiology. Turning sweet on cancer. Science (New York, NY. 2003;301:159–160. doi: 10.1126/science.301.5630.159. [DOI] [PubMed] [Google Scholar]
- 17.Dennis JW, Granovsky M, Warren CE. Glycoprotein glycosylation and cancer progression. Biochimica et biophysica acta. 1999;1473:21–34. doi: 10.1016/s0304-4165(99)00167-1. [DOI] [PubMed] [Google Scholar]
- 18.Yue T, Haab BB. Microarrays in glycoproteomics research. Clin Lab Med. 2009;29:15–29. doi: 10.1016/j.cll.2009.01.001. [DOI] [PMC free article] [PubMed] [Google Scholar]
- 19.Forrester S, Kuick R, Hung KE, Kucherlapati R, Haab BB. Low-volume, high-throughput sandwich immunoassays for profiling plasma proteins in mice: identification of early-stage systemic inflammation in a mouse model of intestinal cancer. Molecular Oncology. 2007;1:216–225. doi: 10.1016/j.molonc.2007.06.001. [DOI] [PMC free article] [PubMed] [Google Scholar]
- 20.Drickamer K, Taylor ME. Glycan arrays for functional glycomics. Genome biology. 2002;3:REVIEWS 1034. doi: 10.1186/gb-2002-3-12-reviews1034. [DOI] [PMC free article] [PubMed] [Google Scholar]
- 21.Blixt O, Head S, Mondala T, Scanlan C, et al. Printed covalent glycan array for ligand profiling of diverse glycan binding proteins. Proceedings of the National Academy of Sciences of the United States of America. 2004;101:17033–17038. doi: 10.1073/pnas.0407902101. [DOI] [PMC free article] [PubMed] [Google Scholar]
- 22.Haab BB, Yue T. High-throughput studies of protein glycoforms using antibody-lectin sandwich arrays. Methods in molecular biology (Clifton, NJ. 2011;785:223–236. doi: 10.1007/978-1-61779-286-1_15. [DOI] [PMC free article] [PubMed] [Google Scholar]
- 23.Porter A, Yue T, Heeringa L, Day S, et al. A motif-based analysis of glycan array data to determine the specificities of glycan-binding proteins. Glycobiology. 2010;20:369–380. doi: 10.1093/glycob/cwp187. [DOI] [PMC free article] [PubMed] [Google Scholar]
- 24.Tangvoranuntakul P, Gagneux P, Diaz S, Bardor M, et al. Human uptake and incorporation of an immunogenic nonhuman dietary sialic acid. Proceedings of the National Academy of Sciences of the United States of America. 2003;100:12045–12050. doi: 10.1073/pnas.2131556100. [DOI] [PMC free article] [PubMed] [Google Scholar]
- 25.Inoue S, Sato C, Kitajima K. Extensive enrichment of N-glycolylneuraminic acid in extracellular sialoglycoproteins abundantly synthesized and secreted by human cancer cells. Glycobiology. 2010;20:752–762. doi: 10.1093/glycob/cwq030. [DOI] [PubMed] [Google Scholar]
- 26.Padler-Karavani V, Hurtado-Ziola N, Pu M, Yu H, et al. Human xeno-autoantibodies against a non-human sialic acid serve as novel serum biomarkers and immunotherapeutics in cancer. Cancer research. 2011;71:3352–3363. doi: 10.1158/0008-5472.CAN-10-4102. [DOI] [PMC free article] [PubMed] [Google Scholar]
- 27.Cakir B, Pankow JS, Salomaa V, Couper D, et al. Distribution of Lewis (FUT3)genotype and allele: frequencies in a biethnic United States population. Ann Hematol. 2002;81:558–565. doi: 10.1007/s00277-002-0508-x. [DOI] [PubMed] [Google Scholar]
- 28.Orntoft TF, Vestergaard EM, Holmes E, Jakobsen JS, et al. Influence of Lewis alpha1–3/4-L- fucosyltransferase (FUT3) gene mutations on enzyme activity, erythrocyte phenotyping, and circulating tumor marker sialyl-Lewis a levels. The Journal of biological chemistry. 1996;271:32260–32268. doi: 10.1074/jbc.271.50.32260. [DOI] [PubMed] [Google Scholar]
- 29.Narimatsu H, Iwasaki H, Nakayama F, Ikehara Y, et al. Lewis and secretor gene dosages affect CA19-9 and DU-PAN-2 serum levels in normal individuals and colorectal cancer patients. Cancer research. 1998;58:512–518. [PubMed] [Google Scholar]
- 30.Kawa S, Oguchi H, Kobayashi T, Tokoo M, et al. Elevated serum levels of Dupan-2 in pancreatic cancer patients negative for Lewis blood group phenotype. British journal of cancer. 1991;64:899–902. doi: 10.1038/bjc.1991.422. [DOI] [PMC free article] [PubMed] [Google Scholar]
- 31.Takasaki H, Uchida E, Tempero MA, Burnett DA, et al. Correlative study on expression of CA 19-9 and DU-PAN-2 in tumor tissue and in serum of pancreatic cancer patients. Cancer research. 1988;48:1435–1438. [PubMed] [Google Scholar]
- 32.Meany DL, Chan DW. Aberrant glycosylation associated with enzymes as cancer biomarkers. Clin Proteomics. 2011;8:7. doi: 10.1186/1559-0275-8-7. [DOI] [PMC free article] [PubMed] [Google Scholar]
- 33.Sessa F, Bonato M, Frigerio B, Capella C, et al. Ductal cancers of the pancreas frequently express markers of gastrointestinal epithelial cells. Gastroenterology. 1990;98:1655–1665. doi: 10.1016/0016-5085(90)91104-e. [DOI] [PubMed] [Google Scholar]
- 34.Malykh YN, Schauer R, Shaw L. N-Glycolylneuraminic acid in human tumours. Biochimie. 2001;83:623–634. doi: 10.1016/s0300-9084(01)01303-7. [DOI] [PubMed] [Google Scholar]
- 35.Yamamoto F, Clausen H, White T, Marken J, Hakomori S. Molecular genetic basis of the histo- blood group ABO system. Nature. 1990;345:229–233. doi: 10.1038/345229a0. [DOI] [PubMed] [Google Scholar]
- 36.Elmgren A, Mollicone R, Costache M, Borjeson C, et al. Significance of individual point mutations, T202C and C314T, in the human Lewis (FUT3) gene for expression of Lewis antigens by the human alpha(1,3/1,4)-fucosyltransferase, Fuc-TIII. The Journal of biological chemistry. 1997;272:21994– 21998. doi: 10.1074/jbc.272.35.21994. [DOI] [PubMed] [Google Scholar]
- 37.Yang Z, Harris LE, Palmer-Toy DE, Hancock WS. Multilectin affinity chromatography for characterization of multiple glycoprotein biomarker candidates in serum from breast cancer patients. Clinical chemistry. 2006;52:1897–1905. doi: 10.1373/clinchem.2005.065862. [DOI] [PubMed] [Google Scholar]
- 38.Song X, Lasanajak Y, Xia B, Heimburg-Molinaro J, et al. Shotgun glycomics: a microarray strategy for functional glycomics. Nature methods. 2011;8:85–90. doi: 10.1038/nmeth.1540. [DOI] [PMC free article] [PubMed] [Google Scholar]
- 39.Zhao J, Qiu W, Simeone DM, Lubman DM. N-linked glycosylation profiling of pancreatic cancer serum using capillary liquid phase separation coupled with mass spectrometric analysis. Journal of proteome research. 2007;6:1126–1138. doi: 10.1021/pr0604458. [DOI] [PubMed] [Google Scholar]